The first two simple introduction about prometheus, this section was originally written to build node_exporter and cAdvisor, but a lot of online tutorials, so write directly to the whole environment of the deployment process
First, architecture
Our original system architecture is as a business machine with two virtual machines, deploy a Load Balance, user access LB, LB according to specific rules forward traffic to the internal virtual machine VM1 / VM2. And VM1 / VM2 to form a local area network, the outside world can not be accessed directly, only through the LB jump to the VM1 / VM2
prometheus optimal deployment scenario is to deploy prometheus node to the VM1 / VM2 LAN, a port is exposed outside, or connected directly prometheus NAT rules provided on an LB, the advantage of this is:
1, VM1 / VM2 / prometheus composed of local area network, can not access the outside world;
2, and the default node_exporter cAdvisor is http protocol, the data collected to avoid the VM1 / VM2 external network transmission
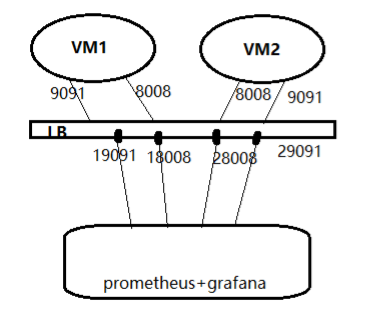
But for various reasons, our prometheus can only be deployed to the outside, so the system architecture as shown below: node_exporter and cAdvisor deployed on VM1 / VM2 port of external exposure to 9091 and 8008 (customizable) by LB NAT port forwarding mapping to the LB. And then they were to collect the following four monitoring data port by prometheus.
Second, the deployment process
1, were deployed node_exporter on VM1 and VM2
2、