Grafana set for Kubernetes monitoring of APP, and Grafana-Zabbix App is similar, but the configuration is too much trouble at first glance, the main parameters are from K8S.
Details of this APP, please refer to Grafana App for Kubernetes
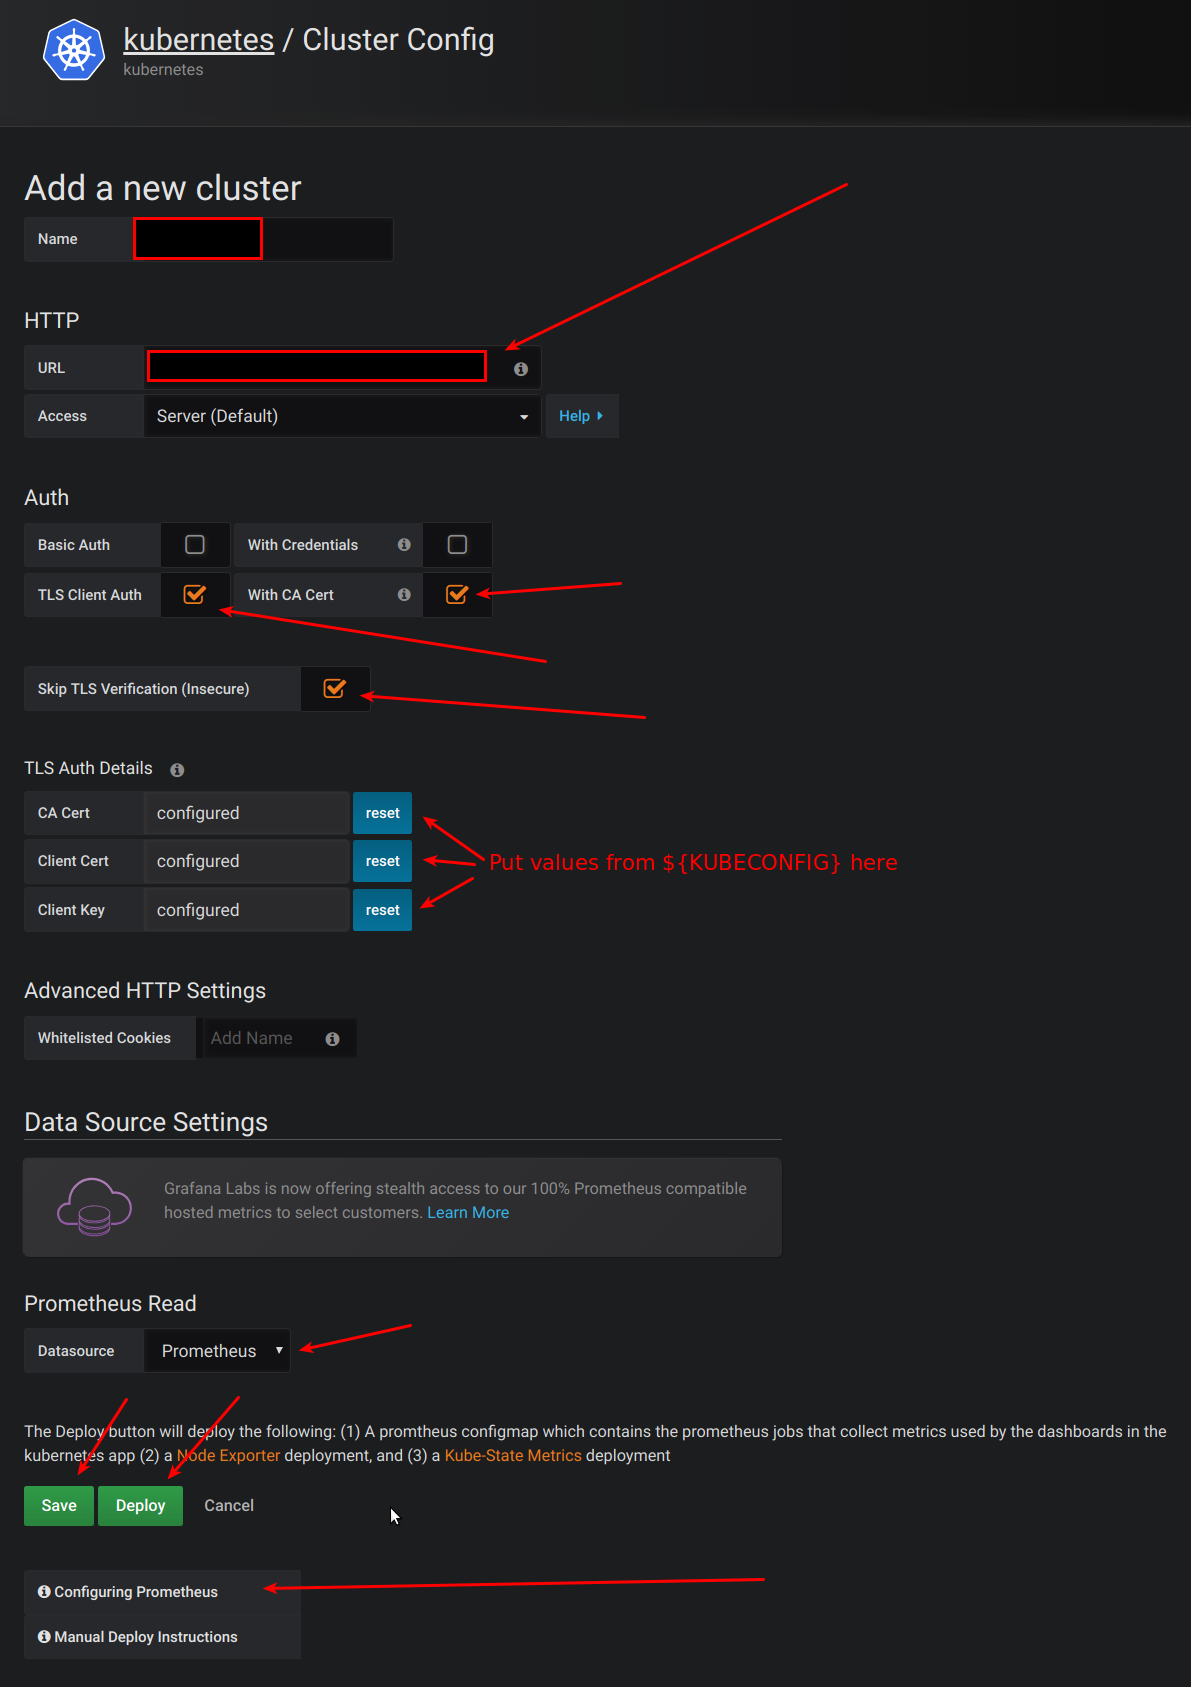
#CA Cert
cat ~/.kube/config | grep certificate-authority-data | cut -d ' ' -f 6 | base64 -d
#Client Cert
cat ~/.kube/config | grep client-certificate-data | cut -d ' ' -f 6 | base64 -d
#Client Key
cat ~/.kube/config | grep client-key-data | cut -d ' ' -f 6 | base64 -d
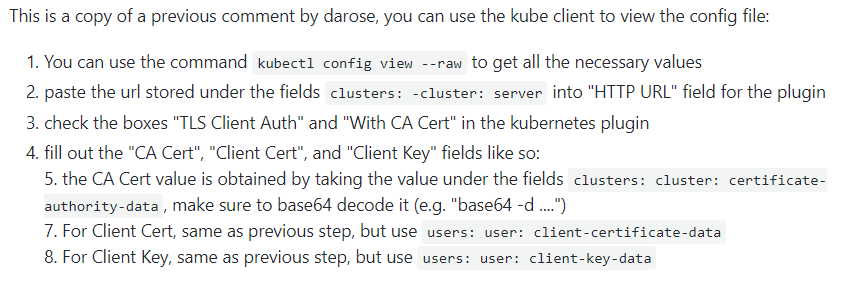
1. all the needed data is stored in your .kube/config YAML file

2. paste the url stored in the "clusters.cluster.server" .kube/config field into the "HTTP URL" field for the plugin
注意:当你填写了以上信息,你相当于把K8S集群的钥匙交给了Grafana,请务必做好安全和防护,确保填写的证书和秘钥不能泄露!!!!
参考1
参考2