
Learn how to visualize the memory usage of MySQL connections.
Author: Benjamin Dicken
Source of this article and cover: https://planetscale.com/blog/, translated by the Axon open source community.
This article is about 3,000 words and is expected to take 10 minutes to read.
introduction
When considering the performance of any software, there is a typical trade-off between time and space. In the process of evaluating MySQL query performance, we often focus on execution time (or query latency) as the main indicator of query performance. This is a good metric to use because ultimately we want to get query results as quickly as possible.
I recently published a blog post on How to Identify and Analyze Problematic MySQL Queries , which focused on measuring poor performance in terms of execution time and row reads. However, memory consumption has been largely ignored in this discussion.
Although it may not be needed often, MySQL also has built-in mechanisms to provide insight into how much memory is used by queries and what that memory is used for. Let's dig into this feature and see how you can monitor the memory usage of MySQL connections in real time.
Memory statistics
In MySQL, there are many components of the system that can be instrumented individually. The performance_schema.setup_instrumentstable lists each component, and there are quite a few:
SELECT count(*) FROM performance_schema.setup_instruments;

+----------+
| count(*) |
+----------+
| 1255     |
+----------+
This table contains many tools that can be used for memory analysis. To see what's available, try selecting from the table and filtering by memory/.
SELECT name, documentation
  FROM performance_schema.setup_instruments
  WHERE name LIKE 'memory/%';
You should see hundreds of results. Each of these represents a different category of memory and can be detected individually in MySQL. Some of these categories include a short paragraph documentationdescribing what that memory category represents or is used for. If you only want to see memory types with non-null values documentation, you can run:
SELECT name, documentation
  FROM performance_schema.setup_instruments
  WHERE name LIKE 'memory/%'
  AND documentation IS NOT NULL;
Each of these memory classes can be sampled at several different granularities. Different levels of granularity are stored in multiple tables:
SELECT table_name
  FROM information_schema.tables
  WHERE table_name LIKE '%memory_summary%'
  AND table_schema = 'performance_schema';

+-----------------------------------------+
| TABLE_NAME                              |
+-----------------------------------------+
| memory_summary_by_account_by_event_name |
| memory_summary_by_host_by_event_name    |
| memory_summary_by_thread_by_event_name  |
| memory_summary_by_user_by_event_name    |
| memory_summary_global_by_event_name     |
+-----------------------------------------+
- memory_summary_by_account_by_event_name: Summarize memory events by account (account is a combination of user and host)
- memory_summary_by_host_by_event_name: summarizes memory events at host granularity
- memory_summary_by_thread_by_event_name: Summarize memory events at MySQL thread granularity
- memory_summary_by_user_by_event_name: Summarize memory events at user granularity
- memory_summary_global_by_event_name: Global summary of memory statistics
Note that there is no specific tracking of memory usage at each query level. However, that doesn't mean we can't analyze the memory usage of our queries! To achieve this, we can monitor the memory usage on any connection that is executing the query of interest. Therefore, we will focus on using tables memory_summary_by_thread_by_event_namebecause there is a convenient mapping between MySQL connections and threads.
Find the purpose of the connection
At this point, you should set up two separate connections to the MySQL server on the command line. The first is the query that executes the query for which you want to monitor memory usage. The second one will be used for monitoring purposes.
On the first connection, run these queries to get the connection ID and thread ID.
SET @cid = (SELECT CONNECTION_ID());
SET @tid = (SELECT thread_id
    FROM performance_schema.threads
    WHERE PROCESSLIST_ID=@cid);
Then get these values. Of course, yours may look different than what you see here.
SELECT @cid, @tid;


+------+------+
| @cid | @tid |
+------+------+
|   49 |   89 |
+------+------+
Next, execute some long-running queries for which you want to analyze memory usage. For this example, I'm going to perform a large operation from a table with 100 million rows, which should take a while because aliasthere is no index on the SELECT column:
SELECT alias FROM chat.message ORDER BY alias DESC LIMIT 100000;
Now, while executing, switch to another console connection and run the following command, replacing thread ID with the thread ID from your connection:
SELECT
    event_name,
    current_number_of_bytes_used
FROM performance_schema.memory_summary_by_thread_by_event_name
WHERE thread_id = YOUR_THREAD_ID
ORDER BY current_number_of_bytes_used DESC
You should see results similar to this, although the details depend heavily on your query and data:
+---------------------------------------+------------------------------+
| event_name                            | current_number_of_bytes_used |
+---------------------------------------+------------------------------+
| memory/sql/Filesort_buffer::sort_keys | 203488                       |
| memory/innodb/memory                  | 169800                       |
| memory/sql/THD::main_mem_root         | 46176                        |
| memory/innodb/ha_innodb               | 35936                        |
...
This indicates the amount of memory being used by each category when executing this query. If you SELECT alias...run this query multiple times while executing another query, you may see different results because the memory usage of the query is not necessarily constant throughout its execution. Each execution of this query represents a sample at some point in time. So if we want to understand how usage changes over time, we need to take many samples.
memory/sql/Filesort_buffer::sort_keysdocumentationis missing from the table performance_schema.setup_instruments.
SELECT name, documentation
    FROM performance_schema.setup_instruments
    WHERE name LIKE 'memory%sort_keys';

+---------------------------------------+---------------+
| name                                  | documentation |
+---------------------------------------+---------------+
| memory/sql/Filesort_buffer::sort_keys | <null>        |
+---------------------------------------+---------------+
However, the name indicates that it is the memory used to sort the data in the file. This makes sense since most of the cost of this query will be sorting the data so that it can be displayed in descending order.
Collect usage over time
Next, we need to be able to sample memory usage over time. This won't be that useful for short queries, as we can only execute this query once, or a small number of times while executing the analytic query. This is more useful for longer running queries (queries that take seconds or minutes). Regardless, these are the types of queries we want to analyze since these queries are likely to use most of the memory.
This can be implemented entirely in SQL and called via stored procedures. However, in this case we use a separate script in Python to provide monitoring.
#!/usr/bin/env python3

import time
import MySQLdb
import argparse

MEM_QUERY='''
SELECT event_name, current_number_of_bytes_used
  FROM performance_schema.memory_summary_by_thread_by_event_name
  WHERE thread_id = %s
  ORDER BY current_number_of_bytes_used DESC LIMIT 4
'''

parser = argparse.ArgumentParser()
parser.add_argument('--thread-id', type=int, required=True)
args = parser.parse_args()

dbc = MySQLdb.connect(host='127.0.0.1', user='root', password='password')
c = dbc.cursor()

ms = 0
while(True):
    c.execute(MEM_QUERY, (args.thread_id,))
    results = c.fetchall()
    print(f'\n## Memory usage at time {ms} ##')
    for r in results:
        print(f'{r[0][7:]} -> {round(r[1]/1024,2)}Kb')
    ms+=250
    time.sleep(0.25)
This is a simple first attempt at this type of monitoring script. In summary, this code does the following:
- Get the provided thread ID to monitor via command line
- Set up a connection to the MySQL database
- Execute a query every 250 ms to get the 4 most used memory categories and print the reading
This can be adapted in a variety of ways depending on your analysis needs. For example, adjust the frequency of pings to the server or change the number of memory classes listed per iteration. Running this command while executing a query provides the following results:
...
## Memory usage at time 4250 ##
innodb/row0sel -> 25.22Kb
sql/String::value -> 16.07Kb
sql/user_var_entry -> 0.41Kb
innodb/memory -> 0.23Kb


## Memory usage at time 4500 ##
innodb/row0sel -> 25.22Kb
sql/String::value -> 16.07Kb
sql/user_var_entry -> 0.41Kb
innodb/memory -> 0.23Kb


## Memory usage at time 4750 ##
innodb/row0sel -> 25.22Kb
sql/String::value -> 16.07Kb
sql/user_var_entry -> 0.41Kb
innodb/memory -> 0.23Kb


## Memory usage at time 5000 ##
innodb/row0sel -> 25.22Kb
sql/String::value -> 16.07Kb
sql/user_var_entry -> 0.41Kb
innodb/memory -> 0.23Kb
...
It's great, but has some weaknesses. It's nice to see something beyond the first 4 memory usage categories, but increasing that number will increase the size of this already large output dump. It would be nice if there was an easier way to understand memory usage at a glance with some visualization. This can be done by having the script dump the results to CSV or JSON and then load them in the visualizer. Even better, we can plot real-time results as the data flows in. This provides an updated view and allows us to observe memory usage as it is happening in real time, all in one tool.
Plot memory usage
In order to make the tool more useful and provide visualization, some changes will be made.
- The user will provide the connection ID on the command line and the script will be responsible for finding the underlying thread.
- The frequency with which the script requests memory data can also be configured via the command line.
- This
matplotliblibrary will be used to generate visualizations of memory usage. This will contain a stack plot with a legend showing the highest memory usage category and will keep the past 50 samples.
This is quite a lot of code, but it's included here for completeness.
#!/usr/bin/env python3

import matplotlib.pyplot as plt
import numpy as np
import MySQLdb
import argparse

MEM_QUERY='''
SELECT event_name, current_number_of_bytes_used
  FROM performance_schema.memory_summary_by_thread_by_event_name
  WHERE thread_id = %s
  ORDER BY event_name DESC'''

TID_QUERY='''
SELECT  thread_id
  FROM performance_schema.threads
  WHERE PROCESSLIST_ID=%s'''

class MemoryProfiler:

    def __init__(self):
        self.x = []
        self.y = []
        self.mem_labels = ['XXXXXXXXXXXXXXXXXXXXXXX']
        self.ms = 0
        self.color_sequence = ['#ffc59b', '#d4c9fe', '#a9dffe', '#a9ecb8',
                               '#fff1a8', '#fbbfc7', '#fd812d', '#a18bf5',
                               '#47b7f8', '#40d763', '#f2b600', '#ff7082']
        plt.rcParams['axes.xmargin'] = 0
        plt.rcParams['axes.ymargin'] = 0
        plt.rcParams["font.family"] = "inter"

    def update_xy_axis(self, results, frequency):
        self.ms += frequency
        self.x.append(self.ms)
        if (len(self.y) == 0):
            self.y = [[] for x in range(len(results))]
        for i in range(len(results)-1, -1, -1):
            usage = float(results[i][1]) / 1024
            self.y[i].append(usage)
        if (len(self.x) > 50):
            self.x.pop(0)
            for i in range(len(self.y)):
                self.y[i].pop(0)

    def update_labels(self, results):
        total_mem = sum(map(lambda e: e[1], results))
        self.mem_labels.clear()
        for i in range(len(results)-1, -1, -1):
            usage = float(results[i][1]) / 1024
            mem_type = results[i][0]
            # Remove 'memory/' from beginning of name for brevity
            mem_type = mem_type[7:]
            # Only show top memory users in legend
            if (usage < total_mem / 1024 / 50):
                mem_type = '_' + mem_type
            self.mem_labels.insert(0, mem_type)

    def draw_plot(self, plt):
        plt.clf()
        plt.stackplot(self.x, self.y, colors = self.color_sequence)
        plt.legend(labels=self.mem_labels, bbox_to_anchor=(1.04, 1), loc="upper left", borderaxespad=0)
        plt.xlabel("milliseconds since monitor began")
        plt.ylabel("Kilobytes of memory")

    def configure_plot(self, plt):
        plt.ion()
        fig = plt.figure(figsize=(12,5))
        plt.stackplot(self.x, self.y, colors=self.color_sequence)
        plt.legend(labels=self.mem_labels, bbox_to_anchor=(1.04, 1), loc="upper left", borderaxespad=0)
        plt.tight_layout(pad=4)
        return fig

    def start_visualization(self, database_connection, connection_id, frequency):
        c = database_connection.cursor();
        fig = self.configure_plot(plt)
        while(True):
            c.execute(MEM_QUERY, (connection_id,))
            results = c.fetchall()
            self.update_xy_axis(results, frequency)
            self.update_labels(results)
            self.draw_plot(plt)
            fig.canvas.draw_idle()
            fig.canvas.start_event_loop(frequency / 1000)

def get_command_line_args():
    '''
    Process arguments and return argparse object to caller.
    '''
    parser = argparse.ArgumentParser(description='Monitor MySQL query memory for a particular connection.')
    parser.add_argument('--connection-id', type=int, required=True,
                        help='The MySQL connection to monitor memory usage of')
    parser.add_argument('--frequency', type=float, default=500,
                        help='The frequency at which to ping for memory usage update in milliseconds')
    return parser.parse_args()

def get_thread_for_connection_id(database_connection, cid):
    '''
    Get a thread ID corresponding to the connection ID
    PARAMS
      database_connection - Database connection object
      cid - The connection ID to find the thread for
    '''
    c = database_connection.cursor()
    c.execute(TID_QUERY, (cid,))
    result = c.fetchone()
    return int(result[0])

def main():
    args = get_command_line_args()
    database_connection = MySQLdb.connect(host='127.0.0.1', user='root', password='password')
    connection_id = get_thread_for_connection_id(database_connection, args.connection_id)
    m = MemoryProfiler()
    m.start_visualization(database_connection, connection_id, args.frequency)
    connection.close()

if __name__ == "__main__":
    main()
With this, we can perform detailed monitoring of the execution of MySQL queries. To use it, first get the connection ID of the connection you want to analyze:
SELECT CONNECTION_ID();
Then, executing the following command will start the monitoring session:
./monitor.py --connection-id YOUR_CONNECTION_ID --frequency 250
When executing queries against the database, we can observe the increase in memory usage and see which categories contribute the most to memory.
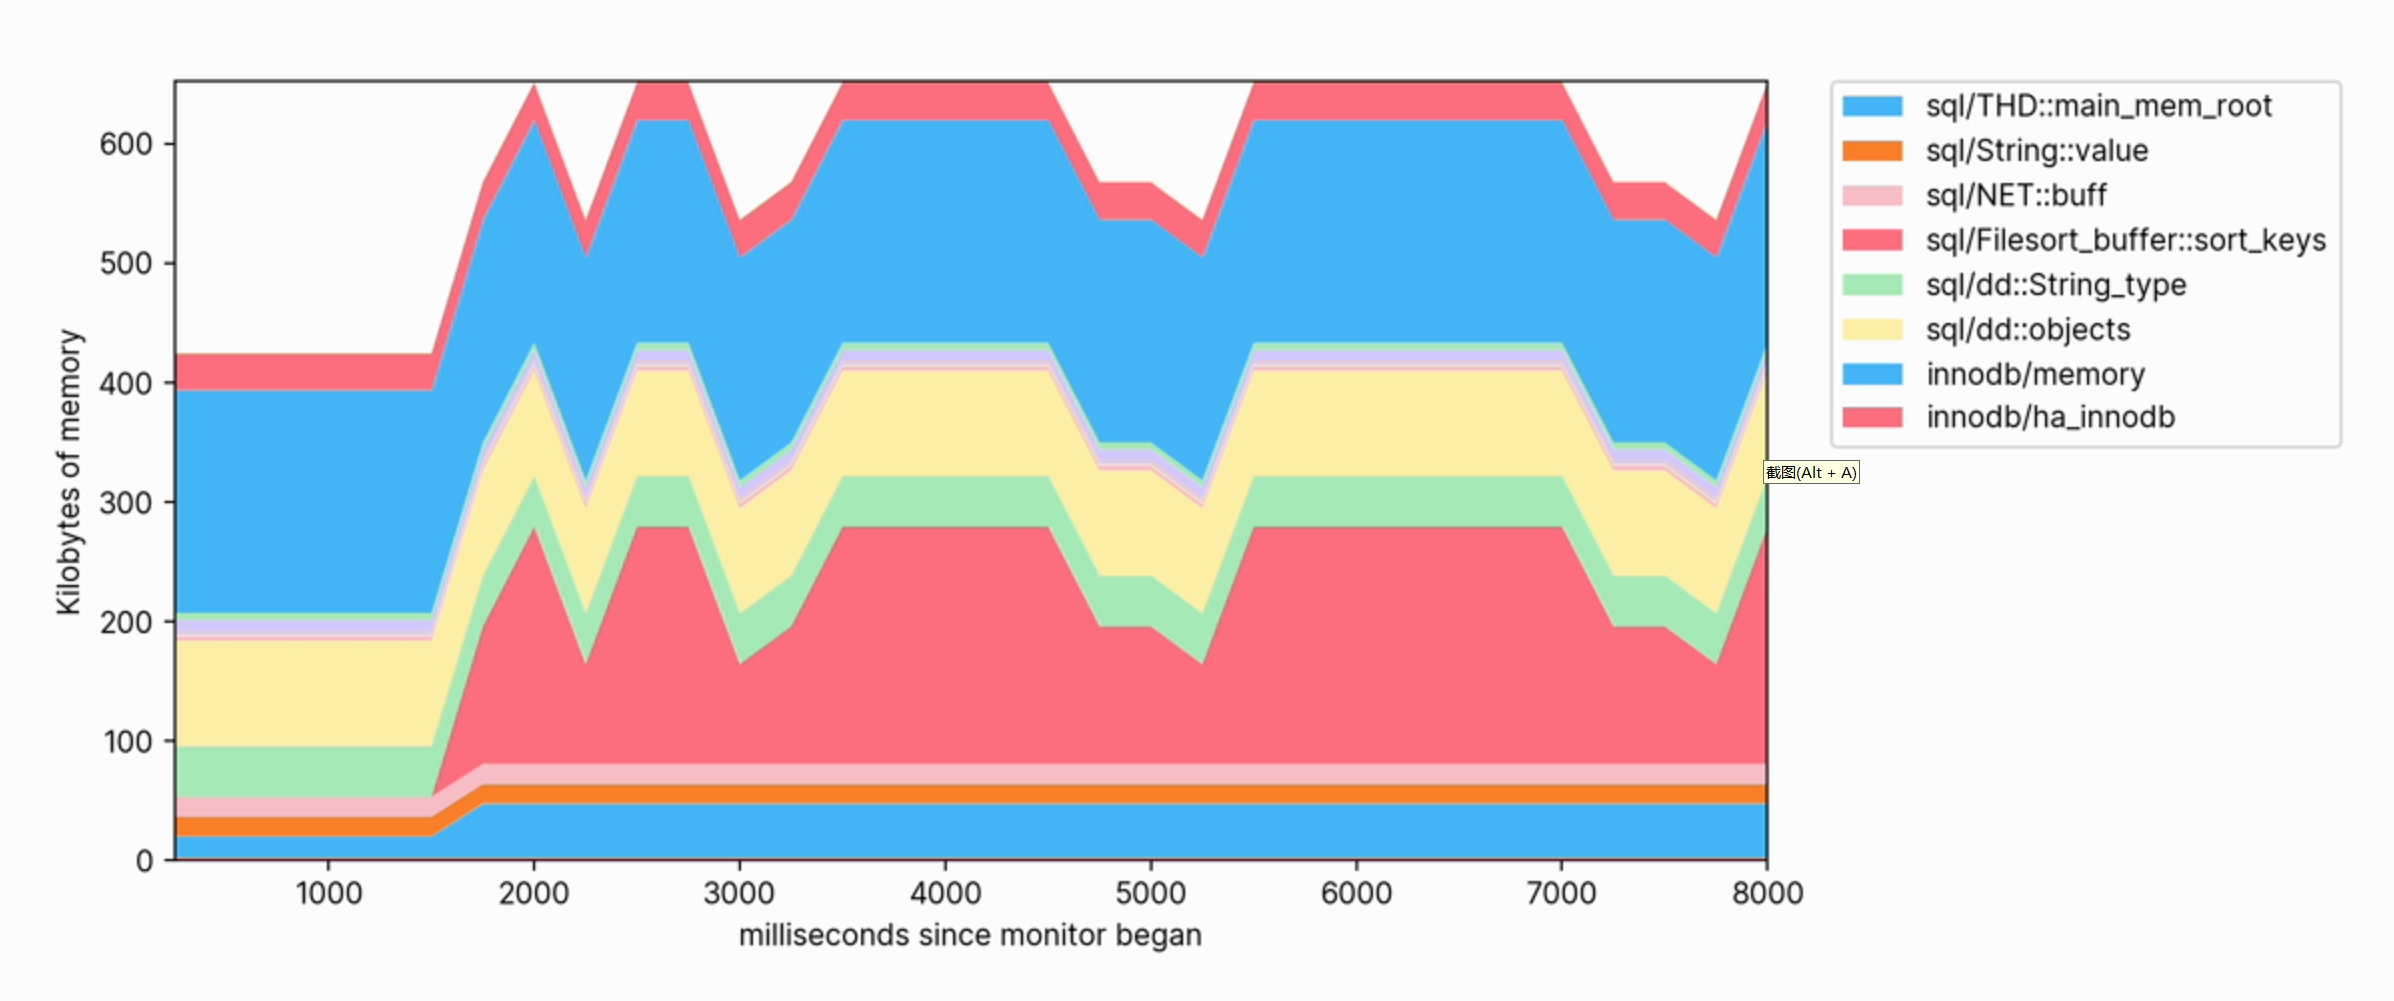
This visualization also helps us clearly see which operations consume memory. For example, the following is a snippet of the memory profile used to create a FULLTEXT index on a large table:
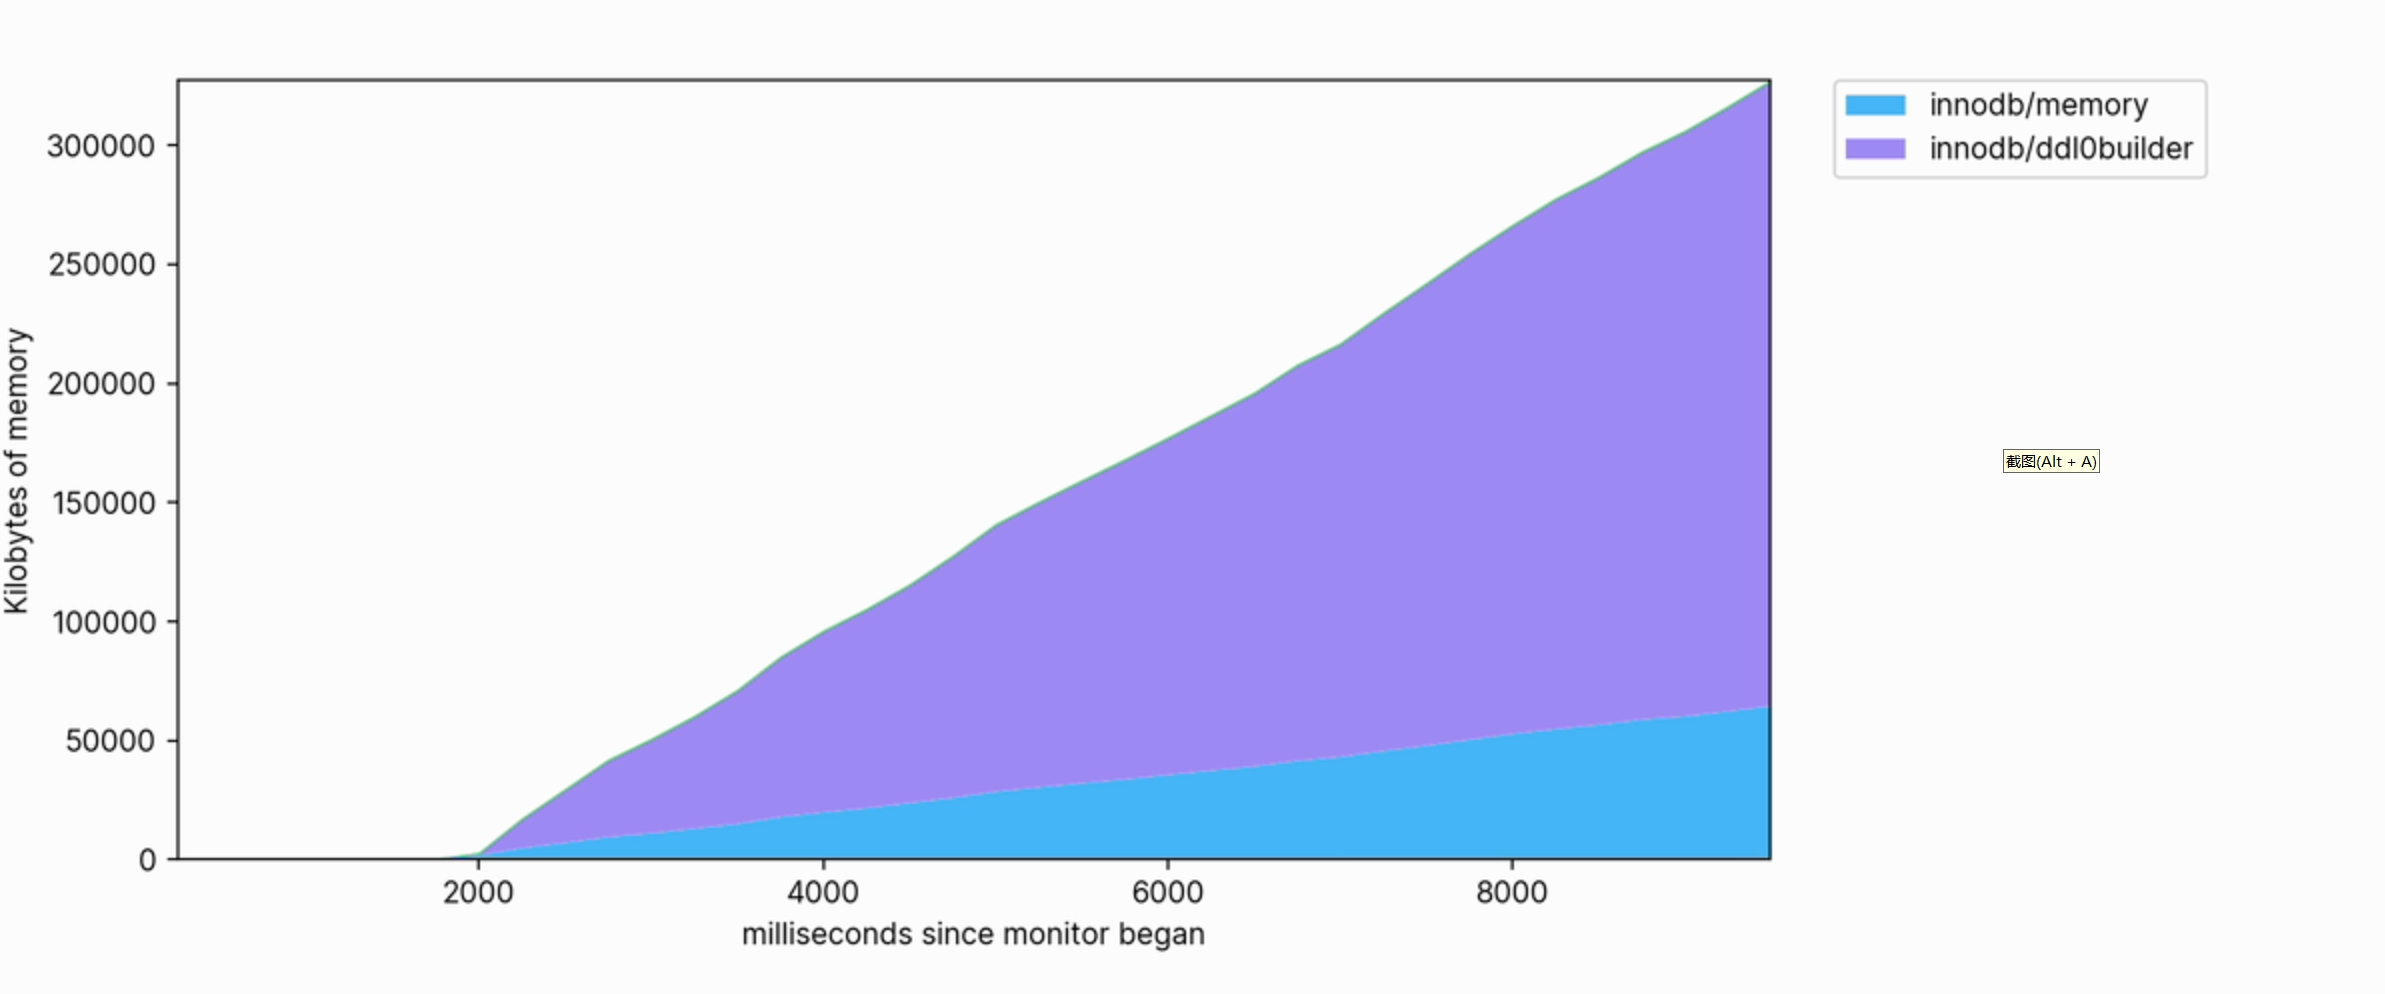
The memory usage is large and continues to grow to use hundreds of megabytes as it executes.
in conclusion
Although it may not be needed often, the ability to obtain detailed memory usage information can be extremely valuable when detailed query optimization is required. Doing so can reveal when and why MySQL is putting memory pressure on the system, or if a memory upgrade is needed on the database server. MySQL provides many primitives based on which you can develop analytical tools for your queries and workloads.
For more technical articles, please visit: https://opensource.actionsky.com/
About SQLE
SQLE is a comprehensive SQL quality management platform that covers SQL auditing and management from development to production environments. It supports mainstream open source, commercial, and domestic databases, provides process automation capabilities for development and operation and maintenance, improves online efficiency, and improves data quality.
SQLE get
| type | address |
|---|---|
| Repository | https://github.com/actiontech/sqle |
| document | https://actiontech.github.io/sqle-docs/ |
| release news | https://github.com/actiontech/sqle/releases |
| Data audit plug-in development documentation | https://actiontech.github.io/sqle-docs/docs/dev-manual/plugins/howtouse |