1. Background
The front-end exported PPT. I was new to this requirement and was still confused. Then I searched for information on the Internet and finally confirmed that it was feasible. This requirement is also reasonable. We made a visual data report, exported the report into PPT, and converted the online report Save as document type;
2. Technical solutions
To realize such complex functions, you have to rely on senior craftsmen. Fortunately, there is a relatively complete and easy-to-use library: pptxgenjs
There are only English documents: Quick Start Guide | PptxGenJS . It can also be used with the more familiar library: html2canvas to better realize a complete PPT.
3. Application of PptxGenJS
Introduce and generate a simple PPT document
import pptxgen from "pptxgenjs";

let pptx = new pptxgen();

let slide = pptx.addSlide();

slide.addText("React Demo!", { x: 1, y: 1, w: 10, fontSize: 36, fill: { color: "F1F1F1" }, align: "center" });

pptx.writeFile({ fileName: "react-demo.pptx" }
pptx global properties:
pptx.author = 'Brent Ely';
pptx.company = 'S.T.A.R. Laboratories';
pptx.revision = '15';
pptx.subject = 'Annual Report';
pptx.title = 'PptxGenJS Sample Presentation';
pptx.layout = 'LAYOUT_WIDE'; //13.5 x 7.5
The most important attribute, layout, as the name suggests, is to set the size of the PPT slide. The default is the following:
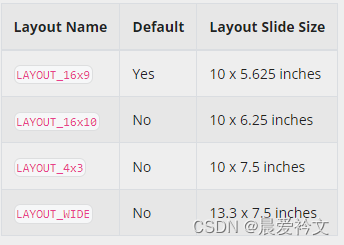
Can also be customized. This x*y is essential for calculating the layout of the subsequent PPT page;
slide master, customized PPT page template:
    ppt.defineSlideMaster({
      title: 'DEFAULT_SLIDE',
      objects: [
        { image: { x: 0.25, y: 0.3, w: 0.6, h: 0.6, path: path} },
        { image: { x: 10.8, y: 0.61, w: 1.485, h: 0.166, path: path} },
        { image: { x: 12.3, y: 0.52, w: 0.72, h: 0.36, path: path} },
        { line: { x: 0.25, y: 1, w: 12.8, h: 0, line: { color: '3874c5', width: 2 } } },
        { image: { path: path, x: 0, y: 7.2, w: '100%', h: 0.3, size: { type: 'cover' } } },
      ],
    });
When we create PPT ourselves, we will also reference templates. This is a custom template, which avoids setting it on every page;
slide, PPT page attribute object:
Create a page of PPT, addSilde({masterName}); masterName is the customized template above, which is the DEFAULT_SLIDE above
4. Add a table
Tables are a commonly used function, and PPT tables are also relatively complete, addTable();
For headers and totals, this pptx has no special processing and can only be processed as a normal row;
The row height problem is row Height. The table sets the height h. If the row height is not set, rowH, the table will be filled with h. If rowH is set, the minimum height will be displayed according to the rowH setting value;
Tables generally have a lot of data. The PPT page is so high that it will definitely exceed the PPT page. pptx supports custom paging, autoPage: true, and then combines autoPageCharWeight and autoPageLineWeight to debug paging. During actual use, it is found that automatic paging is also based on The rowH and H you set are calculated. If there are multiple rows in the table cell, it will still exceed the limit. Then the exported ppt document will report an error and need to be fixed or something, so I chose to paginate it manually;
Regarding the column width issue, the default is equal parts, colW. In actual development, it is best to calculate colW based on the width of the column. Remember to set colW. The table will be displayed strictly according to the set value and will not be adaptive, so it is still The program is required to calculate based on w;
  setTable(data, option = {}) {
    let row = [];
    let options = { fontFace: 'Microsoft YaHei', fontSize: 12, margin: 0.05, valign: 'middle', align: 'left' };
    options['border'] = [{ pt: 1, color: 'ffffff', type: 'dash' }, { type: 'none' }, { pt: 1, color: 'ffffff', type: 'dash' }, { type: 'none' }];
    let head = [];
    let colW = [];
    data.head.forEach(item => {
      head.push({ text: item.label, options: { ...options, fill: '1E4265', color: 'ffffff' } });
      if (item.width < 85) {
        colW.push(0.1);
      } else if (item.width < 101) {
        colW.push(0.2);
      } else if (item.width < 121) {
        colW.push(0.3);
      } else {
        colW.push(0.4);
      }
    });
    // autoPage: true, newSlideStartY: 1.1, autoPageRepeatHeader: true,暂时自动分页不太行
    let page = { ...this.page, rowH: 0.5, valign: 'middle' };
    // 表格超出,ppt分页展示,最多展示三页数据
    let tableData = data.table || [];
    tableData = tableData.slice(0, 30);
    tableData.forEach((item, index) => {
      let temp = [];
      let fill = index % 2 == 1 ? 'ffffff' : 'f2f2f2';
      data.head.forEach(h => {
        temp.push({ text: item[h.prop] === null ? '' : item[h.prop], options: { ...options, fill } });
      });
      row.push(temp);
    });
    let sumW = colW.reduce((per, cur) => per + cur, 0);
    let fNum = option.h < 6 ? 5 : 10;
    let fRow = row.slice(0, fNum);
    let fOption = { ...page, ...option };
    fOption['colW'] = colW.map(item => Number((fOption.w / sumW) * item).toFixed(1));
    this.slide.addTable([head, ...fRow], fOption);
    let eNum = parseInt(fNum + 10);
    let tRow = row.slice(fNum, eNum);
    if (tRow.length) {
      // 第二页
      let slide = this.ppt.addSlide({ masterName: 'DEFAULT_SLIDE' });
      page['colW'] = colW.map(item => Number((page.w / sumW) * item).toFixed(1));
      slide.addTable([head, ...tRow], { ...page });
      tRow = row.slice(eNum, parseInt(eNum + 10));
      if (tRow.length) {
        // 第三页
        let slide = this.ppt.addSlide({ masterName: 'DEFAULT_SLIDE' });
        slide.addTable([head, ...tRow], { ...page });
      }
    }
  }
5. Add Image
addImage() supports two formats: data, base64 data; path, image address; note that according to the size of img, the actual w and h are then converted;
  setChart(data, option = {}) {
    const { chartW, chartH, chartData } = data;
    let options = { ...this.page, ...option, sizing: { type: 'contain' } };
    let temp = (options.w / chartW) * chartH;
    if (temp > options.h) {
      temp = (options.h / chartH) * chartW;
      options.x = options.x + (options.w - temp) / 2;
      options.w = temp;
    } else {
      options.y = options.y + (options.h - temp) / 2;
      options.h = temp;
    }
    this.slide.addImage({ data: chartData, ...options });
  }
For complex HTML, you can use html2canvas to convert DOM into images and add PPT
  async setDom2Image(dom, option = {}) {
    let result = {};
    const res = await html2Canvas(dom, { scale: 2 });
    result['chartData'] = res.toDataURL('image/jpeg', 1);
    result['chartH'] = res.height;
    result['chartW'] = res.width;
    this.setChart(result, option);
  }
6. Add text
Add text. This introduction adds a piece of html into PPT text.
  setContent(content, option = {}) {
    let obj = [];
    content &&
      content.forEach(item => {
        let len = item.children.length;
        --len;
        item.children.forEach((cItem, index) => {
          obj.push({ text: cItem.text, options: { bold: cItem.bold ? true : false, color: cItem.color ? this.RGBToHex(cItem.color) : '333333', breakLine: index === len } });
        });
      });
    let options = { ...this.page, ...option, align: 'left' };
    if (options.h == 6) {
      options['fontSize'] = options.h == 6 ? 16 : 12;
    }
    this.setTitle(obj, { ...options });
  }
  setTitle(text, option = {}) {
    const options = {
      fontSize: 12, //字号
      fontFace: 'Microsoft YaHei',
      bold: false,
      color: '333333', //颜色 与背景颜色一样,一样不要 #,填满6位
      valign: 'middle', // 垂直居中 top middle bottom
    };
    this.slide.addText(text, { ...options, ...option });
  }
Since PPT only supports hexadecimal color values, RGB needs to be converted into 6-bit color values.
  RGBToHex(rgb) {
    let regexp = /\d+/g;
    let res = rgb.match(regexp);
    return ((res[0] << 16) | (res[1] << 8) | res[2]).toString(16);
  }
Convert html to slate's JSON
let document = new DOMParser().parseFromString(this.content, 'text/html');
result['json'] = this.deserialize(document.body);
deserialize(el, markAttributes = {}) {
if (el.nodeType === Node.TEXT_NODE) {
return jsx('text', markAttributes, el.textContent);
} else if (el.nodeType !== Node.ELEMENT_NODE) {
return null;
}
const nodeAttributes = { ...markAttributes };
// define attributes for text nodes
switch (el.nodeName) {
case 'STRONG':
nodeAttributes.bold = true;
}
// font color
if (el.style.color) {
nodeAttributes.color = el.style.color;
}
const children = Array.from(el.childNodes)
.map(node => this.deserialize(node, nodeAttributes))
.flat();
if (children.length === 0) {
children.push(jsx('text', nodeAttributes, ''));
}
switch (el.nodeName) {
case 'BR':
return '\n';
case 'P':
return jsx('element', { type: 'paragraph' }, children);
default:
return children;
}
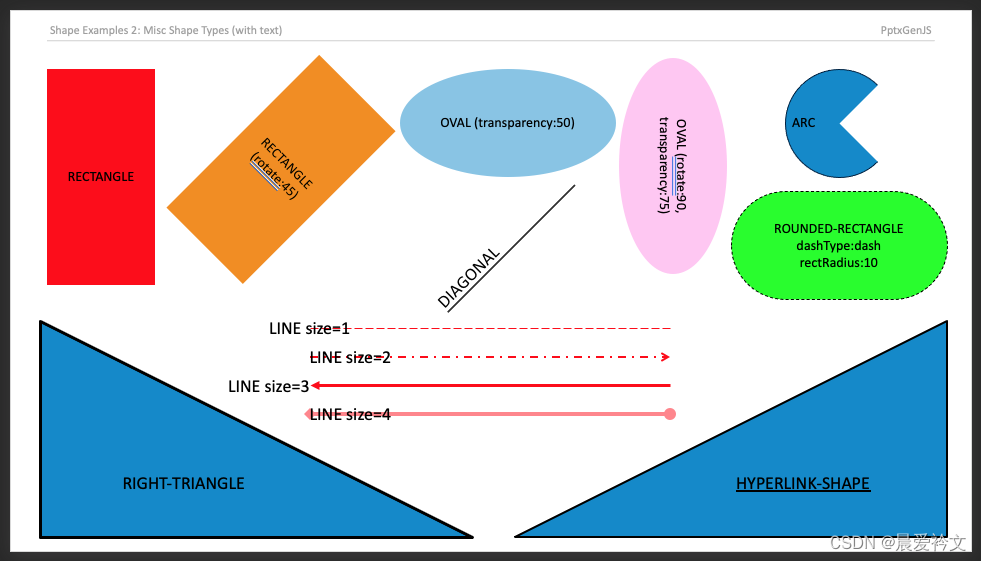
},7. Draw graphics Shapes
Shapes, drawing graphics, the document has a detailed introduction, I will not go into details here.
 8. Summary
It is quite time-consuming to implement the entire function. The main documents are all in English. Some field descriptions are not very clear, and some need to be debugged slowly. Some of the functions introduced above are all used in actual development; overall, it is relatively Perfectly implement customized export of PPT. Welcome everyone to communicate together! ! !