TISE (Text-to-Image Synthesis Evaluation) is a Python evaluation toolbox for evaluating text-to-image synthesis. The article was published by Tan M. Dinh, Rang Nguyen, and Binh-Son Hua et al.
It promotes, advocates for fair assessment metrics in a unified manner, and provides reproducible results for future text-to-image synthesis research.
Article link: https://arxiv.org/abs/2112.01398
Project link: https://github.com/VinAIResearch/tise-toolbox
1. Abstract of the original text
In this paper, we study state-of-the-art text-to-image synthesis methods and propose a framework for evaluating these methods. We consider images containing single or composite objects. Our research outlines several issues in current assessment processes:
- (i) For image quality assessment, a commonly used metric, such as onset score (IS), is often miscalibrated in the single-object case, or misused in the multi-object case;
- (ii) For text relevance and object accuracy evaluation, there is overfitting phenomenon in the existing R-precision (RP) and semantic object accuracy (SOA) measures respectively;
- (iii) For the multi-target case, many important evaluation factors, such as target fidelity, position alignment, and counting alignment, are largely ignored;
- (iv) The rankings of methods based on current metrics are highly inconsistent with real images. To overcome these problems, we propose a set of existing and new indicators to systematically
2. Why is TISE proposed?
Although text-generated images currently achieve excellent results on specific datasets, current evaluation methods are not ideal.
For the single-object case, image quality and text-image alignment are the main factors considered during a typical evaluation process. Some commonly used evaluation metrics are Inception Score (IS) and Fr´echet Inception Distance (FID) for image fidelity and R-precision for text-image alignment , which work well in most single-object cases .
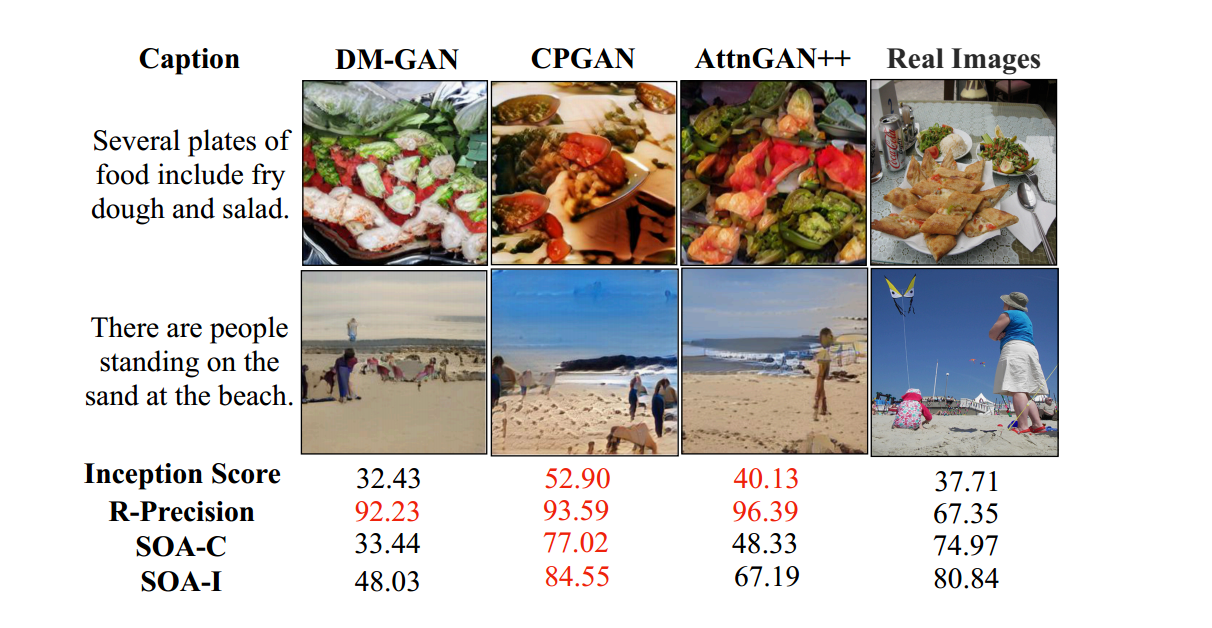
However, in complex scenes with multiple objects , these metrics are not entirely valid and can lead to some inconsistency issues. As shown in the figure below, the ranking of a GAN model based on the current metric is not strongly correlated with the quality of the images it generates. For some pictures that look unrealistic, the quantitative results are even higher than those of real photos.
Based on this problem, the authors developed a systematic method to evaluate text-to-image synthesis methods. The main contributions are as follows:
- IS* (an improved version of the IS metric) was created, which alleviates the phenomenon of low confidence due to miscalibration in pre-trained classifiers for IS. Robust versions of textual relevance and object accuracy assessment (RP and SOA) are also developed to mitigate overfitting issues in the multi-object case.
- The authors developed O-IS and O-FID for object fidelity, PA for positional alignment and CA for count alignment to evaluate aspects lacking in multi-object text-to-image synthesis.
- AttnGAN+ was proposed.
3. What is TISE?
3.1. Existing commonly used indicators
1️⃣, Inception Score (IS)
The IS score uses the mathematical knowledge of KL divergence and entropy. Its main principle is to calculate the divergence between p(y|x) and p(y):
I S = exp ( E x K L ( p ( y ∣ x ) ∥ p ( y ) ) \mathrm{IS}=\exp \left(\mathbb{E}_{x} \mathrm{KL}(p(y \mid x) \| p(y))\right. IS=exp(ExKL(p(y∣x)∥p(y))
in:
- p ( y ∣ x ) p(y|x) p ( y ∣ x ) : where x represents a generated sample, y is the predicted label. Simply put: x represents the picture generated by the model, y represents the main object contained in this picture, and theconditional probability p ( y ∣ x ) p (y|x)p ( y | _ _ __ So to a certain extent,p ( y ∣ x ) p(y|x)p ( y | x ) represents the quality of the image,the probability,the better.
- p ( y ) p(y)p ( y ) : y is the predicted label, and p(y) represents the marginal distribution. In other words, it is thedistribution of labels. We want the labels to be distributed evenly, but we do not want the model to generate a certain type of pictures. At this time, what we consider is not the conditional probability, but the marginal probability p(y). To give an inappropriate example, the probability of the image generated by the first model is as follows: p (magpie) = 0.98, p (sparrow) = 0.01, p (pigeon) = 0.01, and the probability of the image generated by the second model. It is p (magpie) = 0.33, p (sparrow) = 0.34, p (dove) = 0.33. Then we definitely think the diversity generated by the second model is a little better. Therefore p ( y ) p(y)p ( y ) can represent the diversity of model generation. We hope that p(y) is evenly distributed, preferably p(y1=p(y2)=...=1/n,
- The concept of entropy: refers to information entropy, which is personally understood as the degree of confusion. When the probability is small, the uncertainty is large and the entropy value will be larger. We want p ( y ∣ x ) p(y|x)The higher the probability of p ( y | We want eachp ( y ) p(y)The smaller the probability of p ( y ) , the better. In terms of entropy, the larger the entropy value, the better . The larger the entropy, the greater the uncertainty (more chaotic), and more categories can be generated.
- KL divergence: Through 3 , we hope that the smaller the entropy of p(y|x), the better, and the larger the entropy of p(y), the better . Therefore, KL divergence is introduced at this time . KL divergence is also called relative entropy, which represents the difference between the two. The discrete state is simply the difference in information entropy between two probabilities: p ( y ) p(y)The entropy of p ( y ) minusp ( y ∣ x ) p(y|x)The entropy of p ( y ∣ x ) .
To sum up, the larger the IS score, the better . The larger the divergence is, the greater the difference in entropy between the two.
2️⃣, Fr´echet Inception Distance (FID)
The FID score is used to measure the distance between the real image distribution and the generated image distribution based on the features extracted by the pre-trained network.
F I D = ∥ μ r − μ g ∥ 2 2 + Tr ( Σ r + Σ g − 2 ( Σ r Σ g ) 1 / 2 ) \mathrm{FID}=\left\|\boldsymbol{\mu}_{r}-\boldsymbol{\mu}_{g}\right\|_{2}^{2}+\operatorname{Tr}\left(\boldsymbol{\Sigma}_{\boldsymbol{r}}+\boldsymbol{\Sigma}_{g}-2\left(\boldsymbol{\Sigma}_{\boldsymbol{r}} \boldsymbol{\Sigma}_{g}\right)^{1 / 2}\right) FID= mr−mg 22+Tr( Sr+Sg−2( SrSg)1/2)
in:
- Physical meaning : Real images obey a distribution in space (assumed to be a normal distribution), and the features generated by GAN are also a distribution. What GAN does is to continuously train to make the two distributions as identical as possible. FID is to calculate the direct distance between these two distributions , and the distance algorithm used is called Frechet distance. (Better still is Wasserstein-2 distance)
- Assuming you have basic statistical knowledge, you can easily understand that two normal distributions are the same as long as they have the same mean and variance. The image here is a multi-dimensional distribution , so the covariance matrix is used to measure the correlation between two dimensions in a single distribution. FID uses the mean and covariance matrix to calculate the distance between the two distributions .
- The above formula consists of two parts, r represents the real image, and g represents the generated image. In the first part, μ represents the mean of the distribution, and the first part is the square of the difference between the two means μ.
- In the second part, Σ represents the covariance, Tr represents the trace (the sum of the elements on the diagonal of the matrix), and the second part is the trace of the sum of the covariance matrices minus the product of the covariance matrix under the root sign.
FID calculates the distance between two distributions. The smaller the distance, the closer the generated distribution is to the real distribution, so the smaller the FID, the better.
3️⃣、R-precision
R-precision measures the visual semantic similarity between text descriptions and generated images by ranking the retrieval results between extracted image and text features . In addition to generating real text descriptions of images, additional text is randomly drawn from the dataset. Then, the cosine similarity between the image features and the text embedding of each text description is calculated, and the text descriptions are sorted in order of decreasing similarity . It is relevant if the real text description of the generated image is ranked within the top r.
R-precision represents the probability that the real text appears in the first r items after sorting. The larger it is, the more relevant the image is to the real text description. The larger the R-precision, the better .
3.2. Improved Inception score (IS*): Calibrate image classifier
The pretrained classifier of the Inception network used to calculate IS is uncalibrated or miscalibrated . Therefore, classifiers tend to be overfitted or underfitted.
Whether the IS is calibrated can be verified by using expected calibration error (ECE) and reliability plots. ECE is a common metric used to evaluate calibration, while reliability plots are tools for visualizing calibration quality. If the classifier has a small ECE value and the reliability plot is close to identity, the classifier is well calibrated.
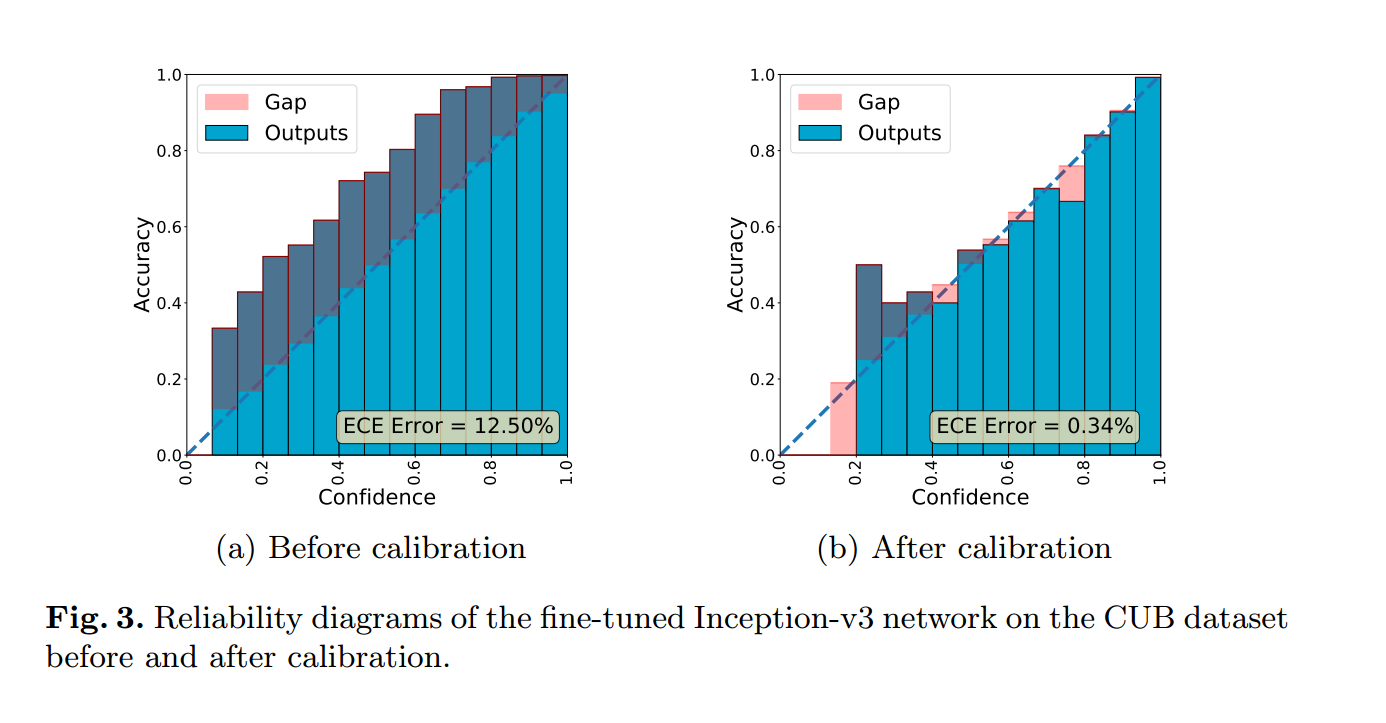
To this end, the author proposes Improved Inception Score (IS*), which is an improved Inception score used to evaluate the quality of generated images. It solves these problems by calibrating the confidence of the classifier. Specifically, the authors used expected calibration error (ECE) and reliability plots to verify the calibration quality of the classifier. A classifier is well calibrated if its ECE value is small and the reliability plot is close to the identity matrix.
In this way, IS* takes into account not only image quality and text-image alignment (which are considered by traditional Inception scores), but also the confidence level of the classifier, thus providing a more accurate and comprehensive assessment.
3.3. Object-centric IS (O-IS), Object-centric FID (O-FID): Object-centric IS score and FID score
Object-centric IS (O-IS) is a metric that evaluates the fidelity of objects in generated images and is an extension of Inception Score (IS). In the document, the authors mention that some existing evaluation methods cannot be directly applied to text-to-image tasks because they require object bounding boxes of real images to extract objects, which does not exist in text-to-image tasks. To solve this problem, O-IS utilizes a pre-trained object detection model to predict the bounding boxes of all objects in the generated image, and then performs IS scoring for each region separately. In this way, object fidelity in generated images can be evaluated even in the absence of ground-truth object bounding boxes.
Similar to Object-centric IS (O-IS), SceneFID needs to extract the bounding box of the target object from the layout. Therefore, O-FID uses a pre-trained object detection model to predict the object bounding box in all images in the generated image set, Object fidelity was then assessed using IS* scores and FID scores for each area.
Later, the authors also proposed PA for positional alignment and CA for count alignment to evaluate aspects lacking in multi-object text-to-image synthesis.
3.4、AttnGAN++
The author created a simple but powerful baseline model called AttnGAN++, which mainly improves the original AttnGAN model in the following two aspects:
- Add a spectral normalization layer to the discriminator . Spectral normalization is a technique used to stabilize neural network training, which can suppress the gradient explosion problem and improve the stability and convergence speed of model training. By adding a spectral normalization layer to the multi-layer neural network of the discriminator, the authors significantly improved the training stability of AttnGAN.
- Manually tune network hyperparameters . In addition to introducing spectral normalization, the author also carefully adjusted and optimized the network structure of AttnGAN. These modified hyperparameters enable AttnGAN++ to achieve better performance than the original AttnGAN on the CUB dataset.
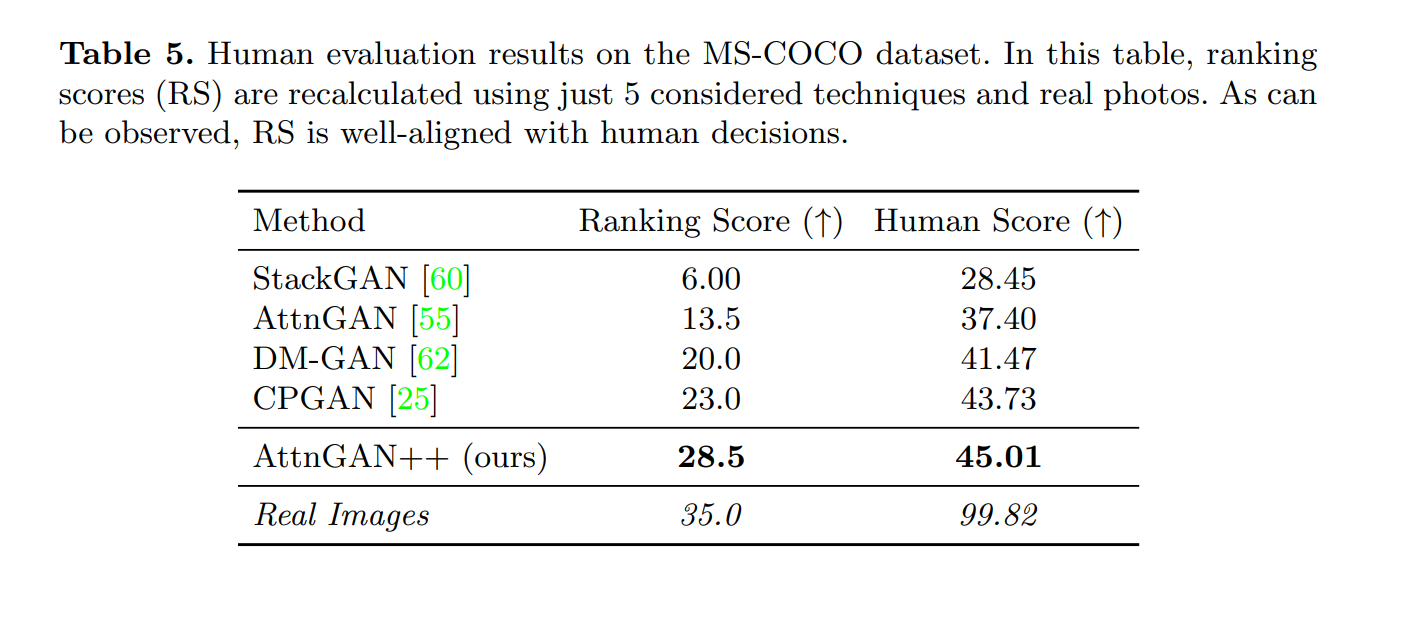
Through these two improvements, AttnGAN++ significantly surpasses the original AttnGAN model and some existing state-of-the-art methods on multiple evaluation metrics.
In addition, there are many other contents in the article, so I won’t go into details here.
5. Summary
This study explores the evaluation problem of text-to-image synthesis (T2I), with a special focus on multi-object scenes. The author pointed out that there are several problems in the current evaluation process, such as the misuse of Inception Score (IS) in the single-object case, the over-fitting phenomenon of R-precision (RP) and Semantic Object Accuracy (SOA) in the multi-object case, and the ignored Key evaluation factors include object fidelity, positional alignment, and count alignment.
To address these issues, the authors propose a comprehensive set of existing and new metrics to systematically evaluate these methods. For existing indicators, the authors improved IS and proposed methods to solve the overfitting problem of RP and SOA. For new indicators, the authors developed Object-centric IS (O-IS) and Object-centric FID (O-FID) for evaluating multi-object situations. Experiments demonstrate that benchmarking using this metric set results in model rankings that are highly consistent with human evaluations. In addition, the authors also created a baseline model named AttnGAN++ and stabilized the training of AttnGAN through spectral normalization. Finally, the authors release a toolbox called TISE to advocate for fair and consistent text-to-image model evaluation. The article is relatively long, with a total of 34 pages, and it is difficult to read. However, it is worth mentioning that the experiments are rich, and the appendix is worth reading.