WebPlotDigitizer, an online tool for quickly extracting curve coordinate data from graphs
1 Introduction
When writing a paper, you need to compare the data of other people’s curve graphs, point graphs, and column graphs, but what should you do if you only have graphs and no original data?
If we can extract the original xy coordinate data directly from the paper figure, we can compare it even if others do not provide the data.
Here is a very practical tool: WebPlotDigitizer.
It is recommended to use the online version, which is very fast and convenient. The following operation demonstration is also based on the online version.
Desktop version address: https://automeris.io/WebPlotDigitizer/download.html
Online version address: https://apps.automeris.io/wpd/
2 Use of WebPlotDigitizer online version
2.1 Upload images
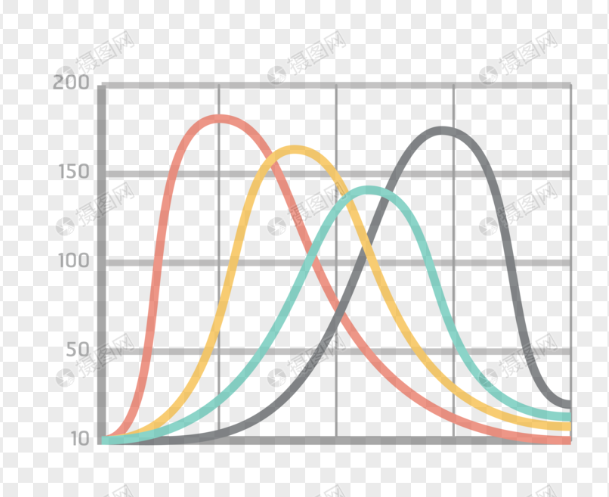
Use this image to test:
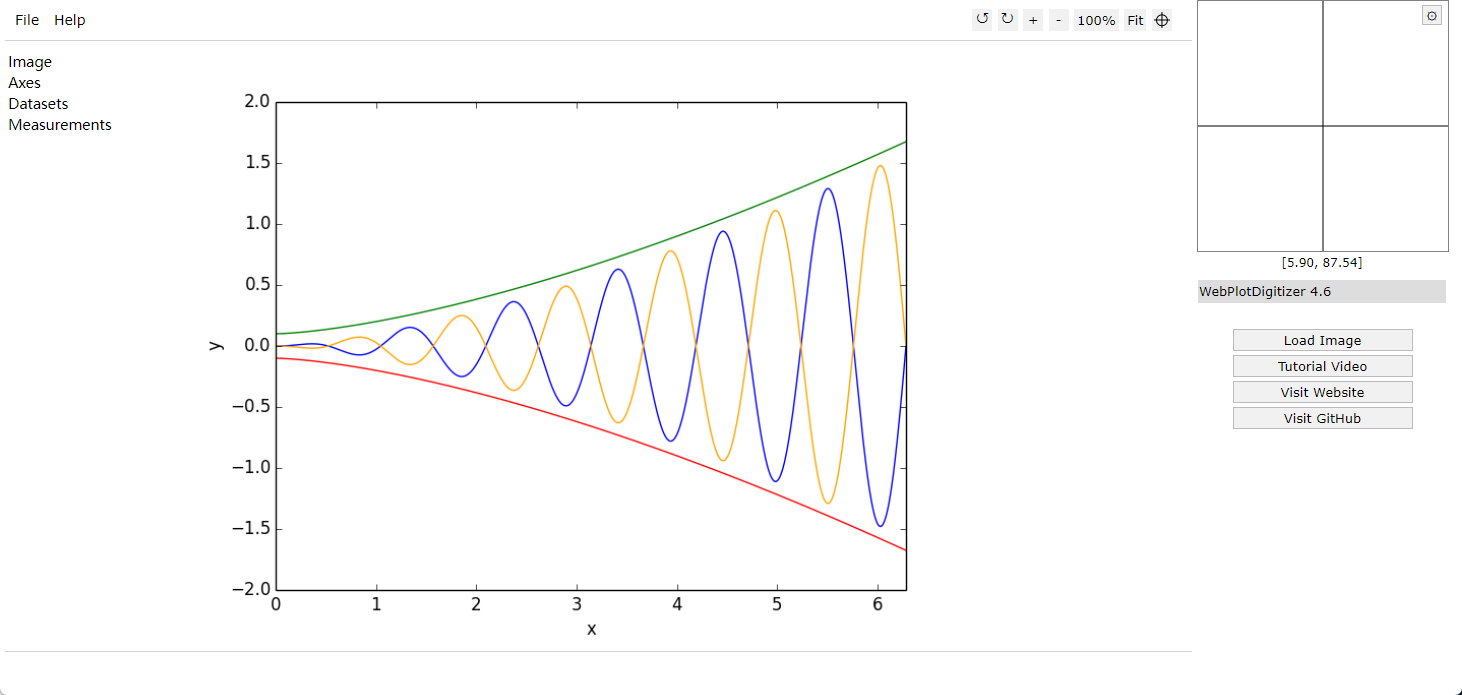
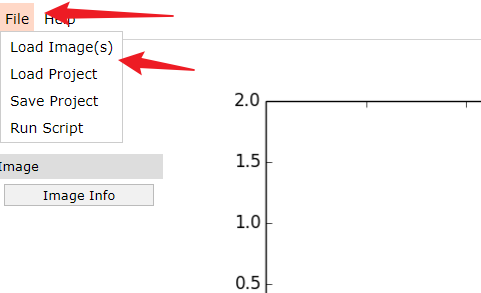
Enter the online version interface. First click File–load Image. to upload the image.
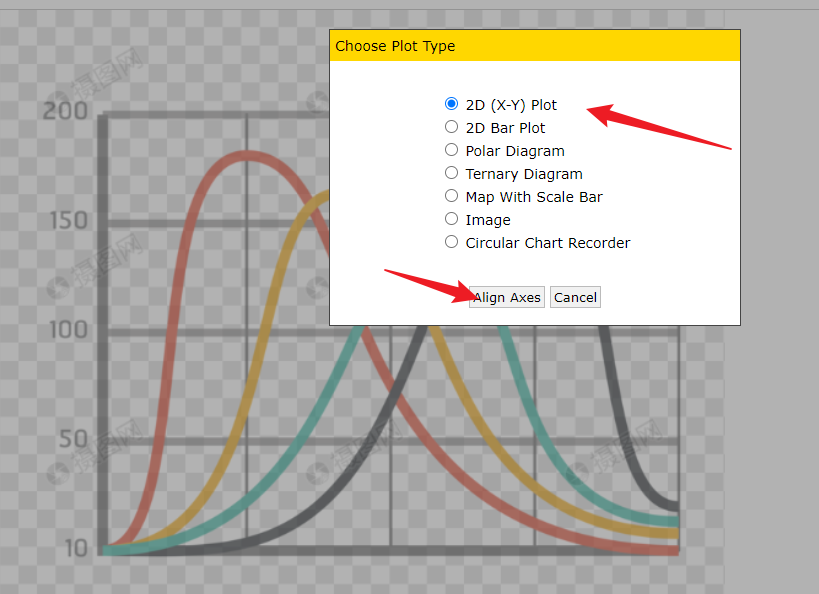
Click on 2D(xy)plot
2.2 Click on the horizontal and vertical coordinate points:
What it means here is to click on the horizontal and vertical coordinates in the order of 1234. Then click proceed.
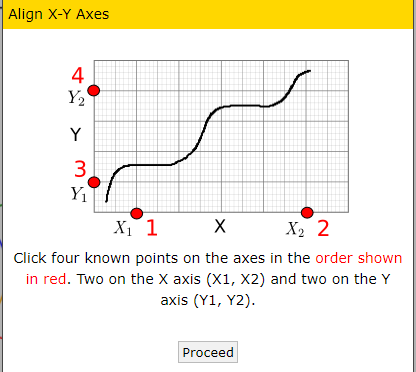
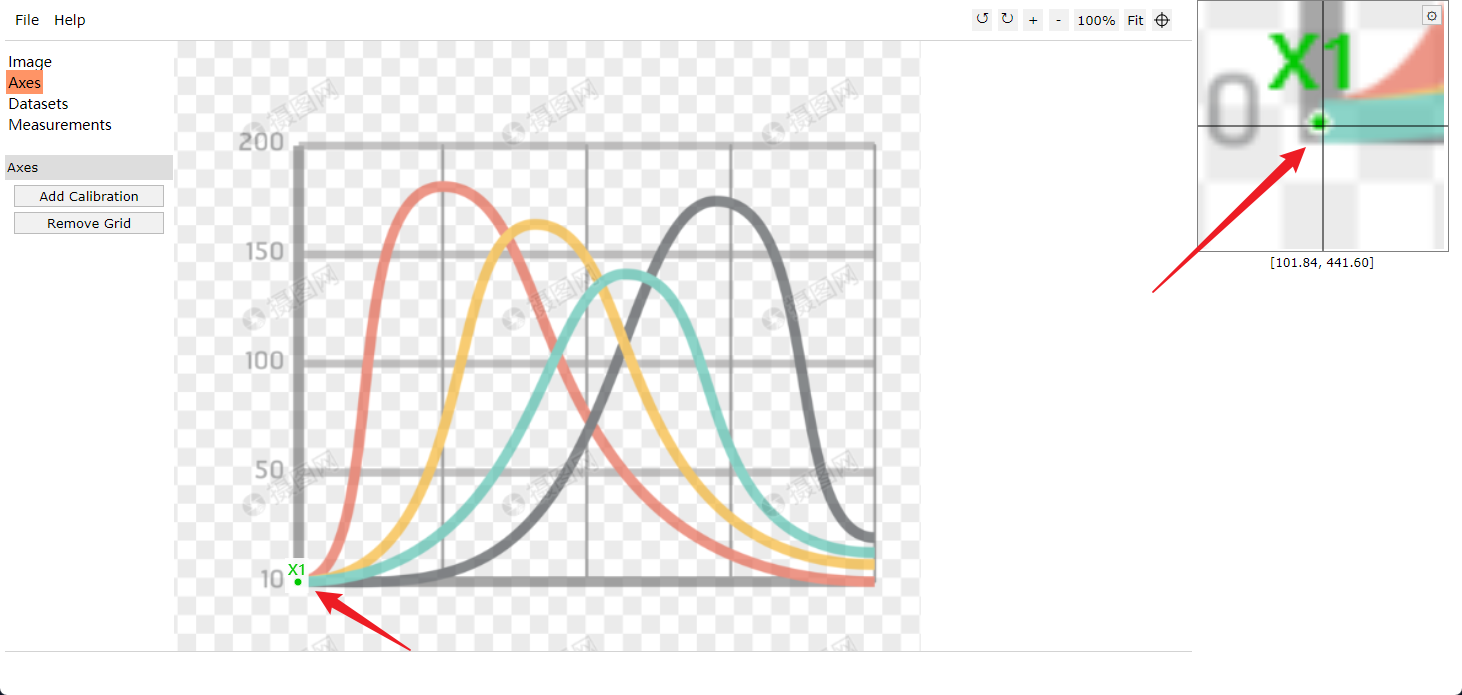
Then click on the four points x1, x2, y1, and y2.
Click Finish:
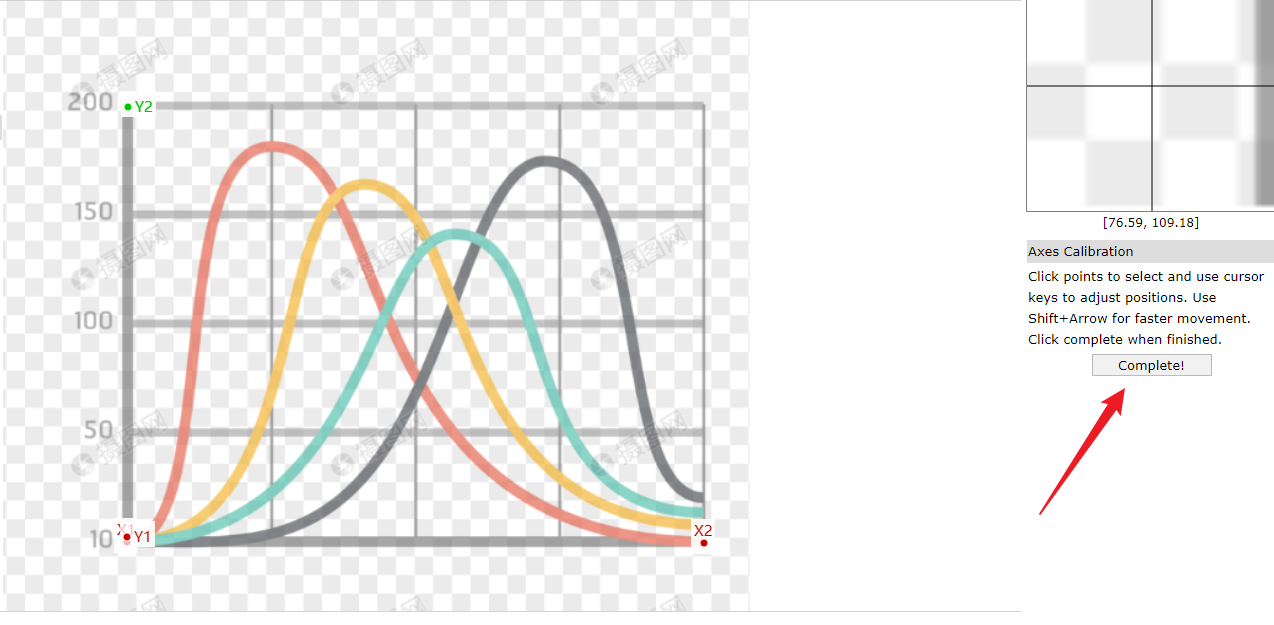
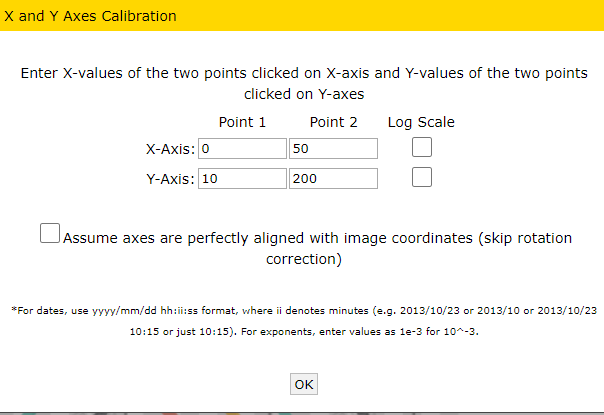
Then enter the horizontal and vertical coordinate intervals:
2.3 Select curve
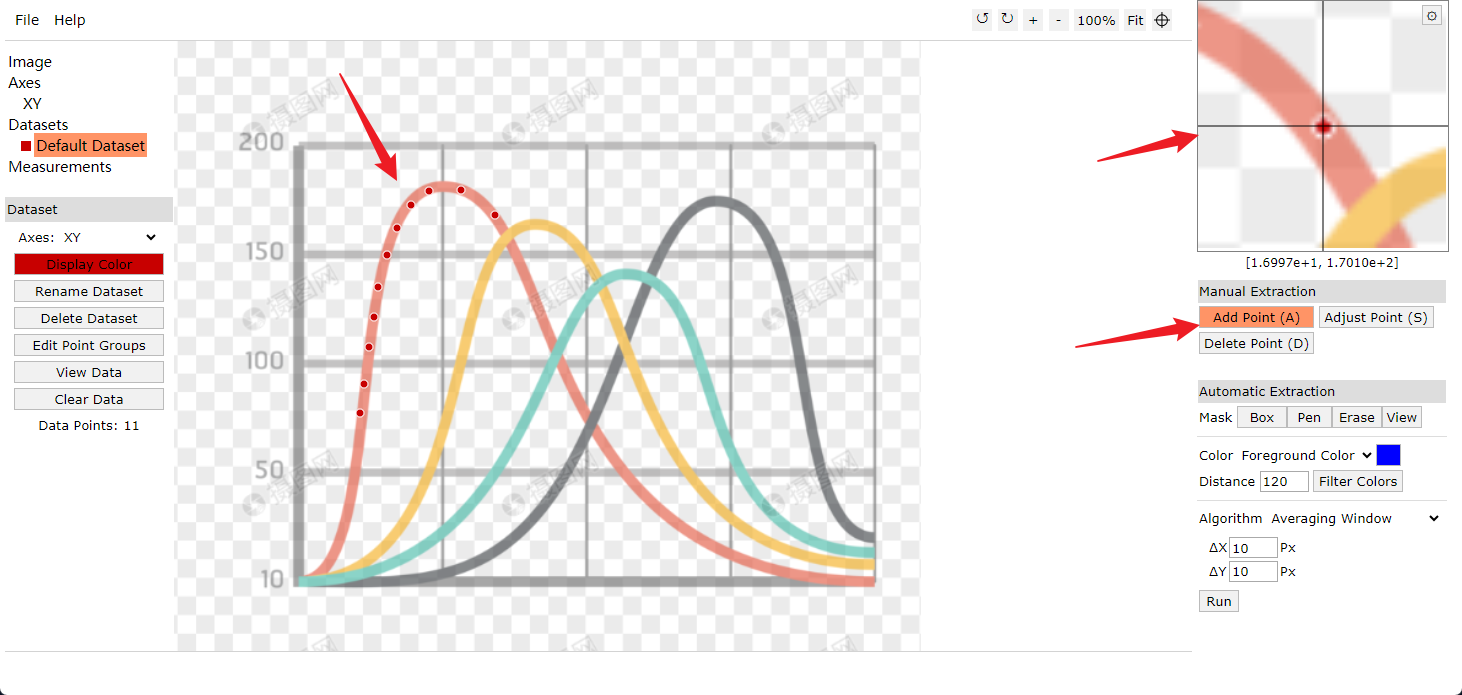
1. There are many ways to select a curve, such as directly dotting:
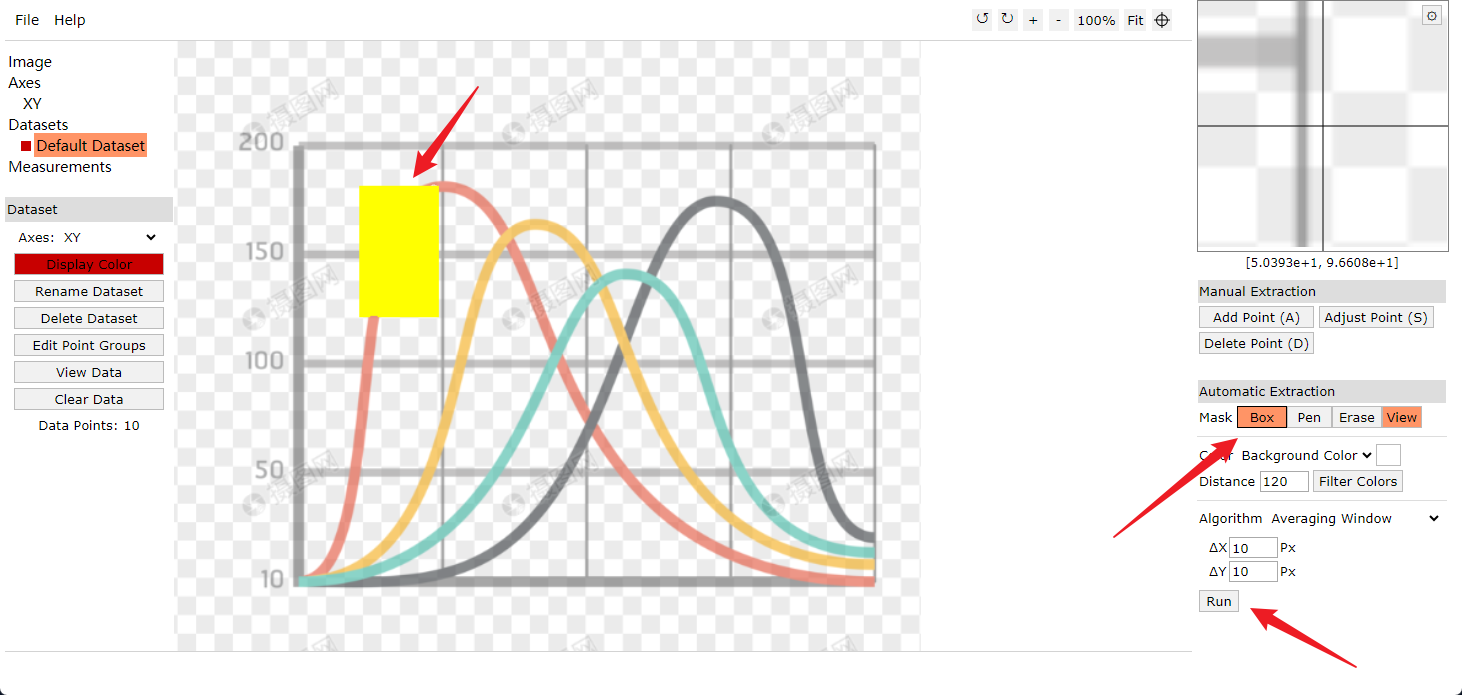
2. Use box to directly enclose a certain piece, and then click run to see the points of that piece.
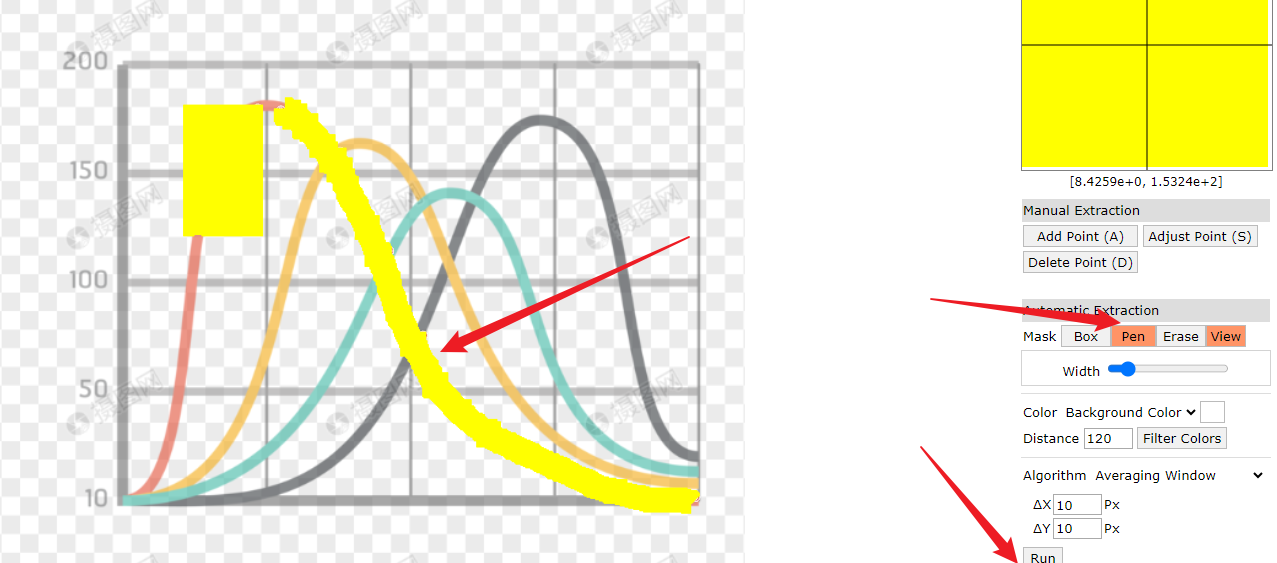
3. Use pen and brush to directly trace the red lines. Then click run.
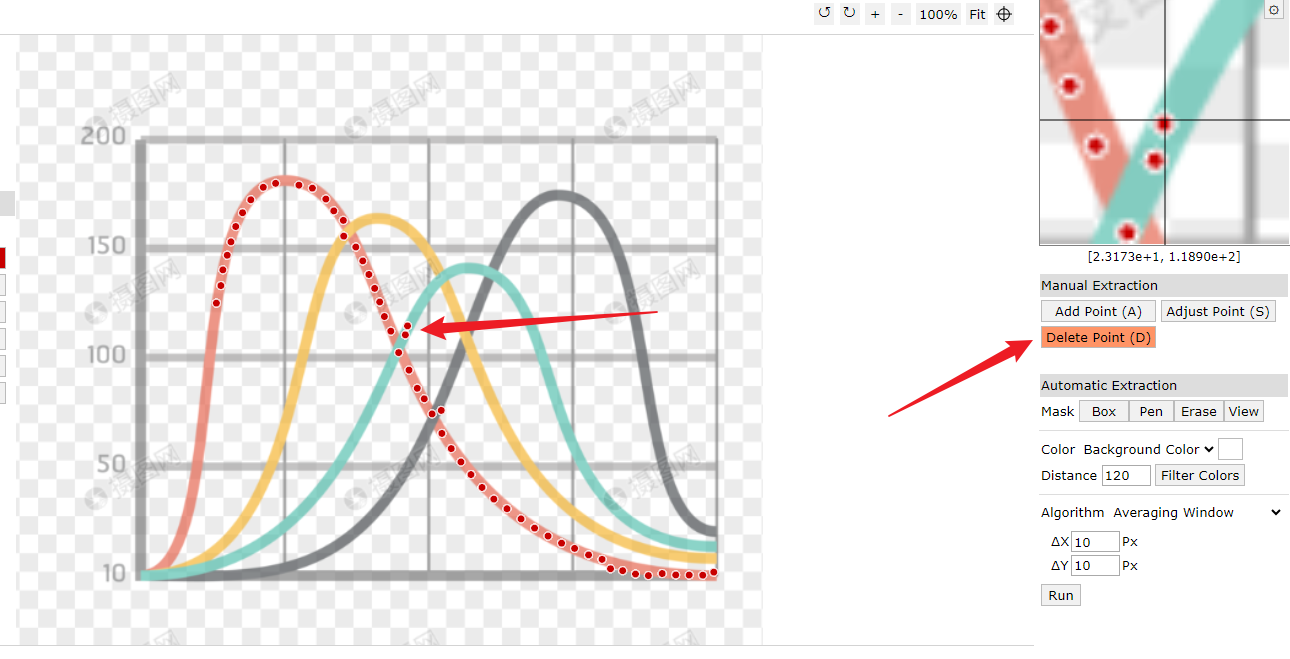
4. Delete points. When we find some points, an error occurs. If it is not the point we want, we can directly delete it manually.
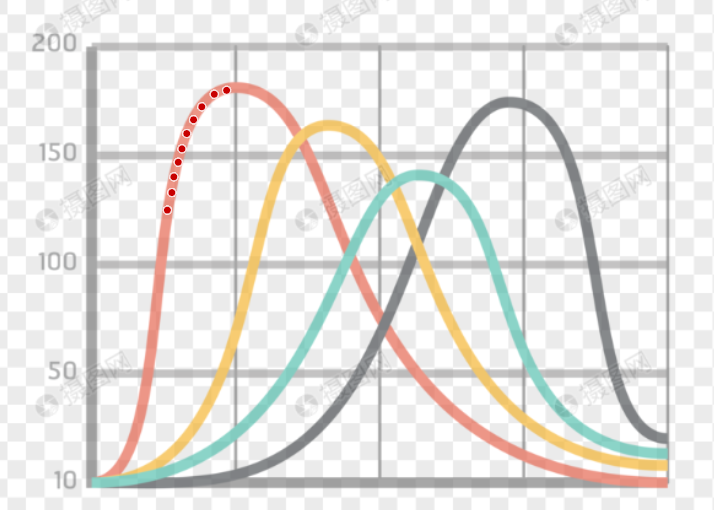
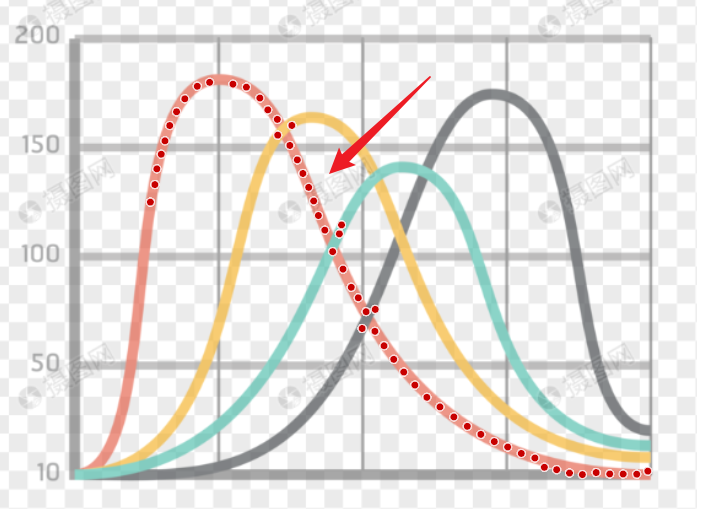
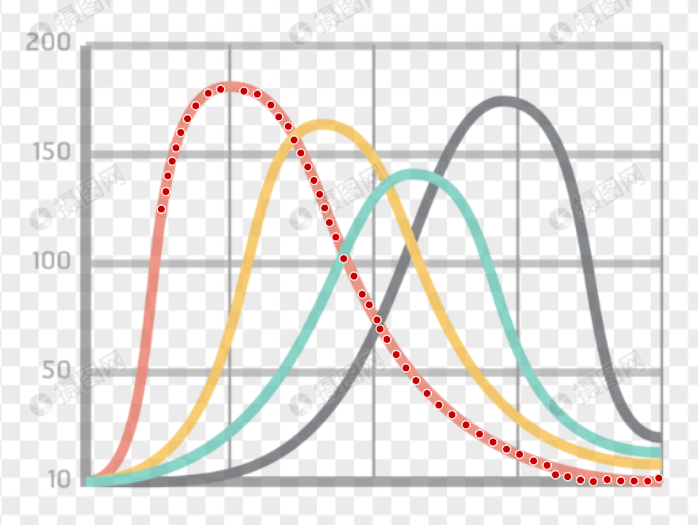
The result is as shown below:
3 View data
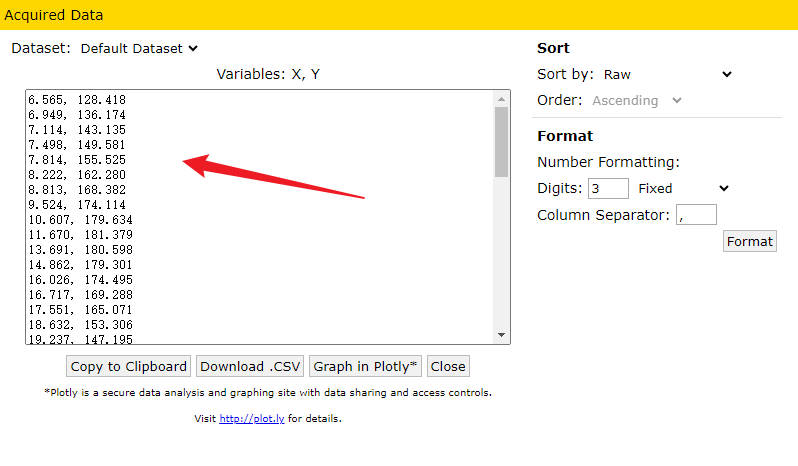
Click view data to view the data:
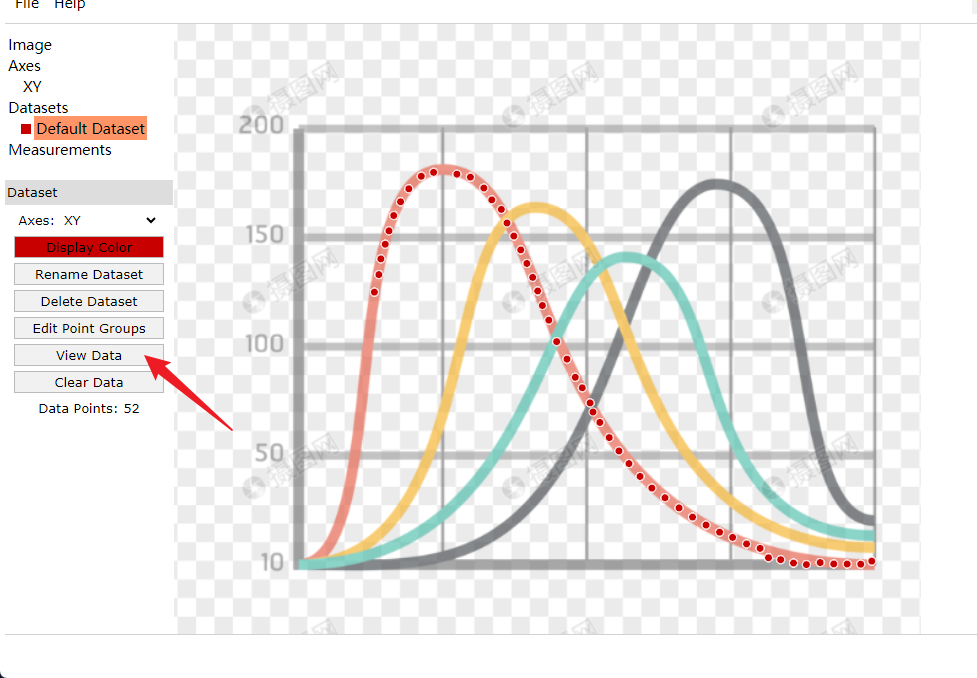
you can copy the following data directly, or download the data into csv format.
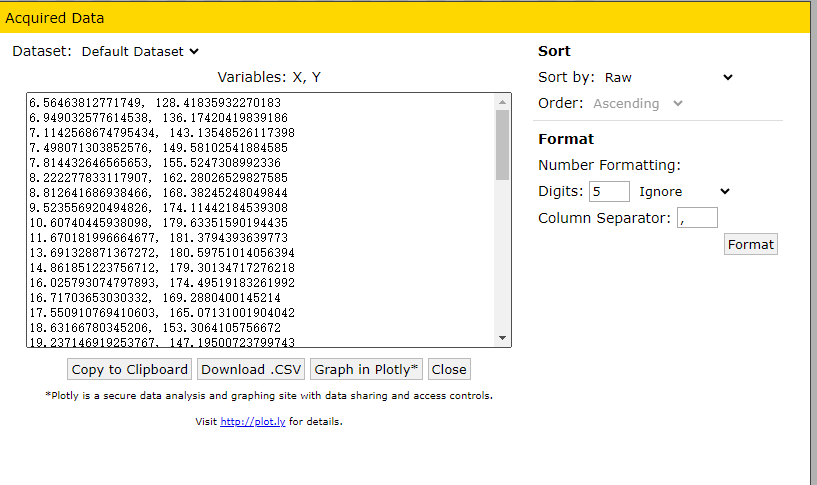
Modify the precision of the data: enter 3, click fixed. Then click format:

You can see the corrections made to the data.