What is virtual input and output debugging?
The FPGA virtual input and output debugging tool is a customizable IP core that can be used to monitor and drive internal FPGA signals in real time.
Playing an important role in the FPGA design and debugging process, it can help designers quickly verify the correctness and performance of the design, and speed up the design iteration and optimization process. At the same time, it can also reduce the occupation of hardware resources and the consumption of development time, and improve the efficiency of the entire system development.
The number and width of input and output ports can be customized to interface with FPGA designs. Because the IP core is synchronized with the design being monitored and driven, the clock constraints that apply to the design also apply to the elements within the IP core.
Solutions for different FPGAs
Xilinx is called Virtual Input Output (VIO) core.
A similar tool in altera is In-System Sources and Probes Editor (ISSP)
This article mainly introduces the use of In-System Sources and Probes Editor (ISSP).
Steps for usage
This description is based on quartus21 version.
1 Create an FPGA project and import the V file.
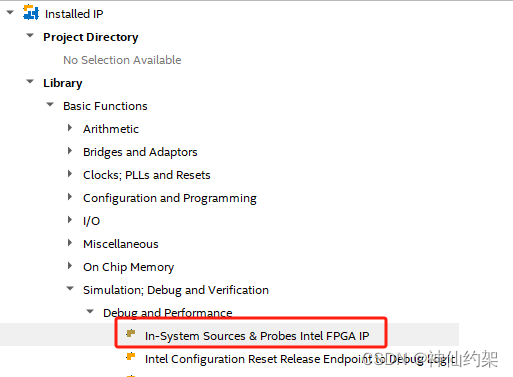
2 Double-click to select In-System Sources and Probes Intel FPGA IP in tools->IP Catalog->Library
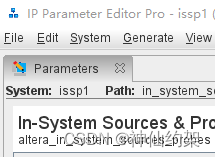
3 Enter New IP Variant, create a new ISSP IP, and name it issp1 (you can name it according to your needs)
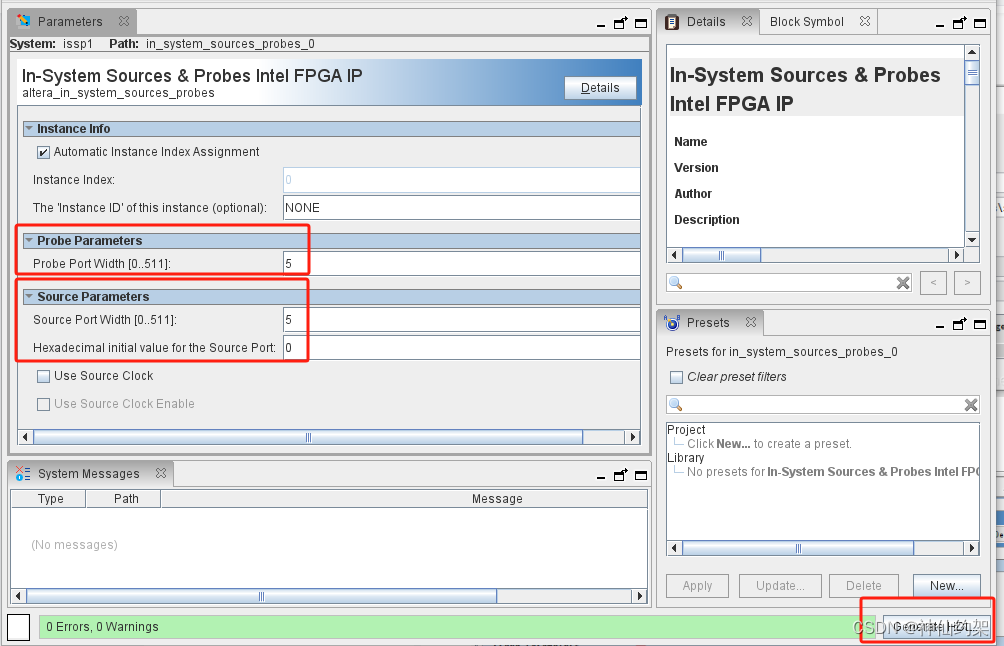
4 Modify the parameter values of probe and source. You can set the maximum width to 512bit. In this example, the setting values are both 5. Click Generate HDL
5 Click Generate -> show Instantiation Template to generate Example HDL, click Copy

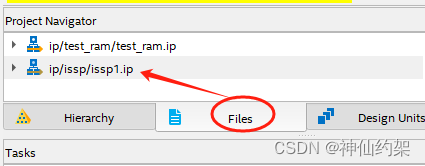
6 Afterwards, you can see the newly created issp1.ip on the Project Navigate Files page.
7 Paste the copied example into the project V file
source is a register that requires external input control
probe is the register that needs to capture the output

8 Compile the FPGA project and generate the download file.
9. Select Tools -> In-System Sources and Probes Editor from the menu to open the In-System Sources and Probes Editor tool.
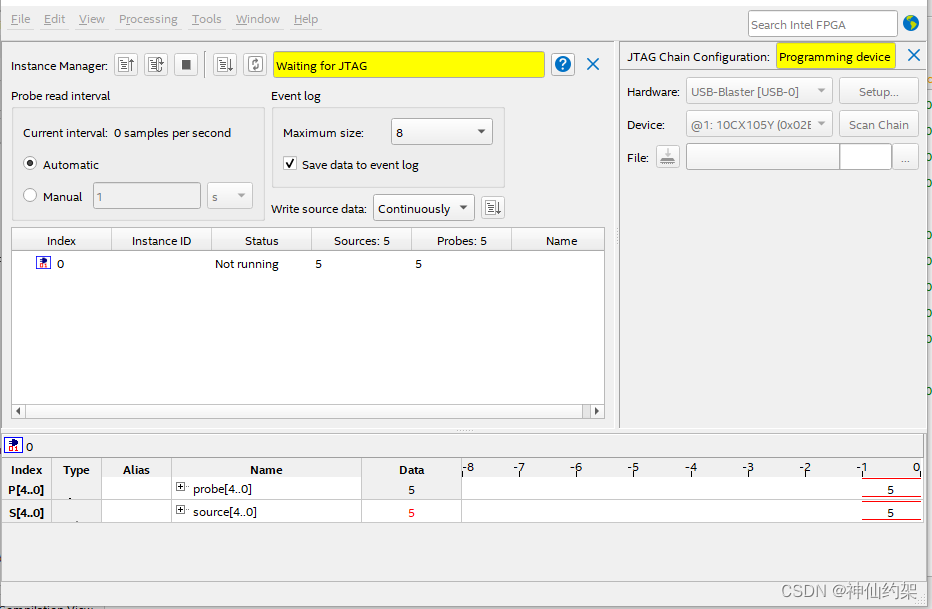
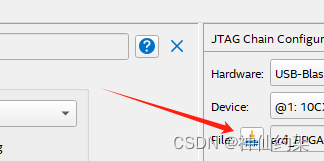
10 Select the corresponding Hardware and Device for JTAG on the right, select the generated sof file, and click the download button
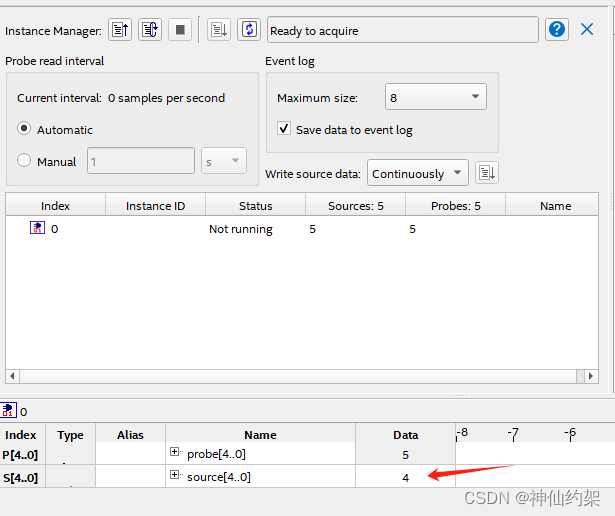
11 After the download is completed, the generated In-System Sources and Probes Editor signal will be automatically loaded.
Click the Data of source, type in the register value you want to write, here it is set to 4, and click Enter on the keyboard to confirm the input.
12 Notice that the data of the probe is still 5 which was read last time. Click the instance manager -> read probe data button and you can see that the data data has changed to 4.
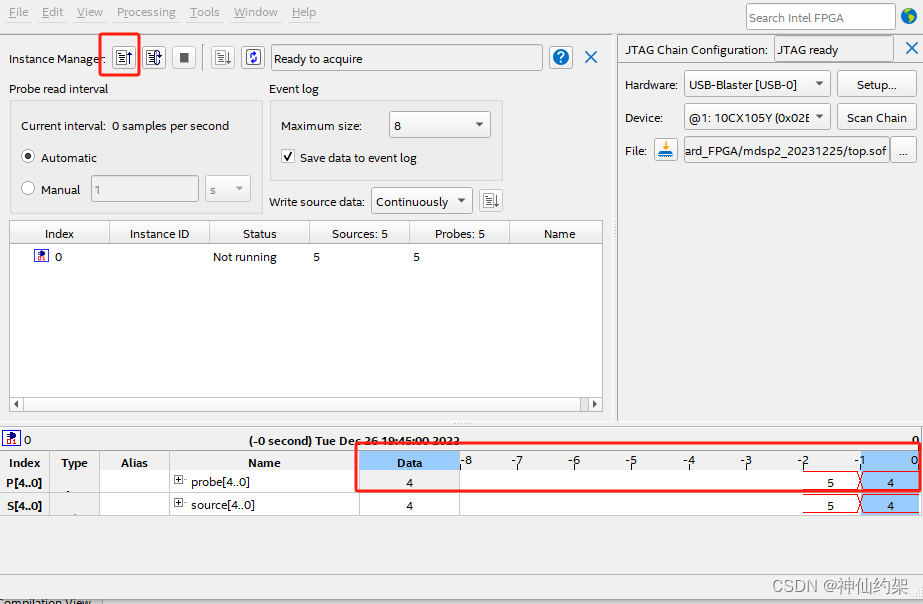
At this point, the introduction to the use of ISSP is completed. Friends in need are welcome to collect and forward it.