1.0 Univariate Linear Regression
Predicting profits based on population. The input variable has only one feature, population, and the output variable is profit.
loss function
gradient descent function
Dimensions
X(m,n)y(m,1) theta(n,1)
Import data and visualize it
import numpy as np
import pandas as pd
import matplotlib.pyplot as plt
data = pd.read_csv('ex1data1.txt',names =[ 'Population','profit'])
data.head()
data.insert(0,'ones',1)
data.head()
data.plot.scatter('Population','profit')
plt.show() 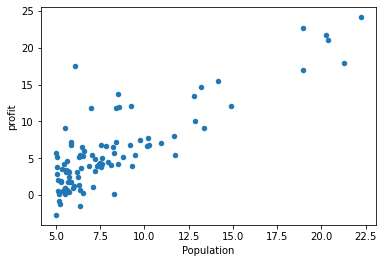
Data slicing processing
X = data.iloc[:,0:-1]
X.head()
X = X.values
X.shape
y = data.iloc[:,-1]
y.head()
y = y.values
y.shape
y = y.reshape(97,1)
y.shape
Normal equation to find theta
#正规方程
def normalEquation(X,y):
    theta = np.linalg.inv(X.T@X)@X.T@y
    return theta
theta = normalEquation(X,y)
print(theta)
theta.shape
cost function
def cost_func(X,y,theta):
    inner = np.power(X@theta-y,2)
    return np.sum(inner)/(2*len(X))
theta = np.zeros((2,1))
theta.shape
cost1 = cost_func(X,y,theta)
print(cost1)gradient descent
def gradient_Abscent (X,y,theta,alpha,count):
    costs = []
    for i in range(count):
        theta = theta - (X.T @(X @ theta - y)) * alpha / len(X)
        cost = cost_func(X,y,theta)
        costs.append(cost)
        if i%100 == 0:
            print(cost)
    return theta,costs

alpha = 0.02
count = 2000
theta1,costs =gradient_Abscent(X,y,theta,alpha,count)
Cost function visualization
fig,ax = plt.subplots()
ax.plot(np.arange(count),costs)
ax.set(xlabel = 'count',ylabel = 'cost')
plt.show() 
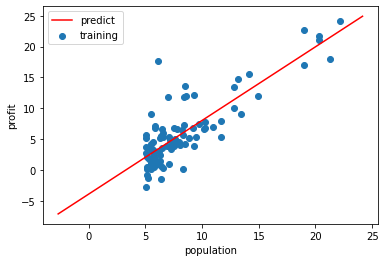
Fitting function visualization
#拟合函数可视化
x = np.linspace(y.min(),y.max(),100)#网格数据
y_ = theta1[0,0] + theta1[1,0]*x  # 取theta第一行第一个和第二行第一个

fig,ax = plt.subplots()
ax.scatter(X[:,1],y,label = 'training')#绘制数据集散点图取x所有行,第2列population
ax.plot(x,y_,'r',label = 'predict')#绘制预测后的直线
ax.legend()
ax.set(xlabel = 'population',ylabel = 'profit')
plt.show()
predict
x_predict = float(input('输入预测人口:'))
predict1 = np.array([1,x_predict])@theta1
print(predict1)
2.0 Multivariable Linear Regression
To predict house prices, the input variables have two characteristics, the area of the house and the number of bedrooms in the house. Output variable, price of house
Read data
import numpy as np
import pandas as pd
import matplotlib.pyplot as plt
#读取数据
data =  pd.read_csv('ex1data2.txt',names = ['size','bedrooms','price'])#文件路径,我的数据集在同文件夹
data.head()#查看前五行
Mean normalization
#均值归一化
def normalize_feature(data):#定义均值归一化函数
return (data - data.mean())/data.std()#(x-x的均值)/x的方差
data = normalize_feature(data)#调用均值归一化函数
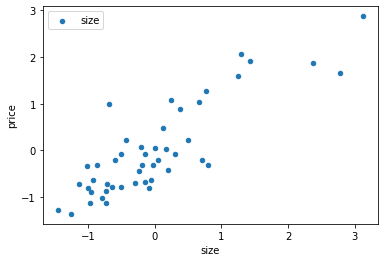
data.head()#查看均值归一后数据集前五行data visualization
#数据集可视化
data.plot.scatter('size','price',label = 'size')#画出房间大小与价格数据集散点图
plt.show()
data.plot.scatter('bedrooms','price',label = 'size')#画出卧室数量大小与价格数据集散点图
plt.show()

data.insert(0,'ones',1)#在数据集中插入第一列,列名为ones,数值为1
data.head()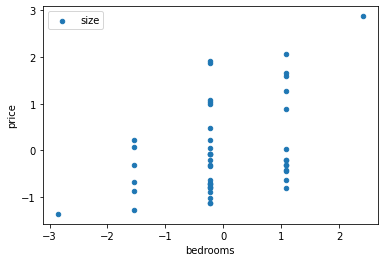
Data processing
#数据切片
x = data.iloc[:,0:-1]#取x的所有行,取x第一列之后的所有列
x.head()
x = x.values #将x由dataframe(数据框)格式转化为ndarray(多维数组)格式
x.shape #查看x的形状  (47, 3)

y = data.iloc[:,-1]
y.head()
y = y.values
y.shape     #(47,)

y = y.reshape(47,1)#对y的格式进行转化
y.shape     #(47,1)
cost function
#损失函数
def cost_func(x,y,theta):
    inner = np.power(x@theta-y,2)
    return np.sum(inner)/(2*len(x)) #调用np.power,幂数为2

#初始化参数theta
theta = np.zeros((3,1))#将theta初始化为一个(3,1)的数组
#yinwei
cost1 = cost_func(x,y,theta)#初始化theta得到的代价函数值
gradient descent
#梯度下降
def gradientDescent(x,y,theta,counts):
costs = []#创建存放总损失值的空列表
for i in range(counts):#遍历迭代次数
theta = theta - x.T@(x@theta-y)*alpha/len(x)
cost = cost_func(x,y,theta)#调用损失函数得到迭代一次的cost
costs.append(cost)#将cost传入costs列表
if i%100 == 0: #迭代100次,打印cost值
print(cost)
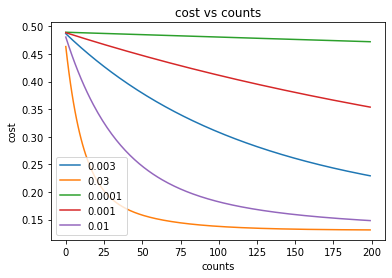
return theta,costsIteration of loss function under different learning rates
alpha_iters = [0.003,0.03,0.0001,0.001,0.01]#设置alpha
counts = 200#循环次数
fig,ax = plt.subplots()
for alpha in alpha_iters:#迭代不同学习率alpha
_,costs = gradientDescent(x,y,theta,counts)#得到损失值
ax.plot(np.arange(counts),costs,label = alpha)#设置x轴参数为迭代次数,y轴参数为cost
ax.legend() #加上这句 显示label
ax.set(xlabel= 'counts', #图的坐标轴设置
ylabel = 'cost',
title = 'cost vs counts')#标题
plt.show()#显示图像
Summarize
Import module - read data - mean normalization - data visualization - process data set - cost function - gradient descent_prediction