System operation and maintenance tool KSysAK - making operation and maintenance simple
1.Basic information
1.1 Overview
The system anomaly locating analysis tool KSysAK is a collection of multiple operation and maintenance tools designed and developed by Yunluan operating system R&D and operation and maintenance personnel summarizing development and operation experience.It can Covers common operation and maintenance scenarios such as daily monitoring of the system, online problem diagnosis, and system fault repair.
The overall design of the tool strives to make operation and maintenance work simple, so that system operation and maintenance personnel can find the problem without having to understand the kernel in depth.
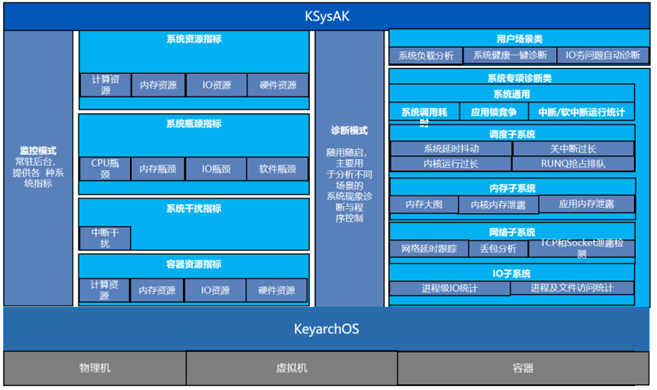
System operation and maintenance tools can be divided into monitoring and diagnostic modes according to functions:
-
System monitoring: Provides more refined resource monitoring for various system resources (CPU, memory, network, file IO, kernel management structure, etc.) to help business operations achieve fine-grained operation and maintenance scheduling and efficient use of resources.
-
System diagnosis: Typical diagnostic problems include abnormal load, network jitter, memory leaks, IO glitches, performance bottlenecks, application abnormalities, etc. Targeted tools are provided while minimizing the professionalism of the tools to make them easier for users to use and interpret.
In order to realize the above functions and provide users with a simple and easy-to-use operation interface, the system operation and maintenance tool KSysAK provides multiple sub-tools, focusing on the collection, statistics and data diagnosis of monitoring data in different scenarios.
1.2 Detailed explanation of environment
IP address: 100.2.93.133
Architecture: x86_64
Type: virtual machine
Operating system version: KOS5.8-sp1
Kernel version: 4.19.91-27.4.7.kos5.x86_64
KSysAK version: 1.3.0
Username: root
Password: 123456a?
1.3 Tools
| Classification | Tool name | Remark |
|---|---|---|
| memory leakmemleak | test_page_leak.ko | Tools for simulating page leaks |
| test_slab_leak.ko | Tools for simulating slab leaks | |
| test_vmalloc_leak.ko | Tool to simulate vmalloc leaks | |
| Latency jitter runlatency | test run latency | Simulate process running delays |
Linux kernel memory leak detection
Kernel memory leaks refer to problems in Linux systems where memory allocated to the kernel is not released correctly due to errors or defects in the code. This can lead to slow system performance, eventually exhausting the system's available memory, or even causing the system to crash. Below I will introduce some methods to detect and solve kernel memory leaks in Linux systems:
There are several different mechanisms for Linux kernel memory allocation, including slab, page, and vmalloc.
The ksysak memleak memory leak detection tool includes the following steps:
-
Integrate into the project: Integrate the memory leak detection code of ksysak memleak into the project that needs to be detected. This usually involves inserting instrumentation code into the project at appropriate locations to ensure that memory allocations and deallocations are accurately tracked.
-
Compile and run the project: Compile the project using the appropriate compilation options and ensure that the project compiles successfully. Then run the project and let it perform a series of operations normally, including memory application and release.
-
Collect memory leak data: During the running of the project, ksysak memleak will record the details of memory allocation and release. This data includes the call stack, allocation size, allocation location, etc. of each memory allocation. This data is collected for subsequent memory leak analysis.
-
Analyze memory leak data: Use the analysis tool provided by ksysak memleak to analyze the collected memory leak data. This can help identify potential sources of memory leaks, the size of the memory leak, and where the leak occurs. With this information, developers can accurately locate the problem and take appropriate fixes.
-
Fix memory leaks: Once the location and cause of memory leaks are identified through analysis tools, developers can fix them. Fixes may involve modifying code to ensure memory is released correctly, fixing errors in memory management logic, etc. After repairing, you can rerun the project and use ksysak memleak to verify that the memory leak problem has been resolved.
It should be noted that ksysak memleak is a memory leak detection tool based on macro calls, which may have a certain impact on project performance. Therefore, when using ksysak memleak for memory leak detection, it is recommended to use it only during the development and debugging phases,and remove it from the project after completing the memory leak repair, to ensure that the performance and stability of the project are not affected.
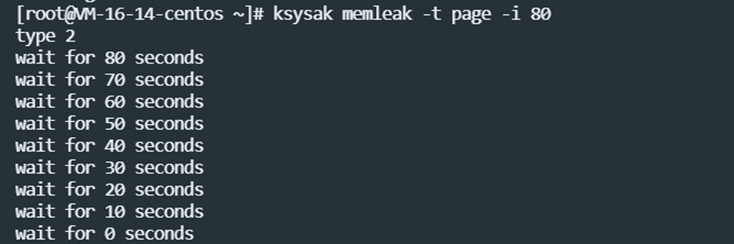
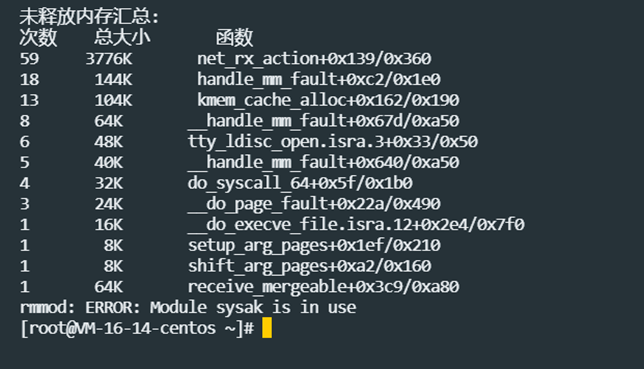
2.1 Page memory leak detection
Execute ksysak memleak -t page -i 80 to start the page memory leak detection program and run it for 80s (if it is too late to execute the detection program, the time can be extended)

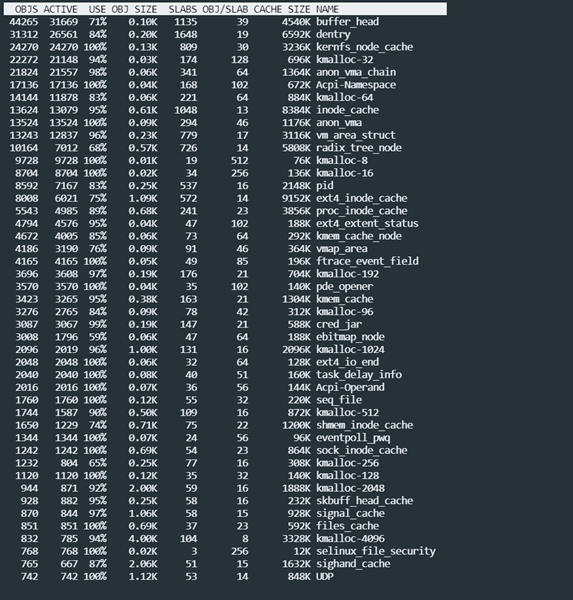
2.2 slab memory leak detection
Execute the slabtop command to view the slab usage of the current system
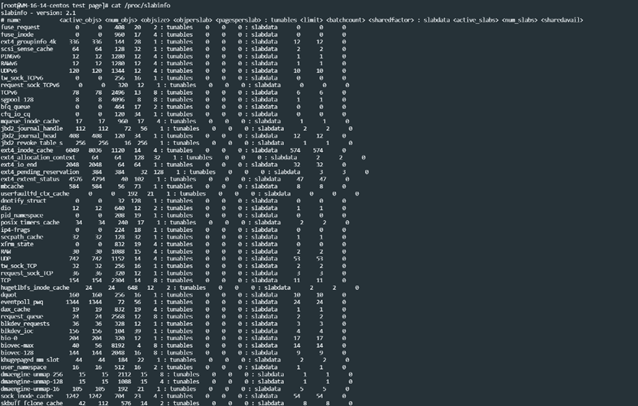
Execute the cat /proc/slabinfo command to obtain more detailed slab cache information.
Use the perf tool to track Slab allocation and deallocation operations in the kernel
Execute ksysak memleak -t slab -i 80 to detect and start the slab memory leak detection program and run it for 80s (if it is too late to execute the detection program, you can extend the time)

OS anomaly analysis
OS exception analysis is an important technology in the operating system, used to deal with abnormal situations that occur during program running. When a program encounters some unhandled errors or special circumstances during execution, the operating system will respond through an exception handling mechanism to protect the stability and security of the system.
3.1 System inspection
Execute #ksysak ossre_client -d to scan the log file to view all abnormal information during system operation.
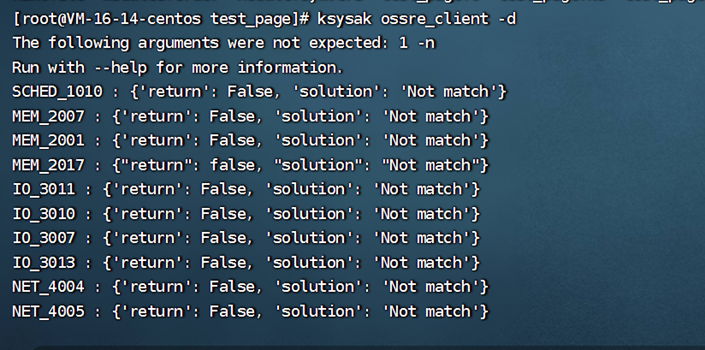
Wait for exception information
Detecting latency jitter in your system
During the operation of the server operating system, there may be many sources of interference to application operation, but the interference may not necessarily affect the business, so at least the frequency and running time of these interference sources need to be included to evaluate whether they are key factors.
At least the following statistics of interference sources need to be included:
-
Device hardware interrupt If during the business operation, a certain type of interrupt frequency is too high or concentrated on a certain CPU, or a single operation is too long, it may affect To see the performance of the business, you can perform operations such as breaking up and binding interruptions to observe the effect.
-
System scheduled interrupt Too many system timers may also cause delays in business wake-up. You can usually analyze whether the business process uses a large number of high-precision timers.
-
Soft interrupt It may be due to a sudden increase in network traffic, etc.
Runlatency, as a sub-tool of the system operation and maintenance tool KSysAK, is used to diagnose places in the system that may affect application running delay jitter and output delay factors. Its kernel monitors delay factors that affect process scheduling (disabling interrupts, not scheduling for a long time, and long run queues). The interrupt and scheduling information of the entire system or a single process can be monitored. The monitored data includes:
Process/thread scheduling delays, such as running queue squeeze, long queuing time, high-priority application preemption or unreasonable scheduling policy settings.
If the response to interrupts and soft interrupts is not timely, the business operation process will depend on the execution process of interrupts and soft interrupts, including network packet sending and receiving, IO reading and writing, etc. Therefore, the interrupt-off duration can be analyzed to determine the interrupt response time.
Kernel state execution is too long: including bottlenecks in the system itself and competition for other resources in the kernel.
4.1 Detecting delay jitter in the system
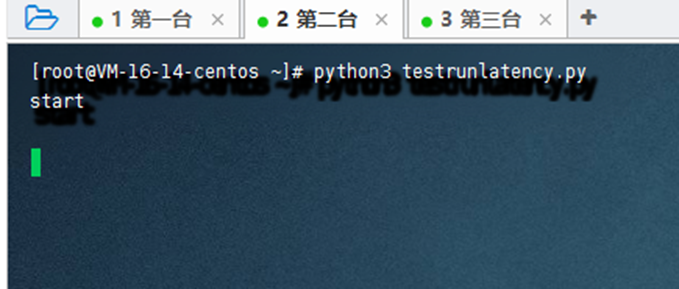
Execute the system latency jitter simulation program testrunlatency.python (in /root)
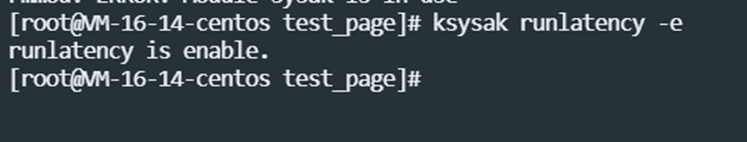
Execute ksysak runlatency -e to start latency jitter monitoring
Execute ksysak runlatency -r ./out to output monitoring data to the out directory
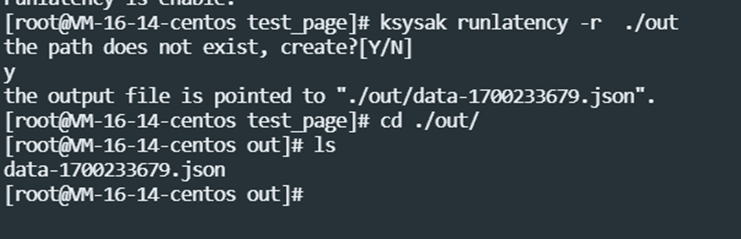
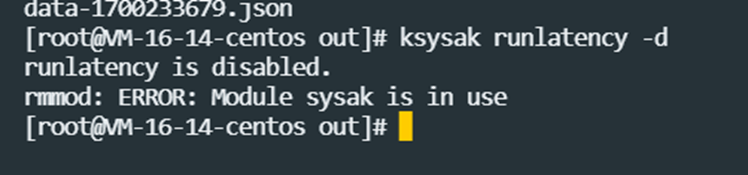
Execute ksysak runlatency -d to turn off monitoring
View the output results in the out directory as follows:

Nosch, hard, soft type delay information, CPU, process id, delay time, command line, stack information, etc.
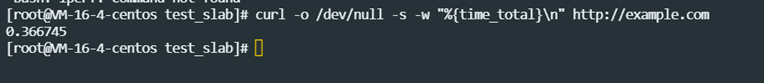
Use curl to test the response and time of web applications. A smaller delay usually means that the system or service can respond to user requests faster.
Product summary
KSysAK is a "crystallization" of a collection of multiple operation and maintenance tools. It can greatly improve the work efficiency of operation and maintenance personnel. Its main functions aredaily monitoring of the system and online monitoring. Diagnosis of problems and repair of system faults, the detection of the system is very detailed. The main features of this product are wide coverage and unrestricted use, which greatly reflects the practicality and extensiveness of the product. , makes operation and maintenance work return to simplicity, allowing system operation and maintenance personnel to find out the problem without having to understand the kernel in depth, which is very convenient!
Overall, this tool is well-deserved for both individual users and on-the-job staff, but it can still be optimized in some aspects, such as:
-
Can enhance customization: Tools should allow users to more fine-grained customization of simulated leak scenarios. For example, users should be able to specify the size, speed, and location of leaks.
-
Detailed reporting: Tools should generate detailed and easy-to-understand reports to help users identify and resolve memory leaks. The report should include the leak's size, location, and possible solutions.
-
Real-time detection and alerting: Tools should be able to detect memory leaks in real time and alert users when potential problems are discovered, which can help solve problems before they become serious.
You can also make a visual interface. For many users, the command line may not be like looking at, or it may be a bit complicated. An intuitive user interface will help users use these tools more conveniently.
Finally, to ensure the effectiveness and accuracy of these tools, regular quality testing and validation is recommended. This ensures they work reliably in different scenarios and configurations.