Network structure
(Picture from the original paper: FCOS: Fully Convolutional One-Stage Object Detection )
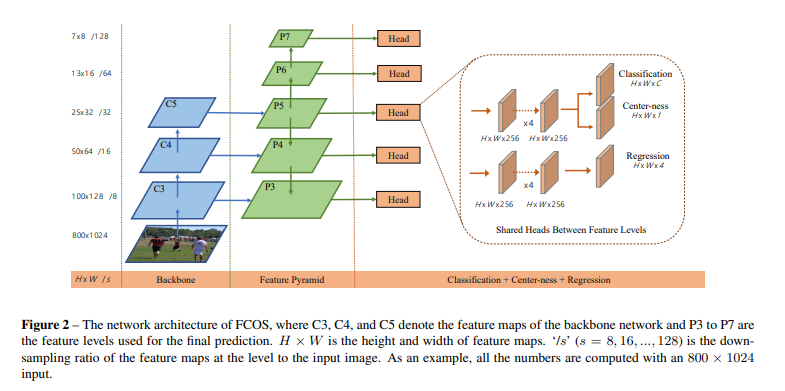
In ResNet50 Backbone, C 3 , C 4 , C 5 C3,C4,C5C 3 ,C 4 ,C 5 is the convolution feature map;
in the FPN structure,P 3 , P 4 , P 5 , P 6 , P 7 P3,P4,P5,P6,P7P3 , _P4 , _P 5 ,P 6 ,P 7 is the final feature map used for prediction;
in the prediction stage,P 3 , P 4 , P 5 , P 6 , P 7 P3,P4,P5,P6,P7P3 , _P4 , _P 5 ,P 6 ,P 7 shares oneHead;
Headthere are three branches, which are used for prediction classification (80 categories), regression prediction center point to the upper heightt, lower heightb, left widthl, right widthr, and Center-ness of the real frame;
Important points
From Anchor to Anchor Free
Anchoraspect
- The size of the Anchor box is fixed, which makes it difficult to detect targets with changes in shape and size, and has poor scalability.
- The size of the Anchor box has a greater impact on detection accuracy.
- The Anchor ratio of positive and negative samples is uneven, that is, the ratio of untargeted to targeted, and the training is complicated.
Anchor Free方面
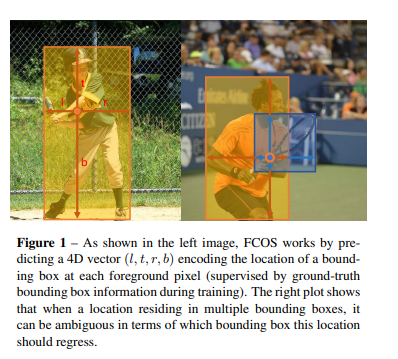
x m i n = c x − l ∗ s y m i n = c y − t ∗ s x m a x = c x + r ∗ s y m a x = c y + b ∗ s x_{min}=c_x-l*s\\y_{min}=c_y-t*s\\x_{max}=c_x+r*s\\y_{max}=c_y+b*s xmin=cx−l∗symin=cy−t∗sxmax=cx+r∗symax=cy+b∗s
inside( xmin , ymin ) (x_{min},y_{min})(xmin,ymin) is the coordinate of the upper left corner of the prediction box,( xmax , ymax ) (x_{max},y_{max})(xmax,ymax) is the coordinate of the lower right corner of the prediction box;
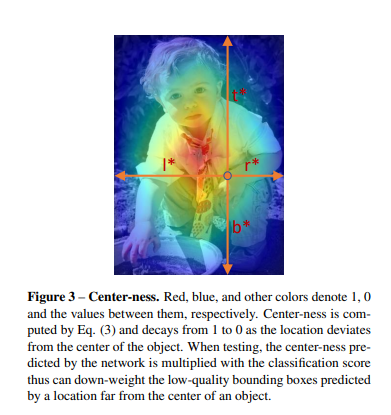
C e n t e r n e s s = m i n ( l ∗ , r ∗ ) m a x ( l ∗ , r ∗ ) ∗ m i n ( t ∗ , b ∗ ) m a x ( t ∗ , b ∗ ) Center ness=\sqrt{\frac{min(l^*,r^*)}{max(l^*,r^*)}*\frac{min(t^*,b^*)}{max(t^*,b^*)}} Centerness=max(l∗,r∗)min ( l∗,r∗)∗max(t∗,b∗)min(t∗,b∗)
Center ness is used to measure the distance between the prediction center and the center of the real box. The closer it is to the center point of the real box, the closer the value is to the value 1.
Positive and negative sample frame matching
In the YOLO series, the IOU value of the anchor and the real frame are compared with the threshold to determine whether it should be used as a positive sample. In FCOS, the anchor free method is used, that is, there is no anchor box.
Another way is: as long as the predicted center coordinates are inside the real box, then these predicted center points are used as positive samples, and the others are used as negative samples.
Of course, in order to pursue better results, the range is further narrowed. If the prediction center point falls on (cx − r ∗ s , cy − r ∗ s , cx + r ∗ s , cy + r ∗ s ) (c_x-r* s,c_y-r*s,c_x+r*s,c_y+r*s)(cx−r∗s,cy−r∗s,cx+r∗s,cy+r∗s ) , it is regarded as a positive sample, whereris the hyperparameter,swhich is the scaling ratio of the feature map relative to the original image.
There is a special case. If the predicted center point falls within the range of two real boxes, the predicted center point will be assigned to the real box with the smallest area by default.
loss function
L ( { p x , y } , { t x , y } , { s x , y } ) = 1 N p o s ∑ x , y L c l s ( p x , y , c x , y ∗ ) + 1 N p o s ∑ x , y 1 { c x , y ∗ > 0 } L r e g ( t x , y , t x , y ∗ ) + 1 N p o s ∑ x , y 1 { c x , y ∗ > 0 } L c t r n e s s ( s x , y , s x , y ∗ ) L(\{p_{x,y}\},\{t_{x,y}\},\{s_{x,y}\})=\frac{1}{N_{pos}}\sum_{x,y}^{}L_{cls}(p_{x,y},c_{x,y}^*)\\+\frac{1}{N_{pos}}\sum_{x,y}^{}1_{\{c_{x,y}^*>0\}L_{reg}(t_{x,y},t_{x,y}^*)}\\+\frac{1}{N_{pos}}\sum_{x,y}^{}1_{\{c_{x,y}^*>0\}L_{ctrness}(s_{x,y},s_{x,y}^*) } L({ px,y},{ tx,y},{ sx,y})=Npos1x,y∑Lcls(px,y,cx,y∗)+Npos1x,y∑1{ cx,y∗>0}Lreg(tx,y,tx,y∗)+Npos1x,y∑1{ cx,y∗>0}Lctrness(sx,y,sx,y∗)
The first line is classification loss;
the second line is bounding box loss;
the third line is "confidence" loss;
N p o s N_{pos} Nposis the number of matching positive samples;
px, y p_{x,y}px,yRepresents the score of each category predicted at feature map (x,y);
cx, y ∗ c_{x,y}^*cx,y∗Represents the corresponding real category label at the feature map (x,y);
1 { cx , y ∗ > 0 } 1_{\{c_{x,y}^*>0\}}1{
cx,y∗>0}Indicates that at the feature map (x, y), the positive sample is 1 and the negative sample is 0;
tx, y, tx, y ∗ t_{x,y},t_{x,y}^*tx,y,tx,y∗Respectively represent the predicted bounding box position and the position information of the real box at the feature map (x, y);
sx, y, sx, y ∗ s_{x,y},s_{x,y}^*sx,y,sx,y∗Represents the predicted center-ness and true center-ness at the feature map (x, y) respectively;