1. Map of the sky
1.1 Introduction
Baidu and Amap are map platforms that are often used by everyone. They have many advantages and have vast open source communities. However, the shortcomings are also very obvious. For example, satellite images cannot be viewed at a large level, and many areas cannot be viewed.
So in many business scenarios we need to view clear satellite images, what should we do? This uses the map of the sky.
Tiantu: "Tiantu" is a comprehensive geographical information service website built by the National Bureau of Surveying, Mapping and Geographic Information. It is an important part of "Digital China" and the public version of the national geographic information public service platform. The purpose of "Heaven Map" is to promote the sharing and efficient use of geographical information resources, improve the public service capabilities and levels of surveying and mapping geographical information, improve the service methods of surveying and mapping geographical information results, better meet the needs of national informatization construction, and provide benefits to the public. Provide convenience for work and life.
It was built by the National Bureau of Mapping and Geographic Information. Relying on its strong background, it completely avoids the problems of the above two maps, but the area is limited to the official Chinese
website address.
Digital management platform
Vue3+Vite+VueRouter+Pinia+Axios+ElementPlus
personal blog
To use Tiandi, you need to first go to the official website ( National Geographic Information Public Service Platform Tiandi ) to register and log in.
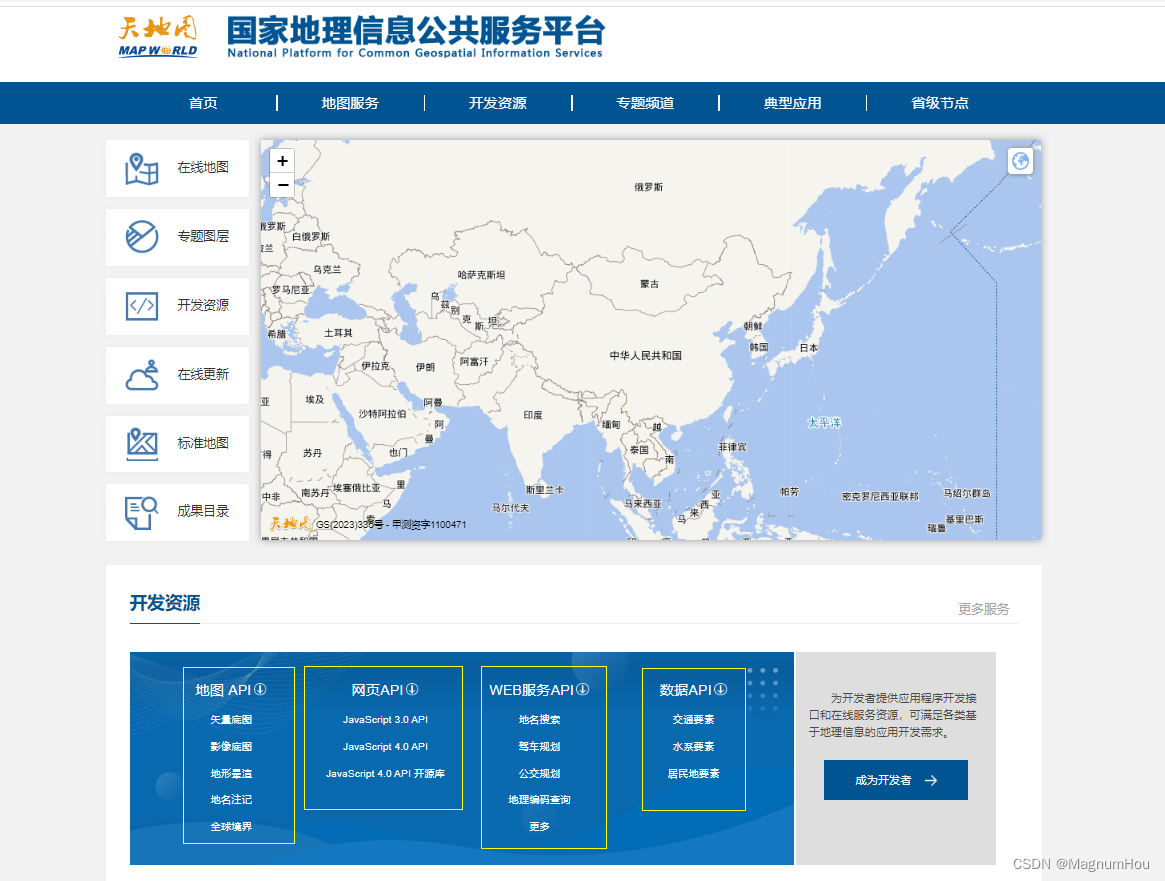
Find Development Resources-> Map API , you can see the map service list
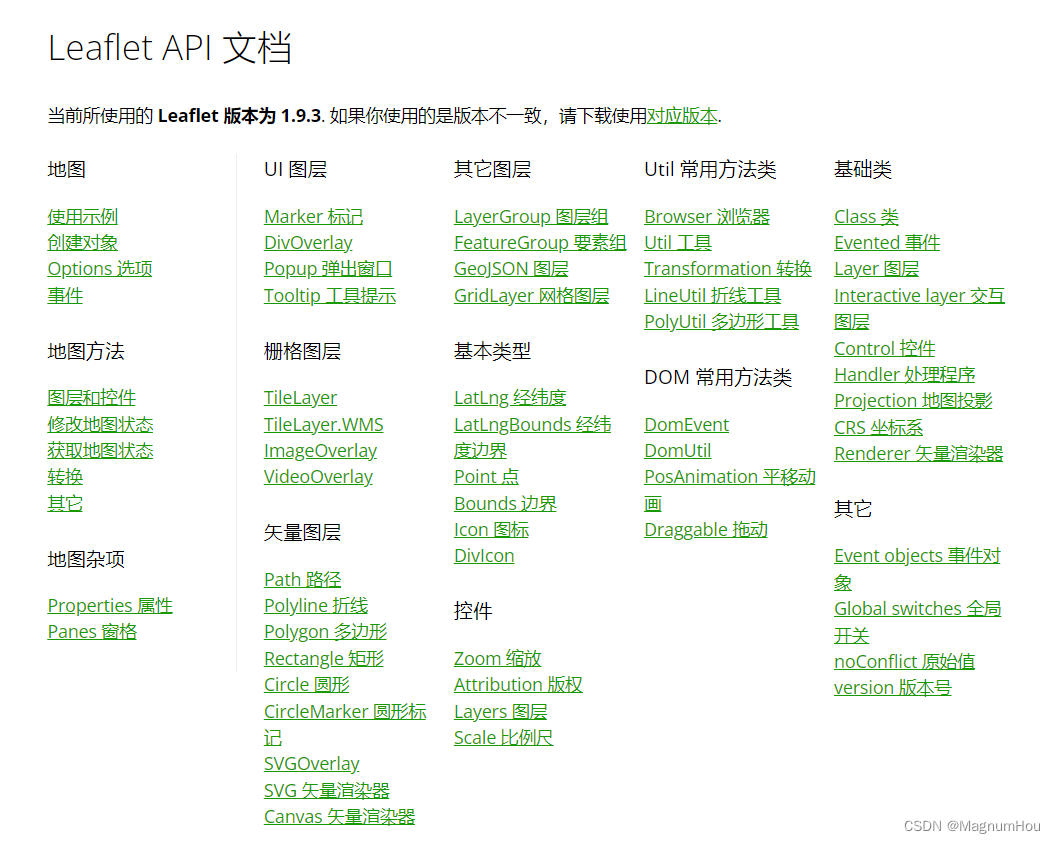
Find Web API->JavaScript API to view related examples and class references.
1.2 Six steps are required to implement a simple rendering of the sky map:
-
Prepare page
<!DOCTYPE html> <html> <head> <meta charset="UTF-8"/> <title>HELLO WORLD</title> <script type="text/javascript" src="http://api.tianditu.gov.cn/api?v=4.0&tk=您的密钥"></script> <script> var map; var zoom = 12; function onLoad() { map = new T.Map('mapDiv'); map.centerAndZoom(new T.LngLat(116.40769, 39.89945), zoom); } </script> </head> <body onLoad="onLoad()"> <div id="mapDiv" style="position:absolute;width:500px; height:400px"></div> </body> </html> -
Introduce Tiantu JS file
<script src="http://api.tianditu.gov.cn/api?v=4.0&tk=您的密钥" type="text/javascript"></script> -
Create a container element
The map needs an HTML element as a container so that it can be displayed on the page. Here we have created a div element. Set the width and height of the div element to 100% each so that it fills the entire screen, or you can calculate the size of the browser window and set it. -
Create a map instance
//初始化地图对象 var map=new T.Map('mapDiv'); -
Determine latitude and longitude coordinates
var lnglat = new T.LngLat(116.40969,39.89945)Here we use the T.Lnglat class under the T namespace to create a coordinate point. The T.Lnglat class describes a geographical coordinate point, where 116.40969 represents the longitude and 39.89945 represents the latitude.
-
Map initialization
map.centerAndZoom(lnglat,12);After creating the map instance, we need to initialize it. The map.centerAndZoom method requires setting the center point coordinates and map level. The map must be initialized before other operations can be performed.
1.3 Tool code
 var lineConfig = {


    showLabel: true,
    color: 'red'
};
 var lineTool = new T.PolylineTool(this.map, lineConfig); // 创建测距工具
 lineTool.open() // 打开测距工具 可以开始打点测距
 lineTool.close() ;// 关闭测距工具
 lineTool.clear() ;// 清除所有点
 var polygonConfig =  {


    showLabel: true,
    color: "red", weight: 3, opacity: 0.5, fillColor: "#FFFFFF", fillOpacity: 0.5
};
 var polygonTool = new T.PolygonTool(this.map, polygonConfig);// 创建测面工实例, 其使用方式与测距相同
1.4 Display and hide information form
 var  infoWindow = new T.InfoWindow(); // 创建信息窗体实例
 infoWindow.setContent('<div></div>'); // 设置信息窗体内容, 也可以在vue中使用ref
 infoWindow.setLngLat(new T.LngLat(e['lnglat']['lng'], e['lnglat']['lat'])); // 设置信息窗标准点
 map.addOverLay(infoWindow);// 打开信息窗体
 map.removeOverLay(infoWindow);//关闭信息窗体
1.5 Mark points on the map
 var icon = new T.Icon({


     iconUrl: imgsrc,  // 图标url
     iconSize: new T.Point(30, 40) // 图标大小
  }); // 创建标记点使用的图标
 var marker = new T.Marker(new T.LngLat(info['oriLongitude'] , info['oriLatitude']), {


     icon: icon
  })  ; // 创建标记点实例, 第一个参数为坐标点天地图经纬度, 第二个参数是配置项
  map.addOverLay(marker); // 显示此坐标点
  map.removeOverLay(marker); // 隐藏此坐标点
  marker.addEventListener("click", callback); // 绑定marker的点击事件, 这里我们可以做一些操作, 比如弹出信息窗体等
1.5 Drawing lines
  var line = new T.Polyline(path, {

    weight: 8,opacity: 0.7}); //path为天地图经纬度数组,第二个参数为配置项
  map.addOverLay(line);  // 绘制线到地图上
  map.removeOverLay(line);// 移除线
For other related drawings such as: drawing circles, polygons, etc., please refer to the official documentation for details and will not be repeated one by one.
2. Leaflet
2.1 Introduction
Leaflet.js is one of the most popular mapping libraries out there. It is a flexible, lightweight, open source JavaScript library for creating interactive maps. It is only 42 KB of JS in size and has all the map features most developers need.
Leaflet is a framework for rendering map data. The data, as well as the basemap layer, must be provided by the developer. The map consists of tile layers as well as browser support, default interactivity, panning and zooming capabilities. You can also add more custom layers and plug-ins, as well as all mappings in Leaflet. This map gallery converts your data into map layers and provides excellent support, making it the first choice for most developers. It runs well on major desktop and mobile platforms, making it the perfect JavaScript library for mobile and large screen maps.
Leaflet Chinese site
Leaflet official site
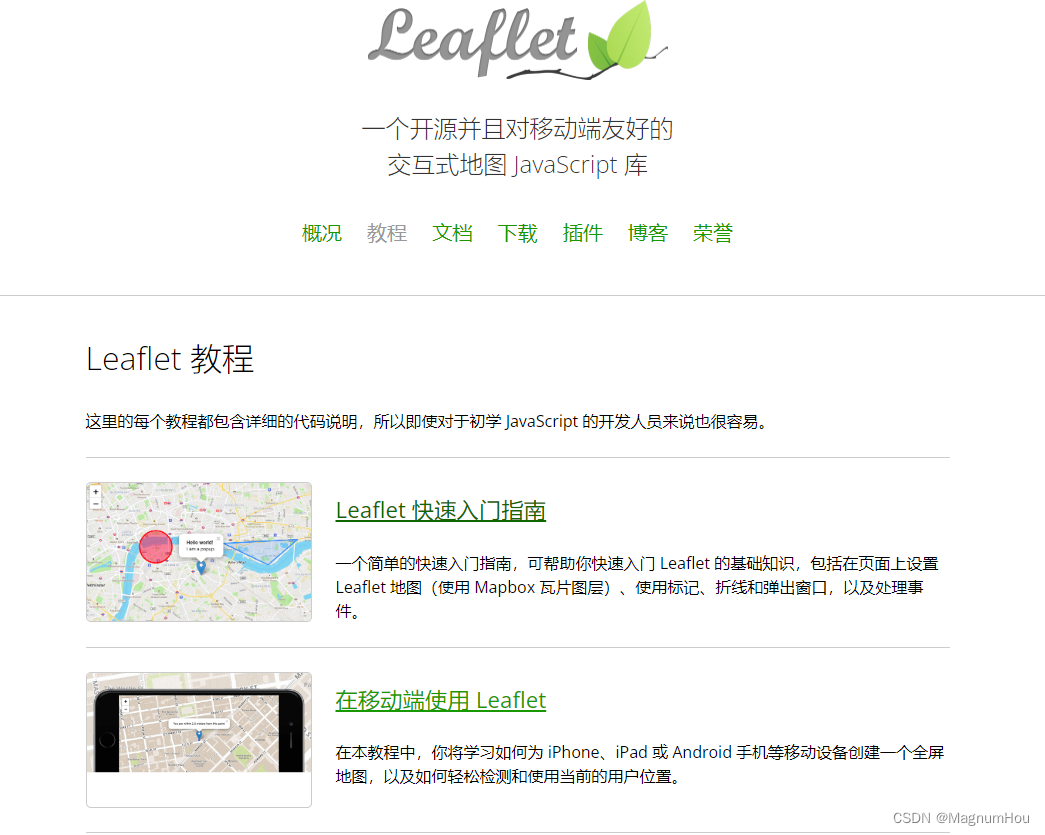
Some simple Leaflet uses, such as: setting up a Leaflet map, using markers, polylines and popups, and handling events.
2.2 Prepare an html page and introduce the corresponding files
- Introduce the Leaflet CSS file into the head section of the document:
 <link rel="stylesheet" href="https://unpkg.com/[email protected]/dist/leaflet.css"
     integrity="sha256-kLaT2GOSpHechhsozzB+flnD+zUyjE2LlfWPgU04xyI="
     crossorigin=""/>
- Import the Leaflet JavaScript file after importing the Leaflet CSS file:
 <!-- Make sure you put this AFTER Leaflet's CSS -->
 <script src="https://unpkg.com/[email protected]/dist/leaflet.js"
     integrity="sha256-WBkoXOwTeyKclOHuWtc+i2uENFpDZ9YPdf5Hf+D7ewM="
     crossorigin=""></script>
- Place the div element with a specific id where you want the map to be:
<div id="map"></div>
- Make sure the map container has a fixed height defined, e.g. set in CSS:
#mapid {

     height: 180px; }
2.3 Initialize the map and set geographical coordinates and zoom level
var map = L.map('map').setView([51.505, -0.09], 13);
All mouse and touch interaction on the map is enabled by default, with zoom and attribute controls.
The setView call also returns the map object. In fact, most Leaflet methods behave like this when they do not return an explicit value. This allows you to easily make jQuery-like chain calls.
2.4 Add a tile layer to the map
Creating a tile layer usually involves setting a URL template for the tile image, attributed text, and the layer's maximum zoom level.
L.tileLayer('https://tile.openstreetmap.org/{z}/{x}/{y}.png', {
maxZoom: 19,
attribution: '© <a href="http://www.openstreetmap.org/copyright">OpenStreetMap</a>'
}).addTo(map);
Make sure to include the leaflet.js file and configure the divs before running all code. That's it, you now have a functioning Leaflet map.
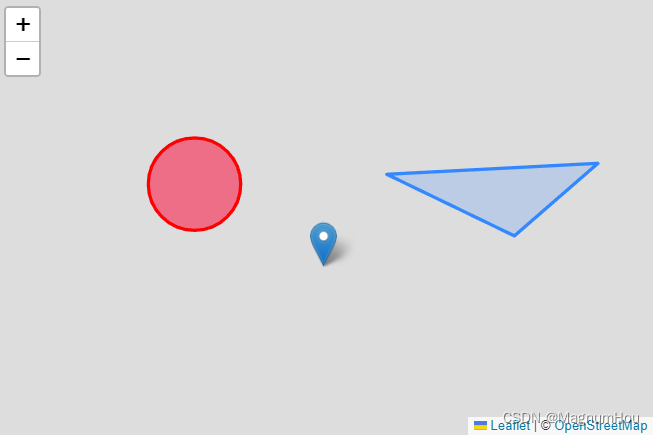
2.5 Draw markers, circles and polygons
-
Draw marker points
var marker = L.marker([51.5, -0.09]).addTo(map); -
Draw a circle
var circle = L.circle([51.508, -0.11], { color: 'red', fillColor: '#f03', fillOpacity: 0.5, radius: 500 }).addTo(map); -
Draw polygon
	var polygon = L.polygon([
	    [51.509, -0.08],
	    [51.503, -0.06],
	    [51.51, -0.047]
	]).addTo(map);
2.6 Add popups
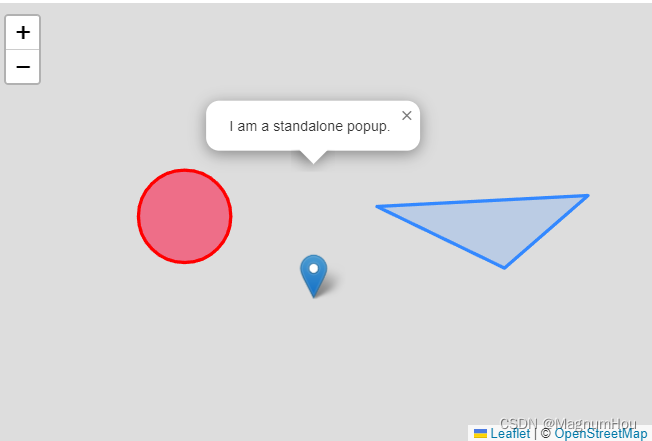
Popups are typically used when you want to attach some information to a specific object on the map. Leaflet has a shortcut:
marker.bindPopup("<b>Hello world!</b><br>I am a popup.").openPopup();
circle.bindPopup("I am a circle.");
polygon.bindPopup("I am a polygon.");
Try clicking on our object. The bindPopup method attaches a pop-up window with specified HTML content to your markup, so that the pop-up window appears when you click the object, and the openPopup method (for markup only) opens the attached pop-up window immediately.
2.7 Handling events
Every time something is triggered in Leaflet, such as a user clicking a marker or a map zoom change, the corresponding object sends an event to which you can subscribe using a function. It allows you to react to user interaction:
function onMapClick(e) {


    alert("You clicked the map at " + e.latlng);
}

map.on('click', onMapClick);
The first parameter of the listener function is an event object - it contains useful information about the event that occurred. For example, the map click event object (e in the example above) has a latlng property, which is the location where the click occurred.
Improve the example by using popup instead of alert:
var popup = L.popup();

function onMapClick(e) {


    popup
        .setLatLng(e.latlng)
        .setContent("You clicked the map at " + e.latlng.toString())
        .openOn(map);
}

map.on('click', onMapClick);
Other detailed documents
2.8 Other plug-ins
3. Calculate another longitude and latitude based on one longitude, latitude and distance angle.
/**
  * 根据一个经纬度及距离角度,算出另外一个经纬度
  * @param {*} lng 经度 113.3960698
  * @param {*} lat 纬度 22.941386
  * @param {*} brng 方位角 45 ---- 正北方:000°或360° 正东方:090° 正南方:180° 正西方:270°
  * @param {*} dist 90000距离(米)
  * 1、角度转换为弧度公式:弧度=角度×(π ÷度180 )
  * 2、弧度转换为角度公式: 角度=弧度×(180÷π)
*/
function getLonAndLat(lng, lat, brng, dist) {
    //大地坐标系资料WGS-84 长半径a=6378137 短半径b=6356752.3142 扁率f=1/298.2572236
    var a = 6378137;
    var b = 6356752.3142;
    var f = 1 / 298.257223563;

    var lon1 = lng * 1;
    var lat1 = lat * 1;
    var s = dist;
    var alpha1 = brng * (Math.PI / 180)//mapNumberUtil.rad(brng);
    var sinAlpha1 = Math.sin(alpha1);
    var cosAlpha1 = Math.cos(alpha1);

    //var tanU1 = (1 - f) * Math.tan(mapNumberUtil.rad(lat1));
    var tanU1 = (1 - f) * Math.tan(lat1 * (Math.PI / 180));
    var cosU1 = 1 / Math.sqrt((1 + tanU1 * tanU1)), sinU1 = tanU1 * cosU1;
    var sigma1 = Math.atan2(tanU1, cosAlpha1);
    var sinAlpha = cosU1 * sinAlpha1;
    var cosSqAlpha = 1 - sinAlpha * sinAlpha;
    var uSq = cosSqAlpha * (a * a - b * b) / (b * b);
    var A = 1 + uSq / 16384 * (4096 + uSq * (-768 + uSq * (320 - 175 * uSq)));
    var B = uSq / 1024 * (256 + uSq * (-128 + uSq * (74 - 47 * uSq)));

    var sigma = s / (b * A), sigmaP = 2 * Math.PI;
    while (Math.abs(sigma - sigmaP) > 1e-12) {
        var cos2SigmaM = Math.cos(2 * sigma1 + sigma);
        var sinSigma = Math.sin(sigma);
        var cosSigma = Math.cos(sigma);
        var deltaSigma = B * sinSigma * (cos2SigmaM + B / 4 * (cosSigma * (-1 + 2 * cos2SigmaM * cos2SigmaM) -
            B / 6 * cos2SigmaM * (-3 + 4 * sinSigma * sinSigma) * (-3 + 4 * cos2SigmaM * cos2SigmaM)));
        sigmaP = sigma;
        sigma = s / (b * A) + deltaSigma;
    }

    var tmp = sinU1 * sinSigma - cosU1 * cosSigma * cosAlpha1;
    var lat2 = Math.atan2(sinU1 * cosSigma + cosU1 * sinSigma * cosAlpha1,
        (1 - f) * Math.sqrt(sinAlpha * sinAlpha + tmp * tmp));
    var lambda = Math.atan2(sinSigma * sinAlpha1, cosU1 * cosSigma - sinU1 * sinSigma * cosAlpha1);
    var C = f / 16 * cosSqAlpha * (4 + f * (4 - 3 * cosSqAlpha));
    var L = lambda - (1 - C) * f * sinAlpha *
        (sigma + C * sinSigma * (cos2SigmaM + C * cosSigma * (-1 + 2 * cos2SigmaM * cos2SigmaM)));

    var revAz = Math.atan2(sinAlpha, -tmp); // final bearing

    var lngLatObj = { lng: lon1 + L * (180 / Math.PI), lat: lat2 * (180 / Math.PI) }
    return lngLatObj;
}