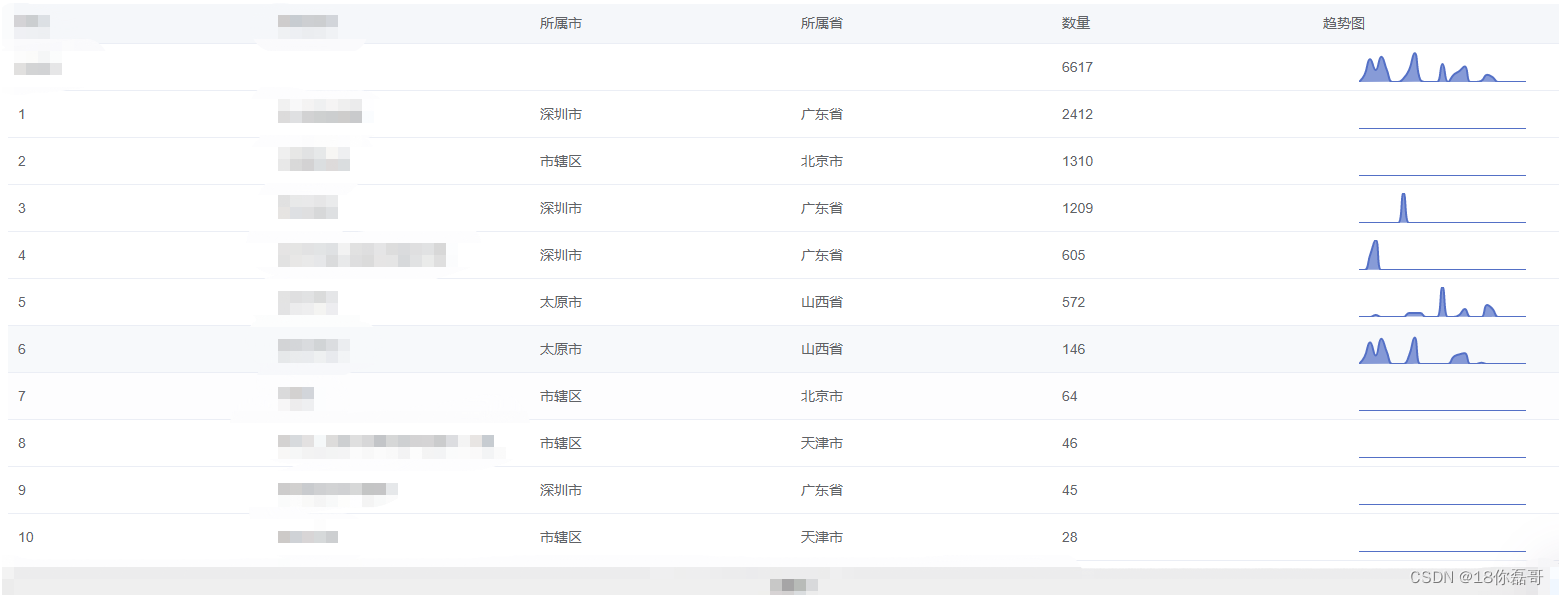
Display effect: The trend chart on the right actually queries the 30-day data volume of the current row.
Background: In order to imitate the burndown chart on ZenTao, but looking at its source code, we found that it was written in PHP. We wanted to use Vue to implement it.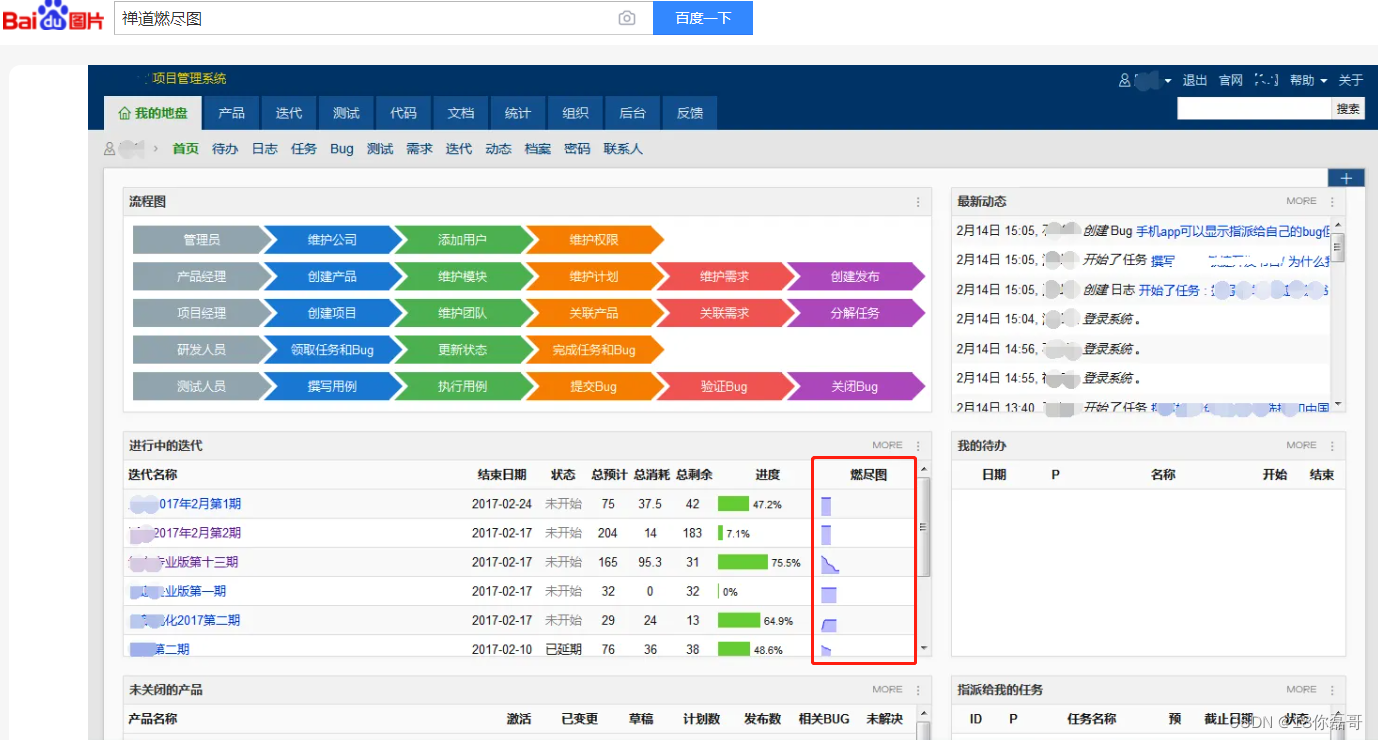
Implementation steps: 1. First use el-table to draw the table
Note: At this time, the data is placed in the list, but the id in the trend chart cannot be unique, and the dev needs to be changed into a line chart of echarts based on the id, so use d="'main_'+scope.row.rank " to replace. The following style can control the size of the trend chart
<el-table
      :data="list"
      :height='570'
      @selection-change="setSelectRows"
    >
      <el-table-column prop="rank" label="排名" :style="{margin,left: '50px'}" show-overflow-tooltip ></el-table-column>
      <el-table-column prop="name" label="名称" show-overflow-tooltip ></el-table-column>
      <el-table-column prop="city" label="所属市" show-overflow-tooltip ></el-table-column>
      <el-table-column prop="province" label="所属省" show-overflow-tooltip ></el-table-column>
      <el-table-column prop="num" label="数量" show-overflow-tooltip ></el-table-column>
      <el-table-column label="趋势图" show-overflow-tooltip>
        <template #default="scope">
            <!--为echarts准备一个具备大小的容器dom-->
          <div :id="'main_'+scope.row.rank" style="width:70%;height:30px;margin: 0 auto;"></div>
        </template>
      </el-table-column>
2. Data assignment in trend charts: data acquisition in the background
Note: 1 The essence here lies in Promise.then() in the initEcharts method : The purpose of Promise.then is to enable the execution of asynchronous code to be executed from top to bottom in the specified order , breaking the limitations of asynchronous code. The trendQuery method is an asynchronous method. There is no initEcharts method. If you directly call the synchronous method of initData, the id will be called before the div is rendered, and an error that cannot be called will appear: Uncaught Error: Initialize failed: invalid dom---- --- This is because echarts needs to obtain dom during initialization. 2. Use "main_" + state.list[i].rank) to obtain the fields of the corresponding row corresponding to the id in the above html.
import * as echarts from 'echarts'


const fetchData = async () => {
      state.listLoading = true
      const {
        retCode, success, data, msg
      } = await trendQuery(state.queryForm)
      if (retCode == 0) {
        state.list = data.records;

        initEcharts();
      } else {
        proxy.$baseMessage(msg, 'error', 'vab-hey-message-error');
      }
    }

// 方法
const initEcharts = () => {
      // 新建一个promise对象
      let newPromise = new Promise((resolve) => {
        resolve()
      })
      //然后异步执行echarts的初始化函数
      newPromise.then(() => {
        //	此dom为echarts图标展示dom
        // echarts.init(DOm)
        initData();
      })
    }

const initData = () => {
      console.log(" initData 执行中 ")
      for (let i = 0; i < state.list.length; i++) {
        let myChart = echarts.init(document.getElementById("main_" + state.list[i].rank));
        // 绘制图表
        myChart.setOption({
          xAxis: {
            show: false, //取消显示坐标轴,坐标轴刻度,坐标值(如果是y轴,默认的网格线也会取消显示)
            type: 'category',
            boundaryGap: false,
            splitLine: {
              show:false
            },
            data: []
          },
          grid: {
            left: "0",
            top: "0",
            right: "0",
            bottom: "0",
            containLabel: true,
          },
          yAxis: {
            axisLabel: { // 取消显示坐标值
              show: false
            },
            splitLine: { //取消网格线
              show:false
            },
            type: 'value'
          },
          series: [
            {
              symbol: "none",
              smooth: true,//平滑
              type: "line",
              data: state.list[i].trend,
              areaStyle: {}
            }
          ]
        });
        window.onresize = function () { // 自适应大小
          myChart.resize();
        };
      }
    }
3. Draw the image
MyChart.setOption({......}) is used. If you are interested, you can view the Documentation - Apache ECharts and exercises in the case on the echarts official website.