Table of contents
1.3 Select subsets through timestamp index
2. Fixed frequency time series
2.1 Creation of fixed frequency time series
2.2 Frequency and offset of time series
3. Time period and calculation
3.2 Frequency transformation of periods
4.1 Resampling method (resample)
5. Data Statistics - Sliding Window
1. Time series
1.1 Time series
时间序列It refers to a numerical sequence formed at multiple points in time, which can occur regularly or irregularly.
Time series data mainly include the following types:
-
Timestamp: timestamp: represents a specific moment, such as now.
-
Period: period: such as 2022 or March 2022.
-
Time interval: interval: represented by a start timestamp and an end timestamp.
1.2 Create time series
In Pandas, the most basic time series type 时间戳is indexed Series对象.
Timestamps are represented using Timestamp (a subclass derived from Series) objects, which are highly compatible with datetime and can be converted into objects directly through to_datetime()functions .datetimeTimeStamp
For example:
import pandas as pd
from datetime import datetime
import numpy as np
print(pd.to_datetime('20200828142123')) # 将datetime转换为Timestamp对象,年月日 时秒分When a list of multiple datetimes is passed in, Pandas will coerce it into a DatetimeIndex class object.
# 传入多个datetime字符串
date_index = pd.to_datetime(['20200820151423', '20200828212325', '20200908152360'])
print(date_index)
按照索引获取时间戳:

for i in range(len(date_index)):
    print(date_index[i])
pandas timestamp as indexed Series object
# 创建时间序列类型的Series对象
date_index = pd.to_datetime(['20200820151423', '20200828212325', '20200908152360'])
# 创建以时间戳为索引的series对象
date_ser = pd.Series([11, 22, 33], index=date_index)
print(date_ser)
You can also pass a list containing multiple datetime objects to the index parameter, and you can also create a Series object with a timestamp index.
# 指定索引为多个datetime的列表
date_list = [datetime(2020, 1, 1), datetime(2020, 1, 15),
             datetime(2020, 2, 20), datetime(2020, 4, 1),
             datetime(2020, 5, 5), datetime(2020, 6, 1)]
time_se = pd.Series(np.arange(6), index=date_list)
print(time_se)
DataFrame object has timestamp index
data_demo = [[11, 22, 33], [44, 55, 66],
             [77, 88, 99], [12, 23, 34]]
date_list = [datetime(2020, 1, 23), datetime(2020, 2, 15),
             datetime(2020, 5, 22), datetime(2020, 3, 30)]
time_df = pd.DataFrame(data_demo, index=date_list)
print(time_df)
1.3 Select subsets through timestamp index
# 指定索引为多个日期字符串的列表,要有相同的格式
date_list = ['2017.05.30', '2019.02.01',
             '2017.6.1', '2018.4.1',
             '2019.6.1', '2020.1.23']
# 将日期字符串转换为DatetimeIndex
date_index = pd.to_datetime(date_list)
# 创建以DatetimeIndex 为索引的Series对象
date_se = pd.Series(np.arange(6), index=date_index)
print(date_se)
Select a subset:
1. Obtain subset data through position index
print(date_se[3])2. Get data using the date constructed by datetime
#根据datetime构造日期获取
date_time = datetime(2018,4,1)
print(date_se[date_time])
3. Get the date string that meets the format requirements
#传入相应的符合日期的字符串获取
print(date_se['20180401'])
print(date_se['2018.04.01'])
print(date_se['2018/04/01'])
print(date_se['2018-04-01'])
print(date_se['04/01/2018'])
4. Directly use the specified year or month to operate the index to obtain data for a certain year
print(date_se['2017'])5. Use the truncate() method to intercept Series or DataFrame objects
truncate(before = None,after = None,axis = None,copy = True)-
before – means truncate all rows before this index value.
-
after – means truncate all rows after this index value.
-
axis – represents the truncated axis, defaulting to the row index direction.
# 扔掉2018-1-1之前的数据
sorted_se = date_se.sort_index()
print(sorted_se.truncate(before='2018-1-1'))
# 扔掉2018-7-31之后的数据
print(sorted_se.truncate(after='2018-7-31'))2. Fixed frequency time series
2.1 Creation of fixed frequency time series
The date_range() function provided in Pandas is mainly used to generate a DatetimeIndex object with a fixed frequency.
Parameter Description:
-
start: Indicates the starting date, the default is None.
-
end: Indicates the end date, the default is None.
-
periods: Indicates how many timestamp index values are generated.
-
freq: used to specify the timing unit.
Notice:
startAt endleast three parameters must be specified for periodsthese freqfour parameters, otherwise an error will occur.
Usage is as follows:
1. When calling the date_range() function to create a DatetimeIndex object, if only the start date (start parameter) and end date (end parameter) are passed in, the timestamp generated by default is calculated on a daily basis, that is, the freq parameter is D
# 创建DatetimeIndex对象时,只传入开始日期与结束日期
print(pd.date_range('2020/08/10', '2023/08/20'))
2. If only the start date or end date is passed in, you also need to use the periods parameter to specify how many timestamps to generate.
# 创建DatetimeIndex对象时,传入start与periods参数
print(pd.date_range(start='2020/08/10', periods=5))
# 创建DatetimeIndex对象时,传入end与periods参数,往前推
print(pd.date_range(end='2020/08/10', periods=5))3. If you want the timestamps in the time series to be on fixed Sundays every week, you can set the freq parameter to "W-SUN" when creating the DatetimeIndex.
dates_index = pd.date_range('2020-01-01',         # 起始日期
                            periods=5,            # 周期
                            freq='W-SUN')         # 频率
print(dates_index)
4. If the date contains time-related information and you want to generate a set of timestamps normalized to midnight of the day, you can set the value of the normalize parameter to True.
# 创建DatetimeIndex,并指定开始日期、产生日期个数、默认的频率,以及时区
date_index = pd.date_range(start='2020/8/1 12:13:30', periods=5,
tz='Asia/Hong_Kong')
print(date_index)
#规范化时间戳
date_index2 = pd.date_range(start='2020/8/1 12:13:30', periods=5,
normalize=True, tz='Asia/Hong_Kong')
print(date_index2)2.2 Frequency and offset of time series
1. The time series data generated by default is calculated on a daily basis, that is, the frequency is "D".
-
"D" is a fundamental frequency, represented by an alias of a string, such as "D" is an alias for "day".
-
Frequency is composed of a base frequency and a multiplier, for example, "5D" means every 5 days.
Other frequency descriptions are as follows:
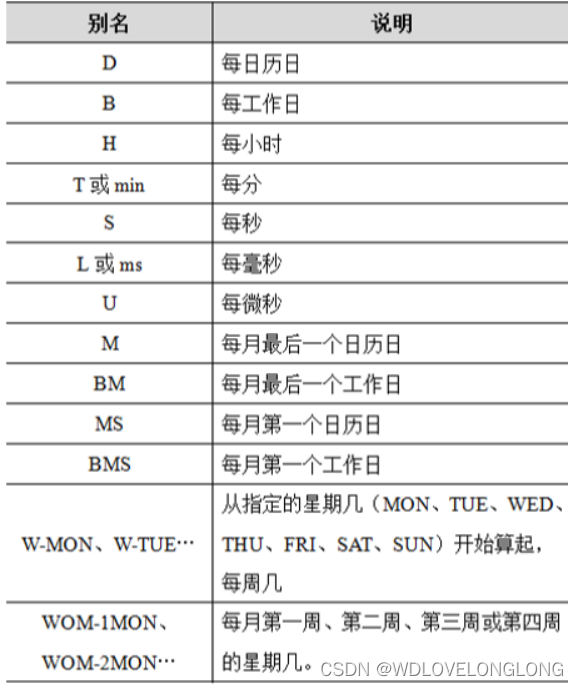
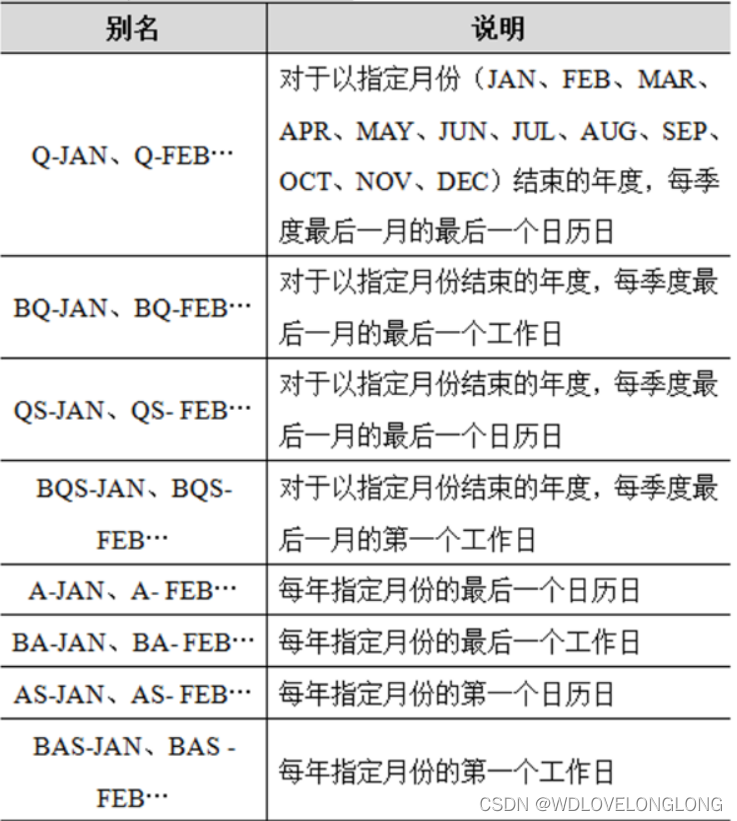
Used to specify the freq attribute:
date_time5D = pd.date_range(start='2020/2/1', end='2020/2/28', freq='5D')
print(date_time5D)
2. Each basic frequency can also be followed by a DateOffset object called a date offset. If you want to create a DateOffset object, you need to import the pd.tseries.offsets module first.
You can specify an offset to create a time series. At the same time, create an offset of 14 days and 10 hours, which can be converted into two weeks and ten hours. The "week" is represented by the Week type, and the "hour" is represented by the Hour type. They You can use the plus sign to connect them.
import pandas as pd
from datetime import datetime
import numpy as np
from pandas.tseries.offsets import *
date_offset1 = DateOffset(weekday=2,hour=10)
''' - year
- month
- day
- weekday
- hour
- minute
- second
- microsecond
- nanosecond.'''
date_offset2 = Week(2) + Hour(10)
date_index1 = pd.date_range('2020/3/1',periods=5,freq=date_offset1)
date_index2 = pd.date_range('2020/3/1',periods=5,freq=date_offset2)
print(date_index1)
print(date_index2)2.3 Movement of time series
Moving refers to moving data forward or backward along the time axis. As shown below:
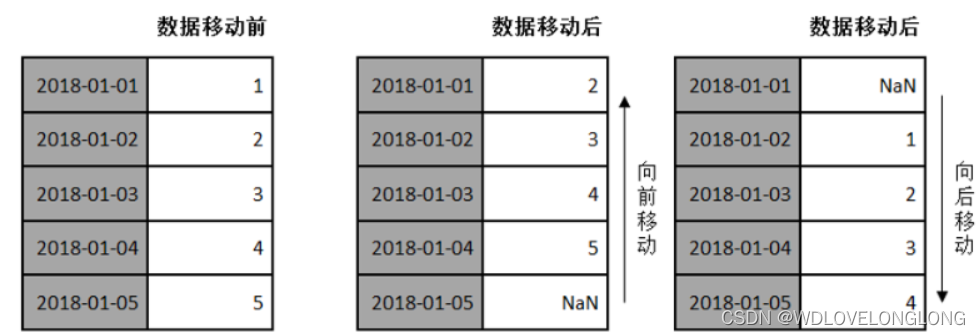
The Pandas object provides a shift() method to move data forward or backward, but the data index remains unchanged.
Usage is as follows:
shift(periods=1, freq=None, axis=0)
#periods – 表示移动的幅度,可以为正数,也可以为负数,默认值是1,代表移动一次。
date_index = pd.date_range('2020/01/01', periods=5)
time_ser = pd.Series(np.arange(5) + 1, index=date_index)
print(time_ser)
# 向后移动一次
print(time_ser.shift(1))
#向前移动一次
print(time_ser.shift(-1))
3. Time period and calculation
3.1 Creation of time period
1. The Period class represents a standard time period or period, such as a certain year, a certain month, a certain day, a certain hour, etc.
The way to create a Period class object is relatively simple. You only need to pass in a date in the form of a string or integer in the constructor.
# 创建Period对象,表示从2020-01-01到2020-12-31之间的时间段
period = pd.Period(2020)
print(period)
# 表示从2019-06-01到2019-06-30之间的整月时间
period = pd.Period('2019/6')
print(period)2.Period objects can participate in mathematical operations.
If the Period object is added to or subtracted from an integer, the displacement operation will be performed according to the specific time unit.
period = period + 1   # Period对象加上一个整数
print(period)
If a mathematical operation is performed on two Period objects with the same frequency, the result is their number of units.
# 表示从2019-06-01到2019-06-30之间的整月时间
period = pd.Period('2019/6')
print(period)
period = period + 1 # Period对象加上一个整数
print(period)
# 创建一个与period频率相同的时期
other_period = pd.Period(201401, freq='M' )
print(period - other_period)3. If you want to create multiple Period objects and they appear regularly, you can use the period_range() function.
Returns a PeriodIndex object, which is an index composed of a set of period objects. An example is as follows:
period_index = pd.period_range('2014.1.8', '2014.5.31', freq='M')
print(period_index)
4. In addition to using the above method to create a PeriodIndex, you can also directly pass in a set of date strings in the PeriodIndex construction method.
period_index = pd.period_range('2014.1.8', '2014.5.31', freq='M')
print(period_index)
str_list = ['2012', '2013', '2014']
period_list = pd.PeriodIndex(str_list, freq='A-DEC')
print(period_list)
time_index = pd.Series(np.arange(len(period_index)) + 1,index = period_index)
print(time_index)Note: DatetimeIndex is an index structure used to refer to a series of time points, while PeriodIndex is an index structure used to refer to a series of time periods.
3.2 Frequency transformation of periods
1.Pandas provides an asfreq() method to convert the frequency of the period.
asfreq(freq,method = None,how = None,normalize = False,fill_value = None )
Parameter Description:
-
freq – represents the timing unit.
-
how - can take the value of start or end, and the default is end.
-
normalize – Indicates whether to reset the time index to midnight.
-
fill_value – The value used to fill in missing values.
# 创建时期对象
period = pd.Period('2019', freq='A-DEC')
print(period)
period_freq_start = period.asfreq('M', how='start')
print(period_freq_start)
period_freq_end = period.asfreq('M',how='end')
print(period_freq_end)
4. Resampling
4.1 Resampling method (resample)
1. resample() in Pandas is a convenient method for resampling and frequency conversion of regular time series data.
resample(rule, how=None, axis=0, fill_method=N
date_index = pd.date_range('2019.7.8', periods=30)
time_ser = pd.Series(np.arange(len(date_index)) + 1, index=date_index)
print(time_ser)
print(time_ser.resample('W-MON').mean())one, closed=None, label=None, ...)
Parameter Description:
-
rule – A string or DateOffset representing the resampling frequency.
-
fill_method – Indicates how to interpolate when upsampling.
-
closed – Sets which end of the downsampling is closed.
1. Resample the data through the resample() method
Note: The how parameter is no longer recommended, but the new method ".resample(...).mean()" is used to calculate the average.
2. If the closed parameter passed in during resampling is left, it means that the sampling range is left-closed and right-open.
That is, in a time series within a certain range, the timestamp at the beginning is included, but the timestamp at the end is not included.
print(time_ser.resample('W-MON', closed='left').mean())4.2 Downsampling
1. Downsampling time particles will become larger and the amount of data will be reduced. In order to avoid that the data corresponding to some timestamps is idle, you can use built-in methods to aggregate data.
For example, OHLC resampling is more common for stock data, including the opening price, the highest price, the lowest price, and the closing price.
Pandas provides an ohlc() method specifically.
date_index = pd.date_range('2020/06/01', periods=30)
shares_data = np.random.rand(30)
time_ser = pd.Series(shares_data, index=date_index)
print(time_ser)
result = time_ser.resample('7D').ohlc()        # OHLC重采样 得到七天中的开盘价,最高价,最低价以及收盘价
print(result)
2. Downsampling is equivalent to another form of grouping operation. It groups the time series according to date, and then applies the aggregation method to each grouping to obtain a result.
# 通过groupby技术实现降采样
result = time_ser.groupby(lambda x: x.week).mean()
print(result)
4.3 upsampling
1. The time granularity of upsampling becomes smaller and the amount of data will increase, which is likely to result in some timestamps not having corresponding data.
When encountering this situation, the commonly used solution is interpolation. There are several specific methods:
-
Use the ffill(limit) or bfill(limit) method to fill in the value before or after the null value. Limit can limit the number of fills.
-
Filling is performed through fillna('ffill') or fillna('bfill'). Passing in ffill means filling with the value before NaN, and passing in bfill means filling with the following value.
-
Complete the data according to the interpolation algorithm by using the interpolate() method.
data_demo = np.array([['101', '210', '150'], ['330', '460', '580']])
date_index = pd.date_range('2020/06/10', periods=len(data_demo), freq='W-SUN')
time_df = pd.DataFrame(data_demo, index=date_index,
columns=['A产品', 'B产品', 'C产品'])
print(time_df)
#增加采样时间,但没有填充数据
time_df_asfreq = time_df.resample('D').asfreq()
print(time_df_asfreq)
#用前面的数据填充
time_df_ffill = time_df.resample('D').ffill()
print(time_df_ffill)
#用后面的数据 填充
time_df_bfill = time_df.resample('D').bfill()
print(time_df_bfill)5. Data Statistics - Sliding Window
5.1 Sliding window
1. The sliding window refers to framing the time series according to the specified unit length to calculate the statistical indicators within the frame.
It is equivalent to a slider with a specified length sliding on the scale, and the data in the slider can be fed back every time it slides one unit.
Examples are as follows:
A certain branch has calculated the sales data for the whole year of 2017 on a daily basis. Now the general manager wants to randomly check the sales of the branch on August 28 (Chinese Valentine's Day). If the data of that day is only taken out separately, the data is relatively absolute and cannot be well understood. Reflects overall sales around this date.

In order to improve the accuracy of the data, the value of a certain point can be expanded to an interval including the point, and the data within the interval can be used for judgment.
You can take out the data from August 24 to September 2 and find the average value of this interval as the spot check result.
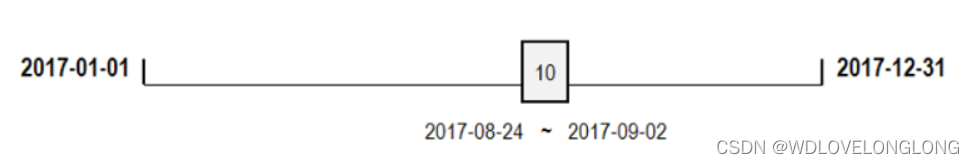
This interval is the window, its unit length is 10, and the data is calculated on a daily basis, so the average indicator is calculated for 10 days, which is more reasonable and can well reflect the overall situation of the Chinese Valentine's Day activities.
3. Moving the window means that the window slides to one end. Each slide does not slide the entire section, but slides unit by unit.
For example, if the window slides one unit to the right, the time interval framed by the window is from 2017-08-25 to 2017-09-03.
Each time the window moves, it will only move one unit of length at a time, and the length of the window is always 10 units until it moves to the end.
It can be seen from this that the indicators calculated through the sliding window will be more stable, and the range of data fluctuation will be smaller.
5.2 Sliding window method
Pandas provides a window method rolling().
rolling(window, min_periods=None, center=False, win_type=None, on=None, axis=0, closed=None)Parameter Description:
-
window – represents the size of the window.
-
min_periods – Minimum number of observations per window.
-
center – Whether to center the window label.
-
win_type – represents the type of window.
-
closed – used to define the opening and closing of the interval.
year_data = np.random.randn(365)
date_index = pd.date_range('2017-01-01', '2017-12-31', freq='D')
ser = pd.Series(year_data, date_index)
print(ser.head()) #打印前几个数据 默认为5
#画图观察
import matplotlib.pyplot as plt
ser.plot(style='y--')
ser_window = ser.rolling(window=10).mean()
ser_window.plot(style='b')
plt.show()