This article is suitable for quickly understanding ECG signals and can perform data filtering.
1. ECG data preprocessing (eliminating power frequency interference and baseline drift)
* Please see the bottom of the article for ECG data and rdmat function
1. Import ECG data
## 心电图导入及读取
clc;
[TIME,M,Fs,siginfo]=rdmat('100m');# 通过读取函数ramat对心电图进行处理
Fs=1500;# 采样频率
plot(TIME,M);
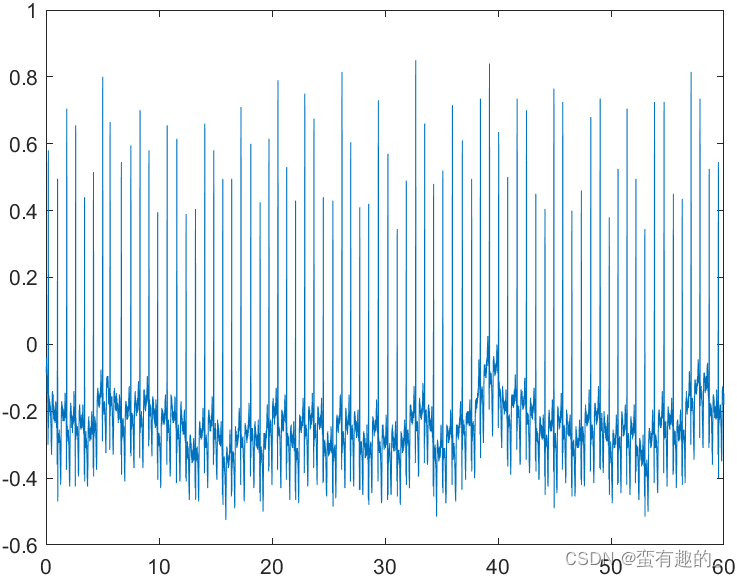
2. Select the first 1000 data points for subsequent processing
ecg = M(1:1000);
TIME = TIME(1:1000);
plot(TIME,ecg)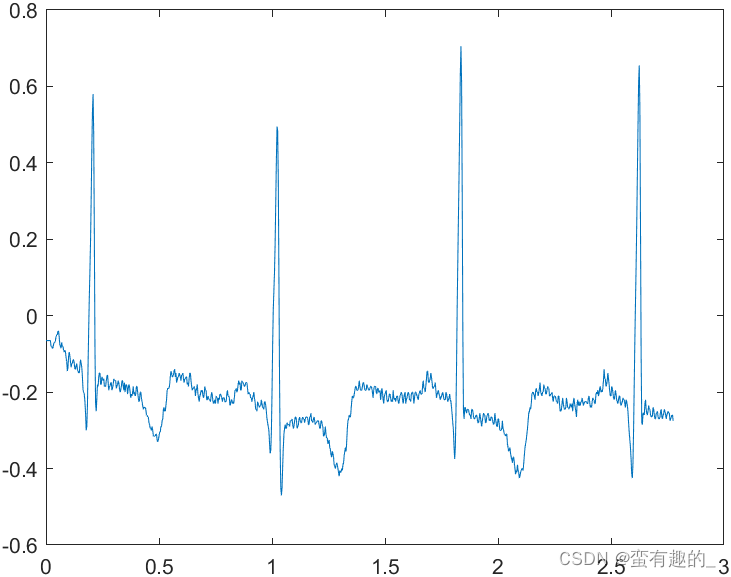
3. Remove the 50Hz frequency interference in the ECG signal (usually 50Hz in China) - notch filter
## Butterworth 陷波滤波器-去除工频干扰
# 设计滤波器
d = designfilt('bandstopiir','FilterOrder',2, ...
               'HalfPowerFrequency1',49,'HalfPowerFrequency2',51, ...
               'DesignMethod','butter','SampleRate',Fs);
#应用滤波器去除50Hz干扰
ecg_50 = filtfilt(d,ecg);
4. Remove low-frequency signals (below 5Hz) from the ECG signal - eliminate baseline drift
##bandpass滤波器-解决基线漂移
fmaxd_1=5;# 截止频率为5Hz
fmaxn_1=fmaxd_1/(Fs/2);
[B,A]=butter(1,fmaxn_1,'low');
ecg_low=filtfilt(B,A,ecg_50);# 通过5Hz低通滤波器的信号
ecg1=ecg_50-ecg_low; # 减去5Hz低频信号
plot(TIME,ecg1)
xlabel('t(s)');
ylabel('mv');
title('期望信号');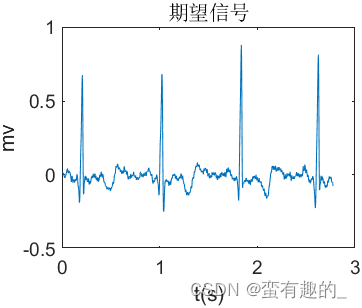
5. Add random noise
* wgn function: randomly add white noise
##添加随机噪声信号
Noise_White = (0.1*wgn(1,length(TIME),2))';
plot(Noise_White)
title('噪声信号');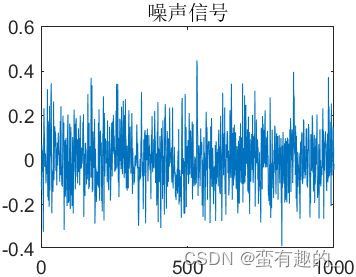
6. Signal after noise interference
##噪声干扰后信号
Mix_Signal = ecg1 + Noise_White;
plot(TIME,Mix_Signal)
xlabel('t(s)');
ylabel('mv');
title('噪声干扰后信号');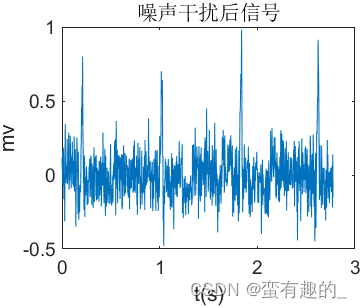
2. Filtering (Wiener filtering)
*h is the value obtained after running Wiener filter, which can be obtained by running the Wiener filter design part below :
##维纳滤波
Signal_Filter = filter(h,1,Mix_Signal);# 将输入信号通过维纳滤波器
figure(1)
plot(TIME,Signal_Filter)
xlabel('t(s)');
ylabel('mv');
title('维纳滤波后信号');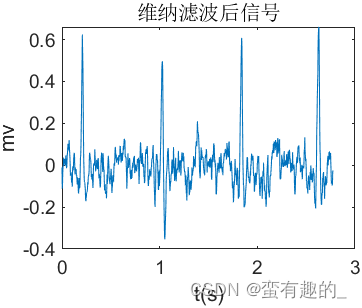
3. Mean square error
* The statistical mean square error of the signal after introducing noise relative to the original signal:
mse1 = 0.0153
* Statistical mean square error of the filtered signal relative to the original signal:
mse2 = 0.0069
After applying Wiener filtering, the signal is closer to the original signal.
* ECG data and rdmat function
Link: https://download.csdn.net/download/qq_41958946/86841684
Original source of ECG data: MIT-BIH Arrhythmia Database (mitdb)