
"""
An unknown college student, known as Caigou in the world of martial arts
original author: jacky Li
Email : [email protected]
Last edited: 2022.11.14
"""
Boss, take a detour, this is a loser.
Table of contents
Boss, take a detour, this is a loser.
An online SEIR model visualization platform
COVID-19 epidemic development prediction based on GNN
By building statistical models, mathematical models, or using machine learning and deep learning methods to fit the epidemic development trend, historical data can be used to predict future confirmed cases and other epidemic situations, for example, logistic growth curve fitting data, prediction Possible development trends in the next few days; or use a time series model to build a prediction model; you can also use LSTM to build a prediction model, a special RNN network. The above method, except for the growth curve, other models require a large amount of data for training. As far as the current situation is concerned, the amount of data is not large. Even if the model is built, the reference value is not great. It is not integrated with the business and is only understood by the data. data.
Another modeling idea can be to build an infectious disease model from traditional disease transmission models (SIS, SIR, SEIR, etc.), combine the transmission characteristics of this coronavirus, use the existing number of samples to estimate a rough parameter, and establish an appropriate The mathematical model of infectious diseases can more accurately predict the development trend of the epidemic. Of course, this is a more complex and professional issue. Recently, although the "SIQS infectious disease model with saturated incidence rate (the explanation is that any infectious disease has a saturated incidence rate, that is, it cannot be completely eliminated)" researched and constructed by the team of academician Zhong Nanshan was rejected by authoritative foreign journals, the research results are still It is in line with the development trend of the domestic epidemic.
According to relevant scholars, the SIQS infectious disease model is actually based on the traditional SEIR model, plus two intervention factors, namely the country’s strong intervention and the return peak after the Spring Festival. In addition, on February 28, 2020, Academician Zhong Nanshan’s team Published an article titled "SEIR and AI Forecast Revision of COVID-19 Epidemic Trends under Public Health Intervention", integrating population migration data before and after January 23, 2020 and the latest COVID-19 epidemiological data into the SEIR model To generate an epidemic curve, the team also used artificial intelligence technology to conduct training based on the 2003 SARS data to better predict the new crown epidemic. The research team also used a long-short-term memory model to predict changes in the number of new infections over time. For the processing of the basic training data set, the research team used the case statistics of SARS from April to June 2003 and incorporated COVID-19 epidemiological parameters. Judging from the research results of Academician Zhong Nanshan’s team, assuming it is a purely technical team, it is impossible to make a predictive model with strong interpretability and high credibility. Therefore, data modeling not only relies on technical tools, but also more With business theoretical background, the model should not be a cold technical implementation, but should be a warm and connotative integration of business and technology.
Since I do not have relevant knowledge in the fields of infectious diseases and medical expertise, from a non-professional perspective, I tried to use the Logistic growth curve to simulate the cumulative number of confirmed cases in Tai'an, and tried to briefly describe the traditional disease transmission model-SEIR.
(1) Logistic growth curve
The logistic curve is a special curve first discovered by Belgian data scientists. Later, biologists R. Pearl and L.J. Reed studied the population growth rules based on this theory. Therefore, the logistic growth curve is also Known as the growth curve or pearl curve. The general form of a logistic growth curve is as follows:
Yt=L1+yes-bt
L, a, and b are all unknown parameters and need to be estimated based on historical data. Growth curves are widely used in modern business, production industries, biological sciences, etc.
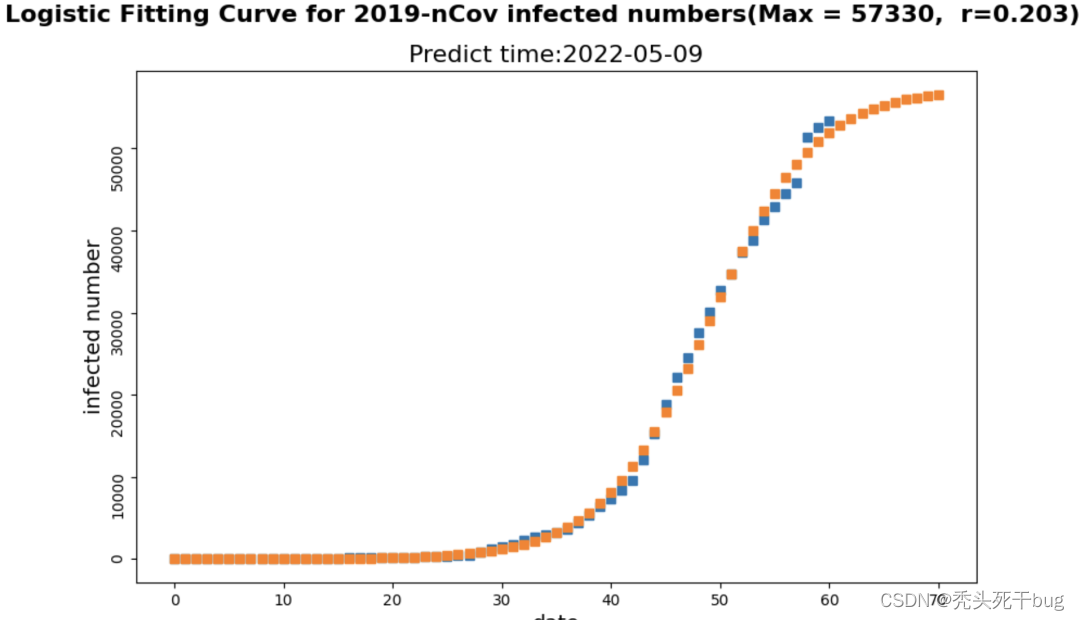
We used the growth curve model to fit the cumulative confirmed case data in Shanghai from March 1 to April 30, 2022, and established a growth curve model. The data fitting is shown in the figure below. The blue part shows the observed values of confirmed cases, the orange part shows the predicted values of confirmed cases, and the three days of confirmed predicted case data are calculated (May 7, May 8, 5 9th).
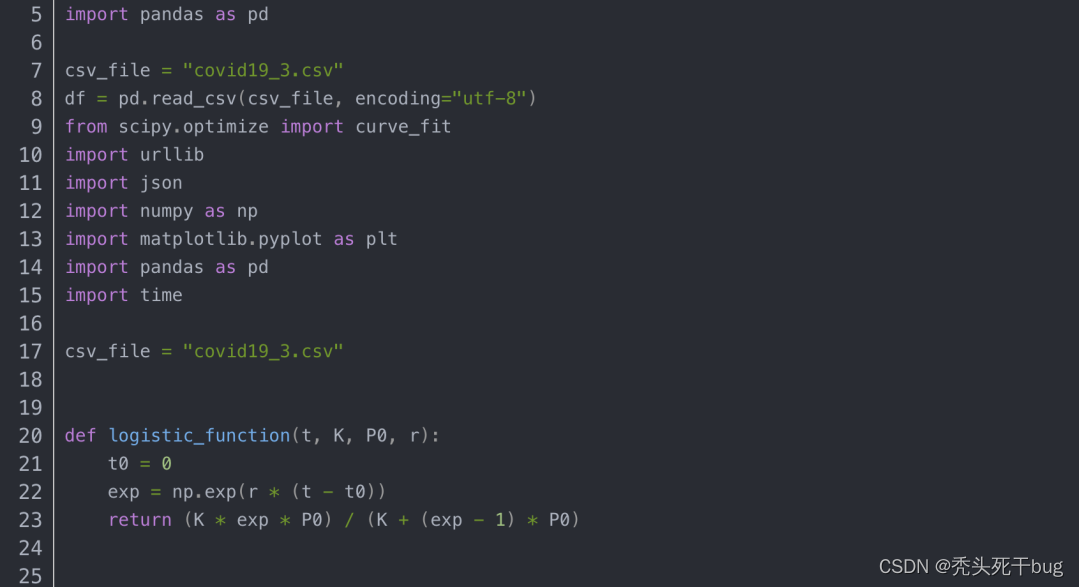
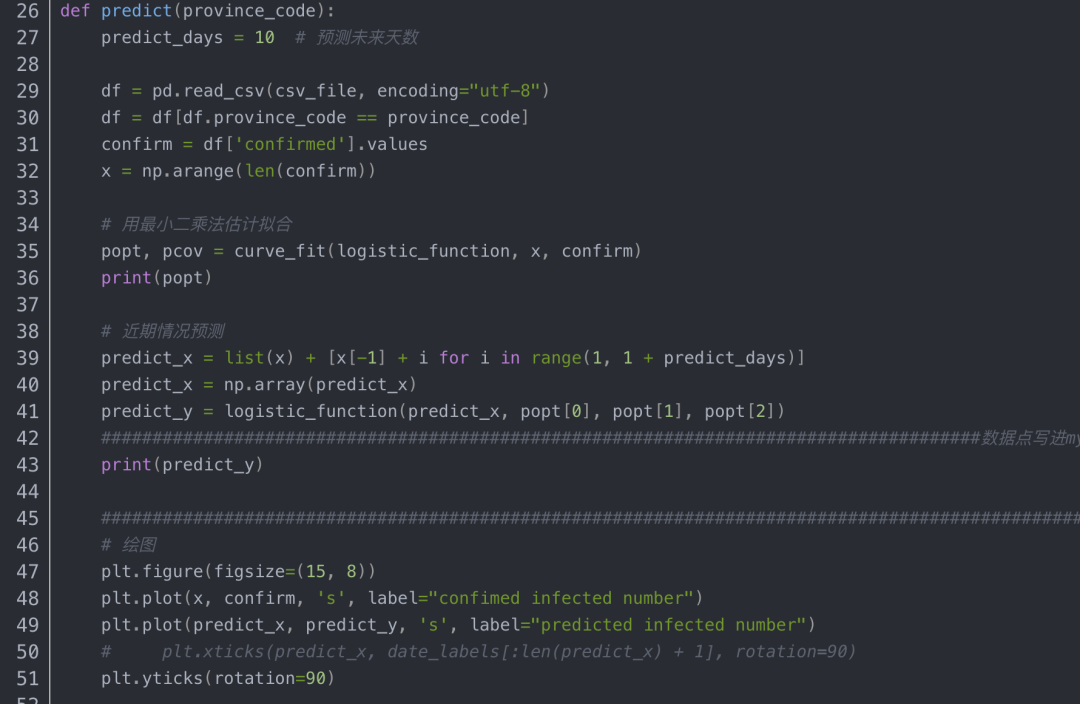
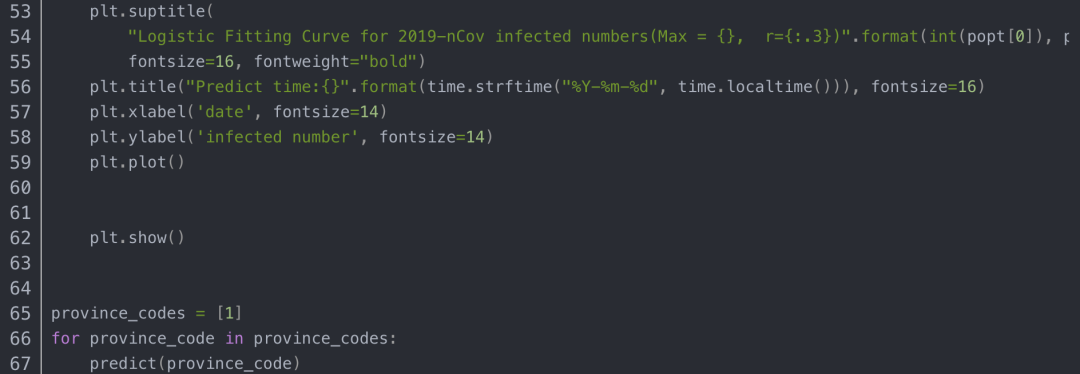
Logistic fitting code
Judging from the curve generated by the predicted value in the above figure, the growth curve model overall presents an "S" shape. According to the relevant reference documents, the growth curve can be divided into three stages: initial, middle and final stages:
In the early stage, although t is in the growth stage, the growth of y is relatively slow, and the curve shows a gentle rise at this time;
In the mid-term, as t increases, the growth rate of y gradually increases, and the curve shows a rapid upward trend; when it reaches the inflection point (t, Y), due to the growth of the saturation degree of the function reaching the end, as t increases, the The growth is relatively slow, the growth rate approaches 0, and the curve develops horizontally.
After understanding the characteristics of the model, assuming that external factors interfere with the development of events, it will cause a sudden increase or decrease in data, which will affect the prediction accuracy of the model. Therefore, the logistic growth model only estimates the disease and cannot accurately judge, nor is it the best model. Of course, the prediction accuracy can be improved through model optimization. Some literature proposes that the obtained model can be optimized according to the 0.618 optimization method proposed by Hua Luogeng (calculate whether the model can obtain the minimum sum of squared residuals of the predicted value and the measured value). We won’t go into details here and can discuss and learn later.
(2) Disease spread model-SEIR
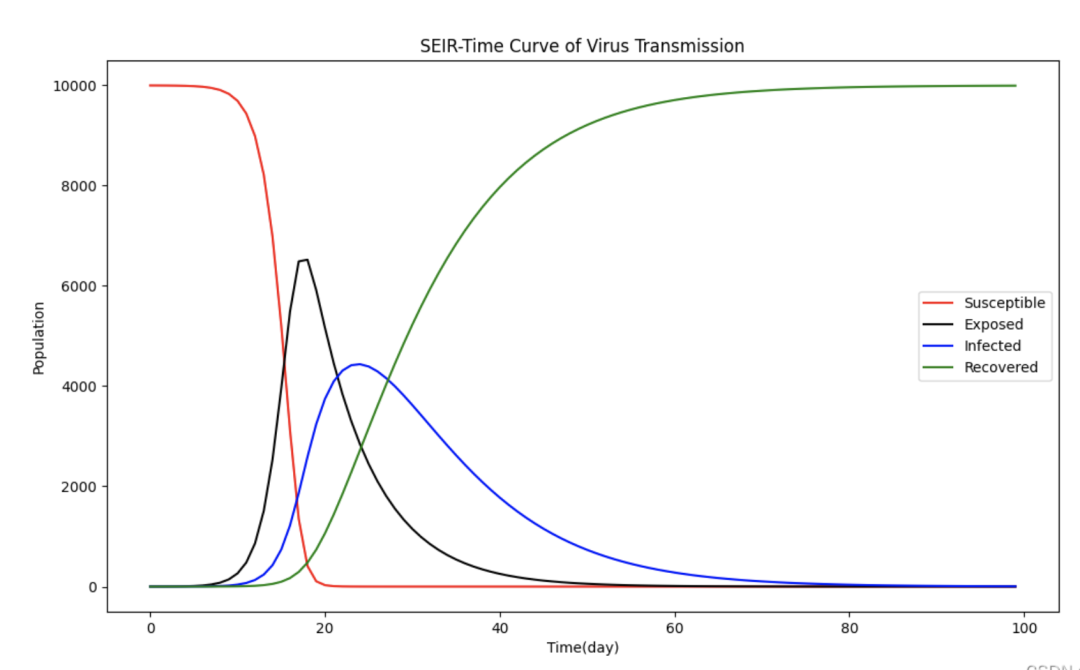
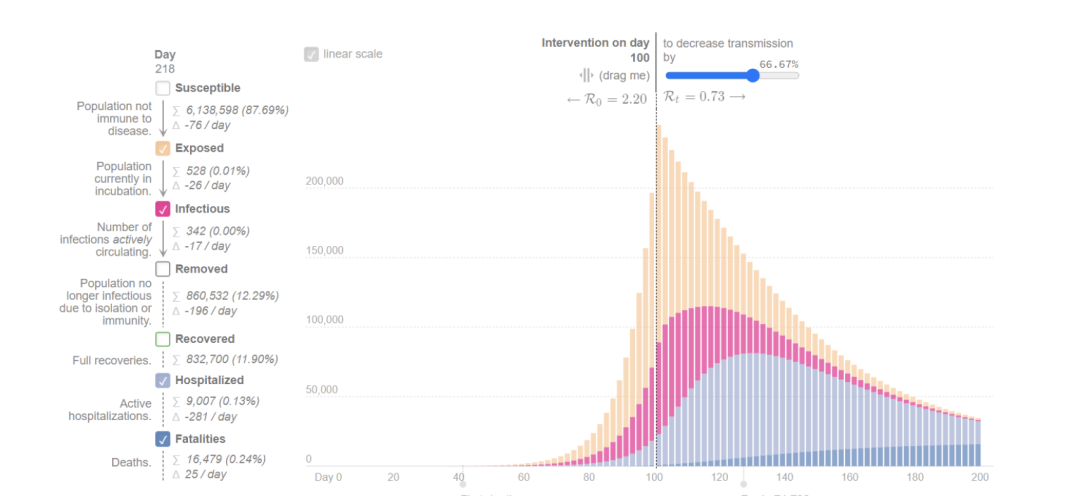
After reviewing the relevant literature, we found that common infectious disease models are divided into SI, SIR, SIRS, SEIR models, etc. according to the type of infectious disease. They are used to study the spread speed, spatial range, transmission routes and other issues of infectious diseases, and are used to guide the treatment of infectious diseases. prevention and control. The model involves S, E, I, R, r, β, γ, α parameters:
Category S: Susceptible, refers to people who are not sick, but lack immunity, and are easily infected after contact with infected people; Category E: Exposed, refers to people who have been in contact with infected people, but are temporarily incapacitated People who infect other people, suitable for infectious diseases with long incubation period; Category I: Infectious, refers to people infected with infectious diseases, which can be transmitted to members of Category S, turning them into Category E or Category I members ; Category R: Recovered, refers to people who are isolated or have immunity due to recovery from illness. If the immunity period is limited, members of the R category can change to the S category again.
r: The number of susceptible people that infected patients (I) come into contact with every day; β: Infectious coefficient, determined by the transmission ability of the disease itself and the prevention and control capabilities of the population; γ: Recovery coefficient, generally the reciprocal of the course of the disease, such as the course of influenza 5 If it is days, then its γ is 1/5; α: the probability of onset of a latent person, generally the reciprocal of the incubation period.
We no longer use the collected data to simulate the development of the epidemic. On the one hand, we cannot better estimate the various parameters involved in the model. There are many parameters that need to be considered. On the other hand, the data cannot support the model. Derivation, especially the government intervention factors and social public opinion factors of the epidemic, will have a certain impact on the development trend of the epidemic, and relevant factors should be taken into consideration. Therefore, this issue is a relatively complicated process, and we will not go into it here. Explore more. Anyone who is interested can search for relevant literature and materials and conduct in-depth research and study.
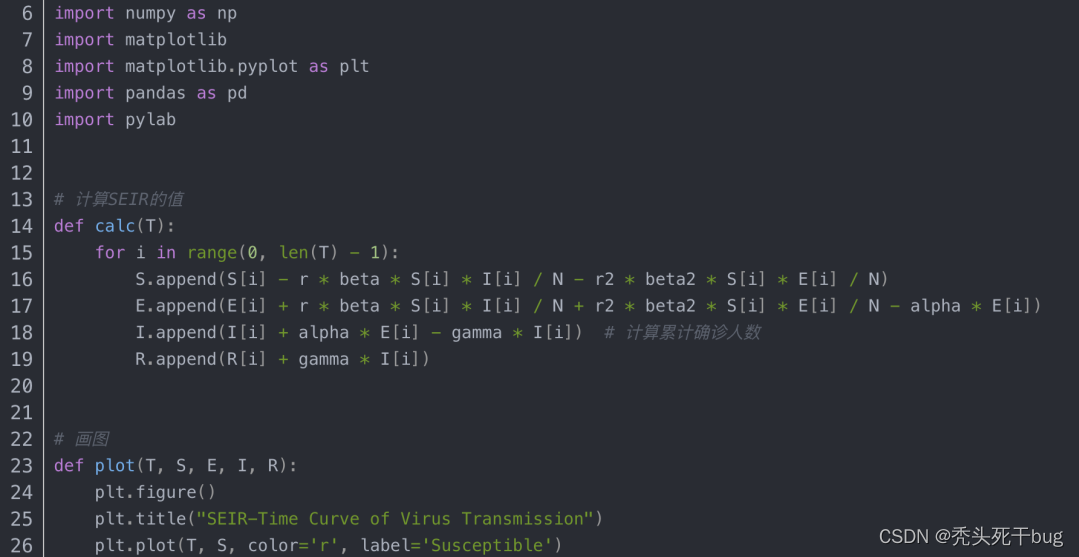
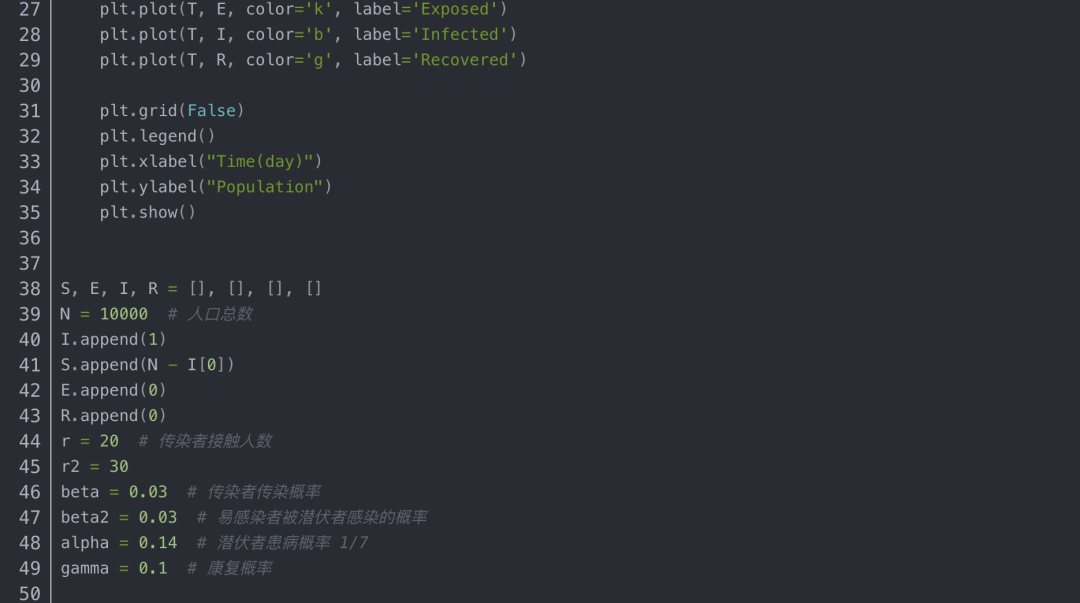
SEIR model code

An online SEIR model visualization platform
COVID-19 epidemic development prediction based on GNN
Code:
If you need the source code, please chat with the blogger privately. The blogger will reply after seeing it.
Thanks for the likes and attention!