K-line chart
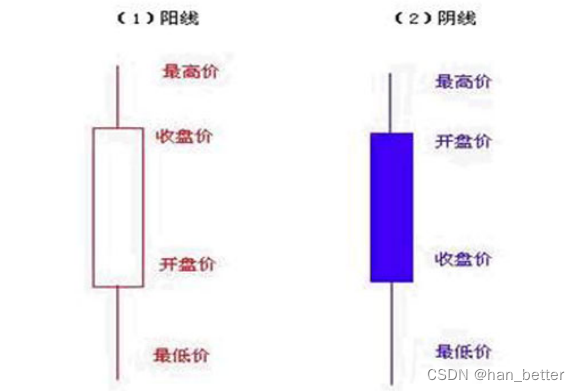
The K-line chart is a chart that reflects the price fluctuations within a certain time period. It consists of four elements: opening price, closing price, highest price, and lowest price. If the closing price of the day is higher than the opening price, it indicates that the price is rising. , at this time, the K-line chart is mostly represented by red; if the closing price of the day is lower than the opening price, it indicates that the price is in a downward state, and at this time, the K-line chart is mostly represented by black or green.
Dayang line
Description of the shape and characteristics of the big Yang line
The big positive line is a common K-line in the stock price chart (as shown in the picture). The big positive line technically indicates that the long side is strong, the buyer has an absolute advantage, and the short side has no resistance.
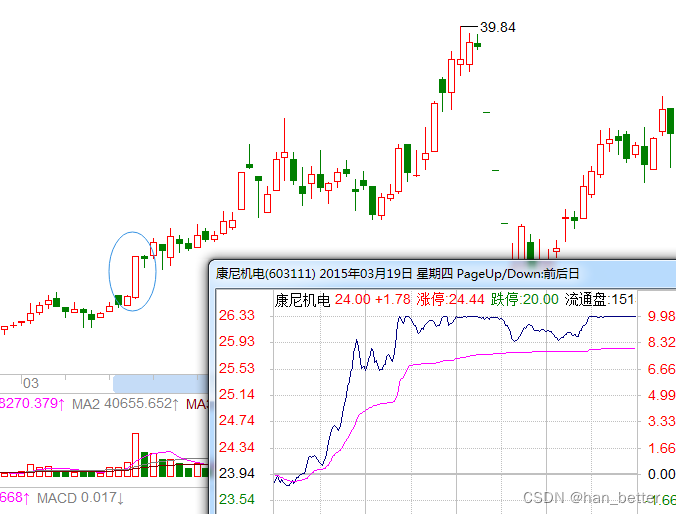
The characteristics of the big Yang line are: it may appear no matter what the stock price is; the Yang line entity is relatively long and can have a slight upper and lower shadow line; the longer the Yang line entity is, the stronger the multi-party power is, and vice versa, the weaker the power; Under the daily limit system, the largest daily Yang line entity can reach 20% of the opening price of the day, that is, it opens with the lower limit and closes with the higher limit.
The big positive line shows that the buyer will actively attack from the beginning of the market, and there may also be a struggle between the buyer and the seller in the middle. However, the buyer exerts its greatest strength and always has the advantage, causing the stock price to rise all the way until the close. In addition, the big positive line also shows that the rising trend is strong, the stock market is reaching a climax, and buyers are rushing in crazily, buying without price limit. Those who hold stocks are unwilling to sell because they see strong buying momentum, and the supply of stocks on the market exceeds demand.
Key points for operating the Dayang line
1. If a big positive line is pulled out when the stock price just starts to rise, it indicates that the stock price may rise faster, and investors can buy; if a big positive line appears during the continuous rise of the stock price, be careful that the energy of many parties may have been exhausted. If the stock price continues to fall, the stock price may peak and fall; if a big positive line appears during the continuous decline of the stock price, it indicates that the stock price has bottomed out and rebounded. At this time, we can buy in moderation on dips.
2. Analyze the combination changes based on the trend after the single-day big positive line, which can be roughly divided into the following two types.
(1) The gap after the big positive line
After the stock price closed the big positive line of more than 5% that day, it jumped short and opened lower the next day. This trend was to clean up the chips of the previous day's big positive line in order to continue the upward attack. Investors should pay attention to the strength and depth of the retracement. The so-called strength refers to the trading volume and the time of the retracement. The loosening of chips can be judged by the trading volume; the depth refers to the price gapping and opening low to cut into the big positive line. The position is generally 1/3, 2/3, or 1/2; ideally it is within 1/3, which is a strong feature.
(2) Jump in the air and attack directly
This is the strongest trend, indicating that the long and short forces have undergone essential changes, and investors should follow up in time. The intervention point is best not to exceed 3% of the previous day's closing price. Specifically, as long as the second K-line after the big positive line, or the several K-lines after this, run above the closing price of the big positive line, you can consider buying and actively go long.
3. In the early or mid-stage of an upward trend, especially when it breaks through a key position, the appearance of a big positive line indicates that bulls have begun to launch an attack, and the stock price is more likely to continue to rise in the future. However, if the stock price is already at a high level and a big positive line appears, it indicates that the long momentum is gradually exhausted. It may also be that the bulls are deliberately raising the stock price significantly, creating the illusion of a strong upward move and tempting retail investors to take over. If a large positive line is closed at a high level, it is more likely to be a bull trap, and we must learn to treat it differently.
Zhongyang
Line Shape and Characteristic Description of Zhongyang Line
The real part of Zhongyang line is slightly shorter than that of Dayang line. It is generally believed that the Yang line pulled out when the stock price rises by 3%-5% and the Yang line pulled out when the market rises by 1%-3% are Zhongyang lines.
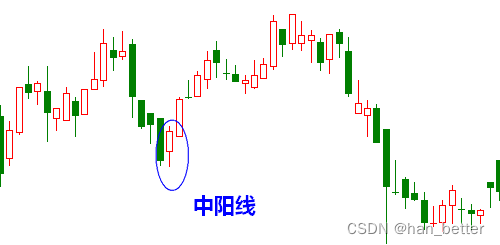
The appearance of the Zhongyang line shows that after a day's battle between the bulls and the shorts, the bulls have not pushed up the price as much as when there was a big Yang line, and the advantages held by the bulls are not as great as when there was a big Yang line. It can only be said that the bulls have a clear advantage.
Zhongyang line often appears near the intersection between the end of consolidation and the beginning of the stock price rise, during the rise of the stock price, and during the strong rebound after the stock price fell sharply. It shows that the buyer has the advantage and gives the seller a powerful counterattack. The seller suffers a great setback in this situation.
Key points of Zhongyang line operation
1. When the Zhongyang line appears in a rising market, it means that the market will continue to rise.
2. When the Zhongyang line appears in a falling market, it means that the market will rebound upward.
3. If the Zhongyang line appears in a continuously fluctuating and rising trend throughout the day, it often indicates that the stock price will still have a good development trend the next day.
4. If the Zhongyang line is formed due to a sudden rise in late trading, investors need to beware of a possible correction the next day.
small positive line
Description of the shape and characteristics of the small positive line
The small positive line refers to the small positive line with a small fluctuation range between the opening price and the closing price, indicating that the bulls have a slight upper hand, but the upward attack is weak and the market development is confusing.
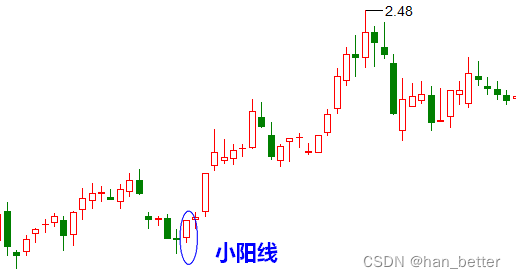
If the shadow line of the small Yang line is long at the top and short at the bottom or short at the top and long at the bottom, it indicates that the long and short parties have conducted a small confrontation to digest profits and unwind arbitrage. The original trend will generally continue. If the above situation occurs continuously or If a positive line with increased trading volume appears the next day, investors can follow up and buy the stock, and the stock price will surely rise for a while.
Key points for operating Xiaoyang line
1. The small positive line with shorter upper and lower shadow lines indicates that although there is a certain amount of selling pressure in the market at this time, the bulls are not showing weakness, and both parties are trying to find a dynamic balance.
2. A small positive line with a relatively long upper shadow line generally indicates that the selling pressure from the short side is still heavy at this time, but the support from the long side is not small. Investors need to pay close attention to the changes in the strength of both parties. It should be particularly pointed out that sometimes the long upper shadow line is not necessarily real selling pressure. In order to create a certain atmosphere or to cover up some of their own intentions, the main force will often deliberately draw pictures and artificially control the trend of the stock price. , creating an illusion for investors.
3. The small positive line with a relatively long lower shadow indicates that the support of the bulls is strong at this time. Although the real body is not long, the long lower shadow has shown that the bulls are trying to do something at this time. The specific connotation It needs to be analyzed in conjunction with the overall trend.
big negative line
Description of the shape and characteristics of the big negative line:
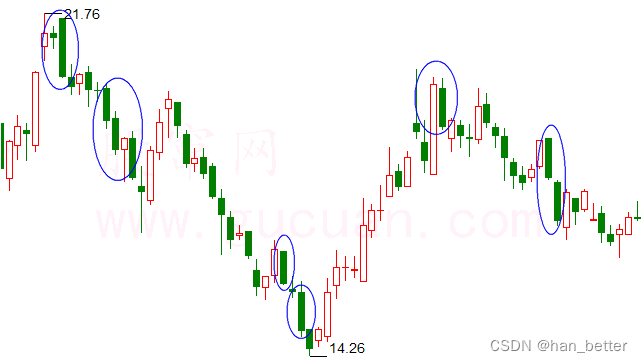
The big Yinxian is also called the Long Yinxian. It means that the stock price almost opened at the highest price and closed at the lowest price that day. The bulls were retreating steadily under the pressure of the short parties, and they were unable to resist.
The characteristics of the big negative line are: it may appear no matter what the stock price is in; the negative line entity is relatively long and can have a slight upper and lower shadow line; the longer the negative line entity is, the stronger the power is, and vice versa; in the daily limit system Below, the largest daily negative line entity can reach 20% of the opening price of the day, that is, it opens with the upper limit and closes with the lower limit.
The basic graphics of the big Yinxian are shown in the figure below.
Key points for operating the Yinxian line:
1. The big negative line appears after a period of rising trend, especially after a large increase. It means that the stock price is about to fall back or is making a head. At this time, investors should sell the stock.
2. If the big negative line appears after a large decline, it means that the energy of the short side has been released almost. According to the principle of "the extremes of things must reverse", investors should consider going long and absorbing dips at this time.
3. Classification of big Yinxian. The big negative line is divided into the following types:
(1) The big negative line at the top. The big negative line at the top usually appears at the end of an upward trend. It is the result of short sellers defeating bulls at a high price or the main force of bulls shipping. It is often accompanied by an increase in trading volume. If this big negative line forms a certain K-line combination with its previous K-line, it will be a top reversal signal.
(2) Break through the big negative line. It is often accompanied by a gapping trend, which is what people often call the "iconic negative K-line", which will lead to the reversal of the moving average family, thus starting a new downward trend opposite to the original upward trend.
(3) Accelerate the big negative line. The accelerating negative line generally appears on the way to a downward trend, which not only promotes the downward trend, but also verifies the downward trend.
(4) Big negative line at the bottom. The big negative line at the bottom often appears in the acceleration period at the end of a long downtrend with a huge decline. Generally it is not suitable to use it alone as the basis for judging the bottom. It is best to get confirmation from the next K line.
Bardo line
Bardo line shape and characteristics description
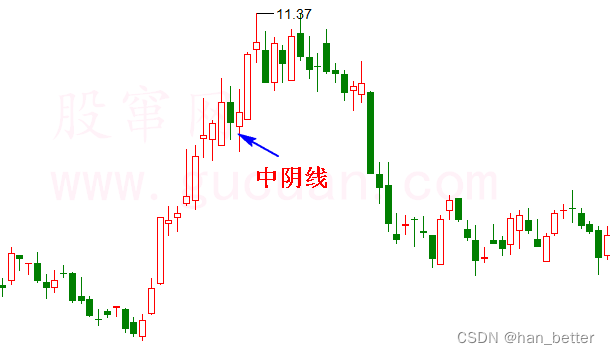
The appearance of the barren line indicates that the range of stock price fluctuations throughout the day has increased significantly, the seller has the upper hand, and the market is developing in a direction that is favorable to the seller. The fluctuation range of the Yin line is 1.6%-3.5%
The bardo line often appears in the early stages of a stock price decline or when it rises and reverts, and it has strong lethality. It means that the buyer was severely hit that day. The buyer was helpless in the face of the seller's powerful offensive and was retreating steadily. When encountering this kind of K-line, investors should treat it with caution and take corresponding measures to protect their profits.
Key points of barcode line operation
1. The barcode line generally appears in three periods: first, the decline after the top is established, second, the powerful washout on the way up, and third, the decline at the end of the mid-term adjustment.
2. Reject the bardo line. Nowadays, washing dishes is done more and more like tops, and tops are doing more and more like washing dishes. To correctly distinguish between the two requires certain technical skills, otherwise you will either lose money or become rich on paper.
3. The middle Yin line at the top is relatively easy to avoid, while the middle Yin line of the market wash is more difficult to judge. When people are unanimously optimistic, it will appear unexpectedly. In fact, for mid-line stock traders, it is not very important whether they can avoid the negative line of the market wash. As long as they come out in time at the top, they can still make a lot of profits. People who can avoid the negative line of the market wash are mostly experts, and it is difficult for ordinary retail investors to avoid it.
small negative line
Description of the shape and characteristics of the small negative line
The small negative line refers to a small K-line with a small fluctuation range between the opening price and the closing price. The upper and lower shadow lines sometimes disappear, and even if they do exist, they are very short.
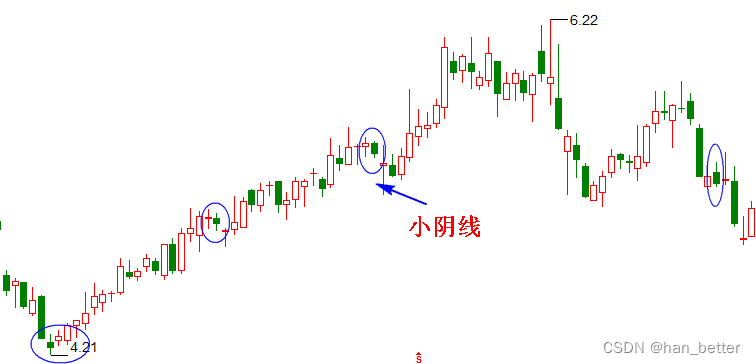
The small negative line indicates that the short side is suppressing, but the intensity is not strong. If it appears after the big positive line, it indicates that the short side is weak and the market outlook can be determined.
The small negative line mostly appears in the consolidation market, but can also appear in the rising or falling market, indicating that the current market is unclear.
Key points of small Yinxian operation
1. The small negative line shows that the long and short sides are in careful contact, but the short side has a slight upper hand.
2. A single small negative line has little effect on identifying the market direction, but if multiple small negative lines appear continuously in a downward trend, then these small negative lines will play a role in assisting the decline. When the market is in a downward trend, there will be multiple consecutive small negative lines.