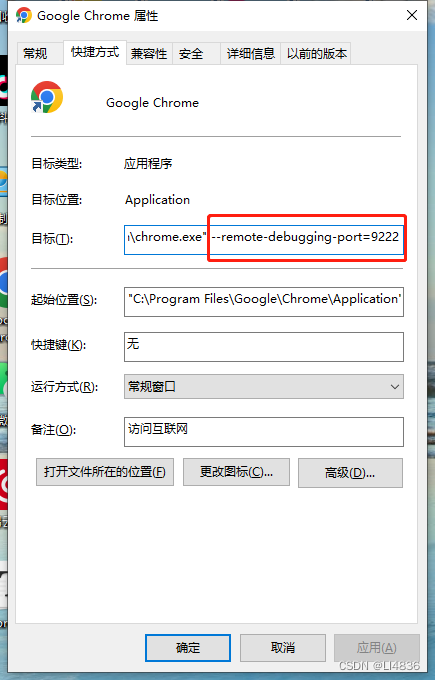
- Open the browser's remote debugging
Chrome browser shortcut, right-click and select "Properties", add in the target column--remote-debugging-port=9222, the following ports can be defined by yourself, and start the browser after completion.
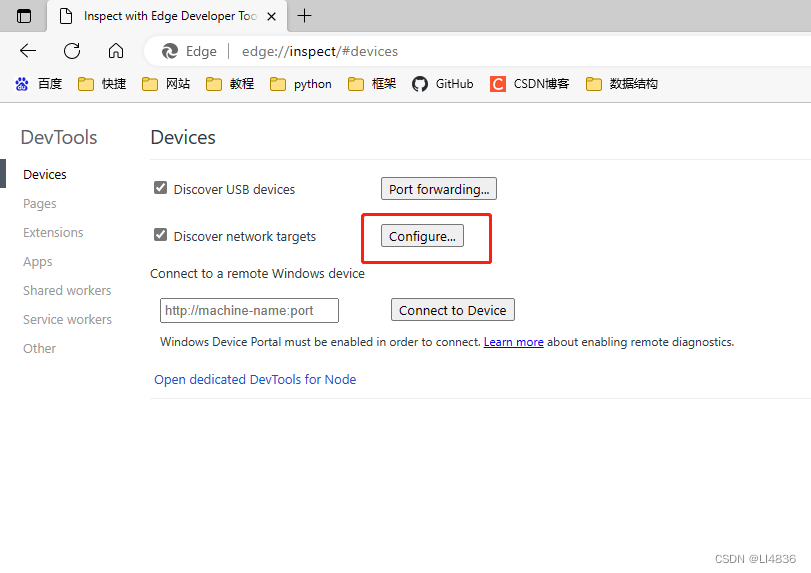
- Let's test it with another browser.
Open the new version of edge browser and enter it in the address baredge://inspect/#devices. If it is chrome, you need to enter it.chrome://inspect/#devices
By default, the remote machine list is empty. By default, only pages opened by the browser are allowed to be debugged. The remote ones need to be added by ourselves. Click Configure to add a remote machine.
Fill in the IP address and port in the pop-up window. Because it is the local machine, fill in localhost directly. You can also fill in the remote address.

ClickDoneto return to the previous page, wait or refresh to see the page opened by the browser being debugged.

Chrome browser remote debugging
Guess you like
Origin blog.csdn.net/LI4836/article/details/130045294
Recommended
Ranking