1. Introduction to Spatial Interpolation
Spatial interpolation is often used to convert the measurement data of discrete points into a continuous data surface in order to explore the distribution pattern of spatial phenomena. This method is usually used to analyze regional environmental pollution, regional precipitation, regional climate change, resource utilization, and public infrastructure. influence effect etc. Spatial interpolation methods are divided into two categories: one is deterministic methods, and the other is geostatistical methods. Deterministic interpolation methods are based on the similarity between information points or the smoothness of the entire surface to create a fitting surface, such as inverse distance weighted average interpolation (IDW), trend surface method, spline function method, etc. The geostatistical interpolation method is to use the statistical laws of sample points to quantify the spatial autocorrelation between sample points, so as to construct a spatial structure model of sample points around the points to be predicted, such as Kriging interpolation method . The characteristic of the deterministic interpolation method is that the interpolation result at the sample point is basically consistent with the actual value of the original sample point. If the non-deterministic interpolation method is used, the interpolation result at the sample point is not necessarily consistent with the actual value of the sample. Some Very different. In the actual GIS application process, it is often necessary to choose different interpolation methods according to actual needs and comprehensively consider factors such as interpolation accuracy and efficiency. Here we focus on the inverse distance weighting, spline function and Kriging interpolation method.
(1) Inverse distance weighting (IDW)
One of the most commonly used spatial interpolation methods in GIS is the inverse distance weighting method, which uses the distance between the interpolation point and the sample point as the weight of the interpolation method. The closer the interpolation point is, the greater the weight is given to the sample point, and its weight contribution inversely proportional to distance. Can be expressed as:
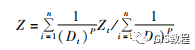
Where Z is the estimated value of the interpolation point, Zi (i = 1, 2, 3, ,,,) is the measured sample value, n is the number of measured samples involved in the calculation, Di is the distance between the interpolation point and the i-th station, p is the power of the distance, which significantly affects the interpolation result, and its selection criterion is the minimum mean absolute error.
(2) Spline function interpolation method
The spline function is a piecewise function, and only a few points are fitted for one fitting, while ensuring that the joints of the curve segments are continuous, which means that the spline function can modify the registration of a few data points without having to recalculate the entire curve. Some disadvantages of spline function are: the error of spline interpolation cannot be directly estimated, and at the same time, the problem to be solved in practice is the definition of spline blocks and how to assemble these "blocks" into complex surfaces in three-dimensional space without Introduce problems such as anomalies that were not present in the original surface.
(3) Kriging interpolation method
Kriging is an important part of geostatistical interpolation in GIS software. This method fully absorbs the idea of geographic statistics, and believes that any attribute that changes continuously in space is very irregular and cannot be simulated by simple smooth mathematical functions, but can be described more appropriately by random surfaces. This continuously changing spatial attribute is called "regional variable", which can describe variables such as air pressure, elevation and other continuously changing descriptive indicators. Geostatistical methods provide an optimization strategy for spatial interpolation, that is, dynamically determine the values of variables according to some optimization criterion function during the interpolation process. The Kriging interpolation method focuses on the determination of the weight coefficients, so that the interpolation function is in the best state, that is, it provides the best linear unbiased estimate of the variable value at a given point.
There are seven types of kriging methods in GIS, and the following table shows the names and scopes of the seven methods:
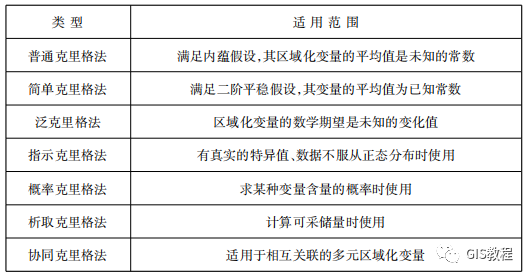
The advantage of the Kriging method is that spatial statistics are its solid theoretical basis, which can overcome the problem of difficult analysis of errors in interpolation, and can make point-by-point theoretical estimates of errors; not only can it estimate the spatial variation distribution of measured parameters, It is also possible to estimate the variance distribution of the estimated parameters. Its disadvantage is that the calculation steps are cumbersome and the amount of calculation is large, and the variation function sometimes needs to be selected artificially based on experience.
GIS Massive Data, Resources, and Tutorials: Tree Valley Database Encyclopedia (Updated on August 16, 2023)