Table of contents
1 EXCEL can be used for hypothesis testing
1.1 How to open Data Analysis and Solver
1.2 Preliminary knowledge about normal distribution in EXCEL
2.1 The most basic hypothesis test, one-sided Z test
2.1.2 Some assumptions need to be met before the F test
2.1.5 How to analyze the results of F-check
2.5 Analysis of variance (one-way ANOVA)
1 EXCEL can be used for hypothesis testing
- Hypothesis testing in Excel
- But you need to open the add-in for data analysis

1.1 How to open Data Analysis and Solver
-
Start ----- Options ----- Add-ins
-
In the add-in, select Data Analysis & Planning Solver

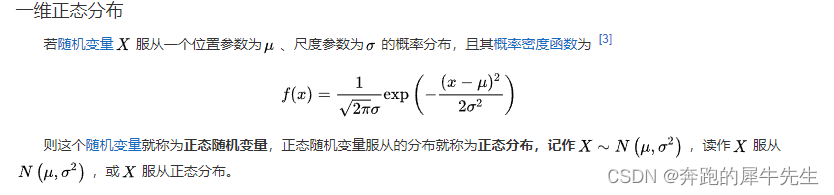
1.2 Preliminary knowledge about normal distribution in EXCEL
- normal distribution,
- Normal distribution curve, the horizontal axis is x, and the vertical axis is the probability p
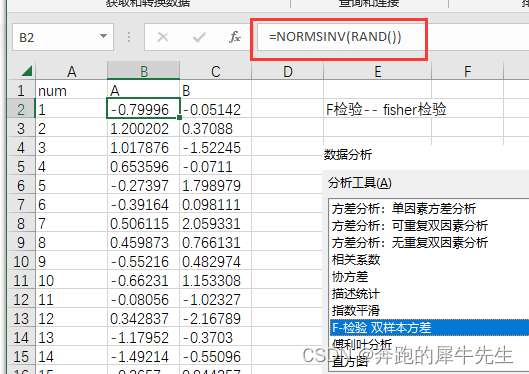
- And normsinv is the inverse function of the normal distribution, and the value of the independent variable can be calculated according to the probability
- Function normsinv()
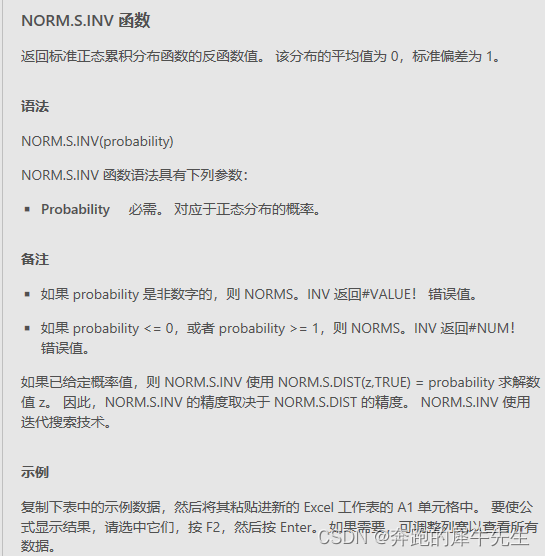
- Function norm.s.inv()
- Function norm.s.dist()
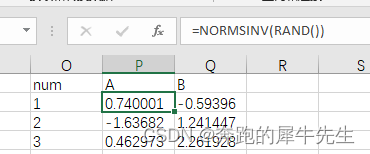
- The function is to use normsinv(rand()) or normsinv(rand()) in EXCEL to generate some data that conforms to the normal distribution.
- If there are inverse functions of other distributions, it is theoretically possible to generate data conforming to other distributions.

2 Basic Hypothesis Testing
2.1 The most basic hypothesis test, one-sided Z test
2.2 Two-sample F test
- The most commonly used should be used to compare whether there is a significant difference between the means of two or more groups.
- Null hypothesis: Generally, it is considered to be consistent, there is no difference and other naive assumptions
- The null hypothesis of the F-test is that all differences between groups are due to chance. In other words, the null hypothesis states that the means between the groups are not significantly different.
- The principle of the F test is that if there are significant differences between the means or other statistics between two or more groups, the inter-group variance will be larger, while the intra-group variance will be larger. variance ) is smaller.
- Therefore, F value = variance between groups/variance within Σj group, if the F value is larger, it proves that variance between groups >> variance within groups
- P value = probability (F value ≥ actual F value | null hypothesis), that is, the smaller the p, it proves the null hypothesis - the probability of believing that the variance is the same/the expectation is the same is very small, not caused by observation, but caused by other reasons.
Refer to the following documents
2.2.1 Examples

2.2.2 Some assumptions need to be met before the F test
- The samples are drawn randomly, that is, the observations in each group are independent.
- The sample is a population from a normal distribution.
- Each group should have an equal sample size
2.2.3 Calculation steps
- It is necessary to calculate the average value of the three sets of data,
- The average is equal to the sum of all numbers divided by the number of data.
- Then calculate the within-group variance and the between-group variance.
α (alpha) is the degree of significance
intra-group variance
- Using the sample variance formula, the variance within a group is equal to the sum of the squares of the difference between each data and the mean of the group it is in divided by (the number of data in the group - 1).
- Because the sample size of each type of data must be the same, i is the same
- u1,u2 ... ... are the averages for each group
- The average is the simplest arithmetic mean, u1=(x1+x2+....+xi)/i
- For example, the variance within the first group, δ^2=((u1-x1)^2+(u1-x2)^2+....++(u1-xi)^2)/(i-1)
- For example, the variance within the second group, δ^2=((u2-x1)^2+(u2-x2)^2+....++(u2-xi)^2)/(i-1)
Inter-group variance
- Using the sample variance formula, the between-group variance is equal to the sum of the squares of the difference between each data point and the mean of the group it is in divided by (number of groups - 1).
- U is the sum of multiple sets of data = the average of all data
- Suppose there are j sets of arrays
- set difference, δ^2=((U-u1)^2+(U-u2)^2+....++(U-uj)^2)/(j-1)
F value
- F = between-group variance divided by the sum of within-group variance.
- F= Variance between groups / Σj Variance within groups
- Then look up the table, the k1 degree of freedom between groups is equal to the number of groups minus 1, and the k2 degree of freedom within a group is equal to the number of each group minus the number of groups.
- In the example below, k1=2-1, k2=30-2=28
- If the F value is the F value obtained by looking up the table, it means that the difference is significant, otherwise it means that the difference is not significant.
The calculation formula of P value is as follows:
- P value = probability (F value ≥ actual F value | null hypothesis)
- Among them, the null hypothesis is that all differences between groups are due to chance. Through calculation, the P value can obtain a probability value, which indicates the probability of observing such an extreme result (that is, the F value is greater than or equal to the actually observed F value) under the null hypothesis.
- Usually, a P value less than 0.05 is considered statistically significant, that is, we have 95% confidence that the existence of the difference in the sample data is not caused by chance, but due to experimental factors or other factors.
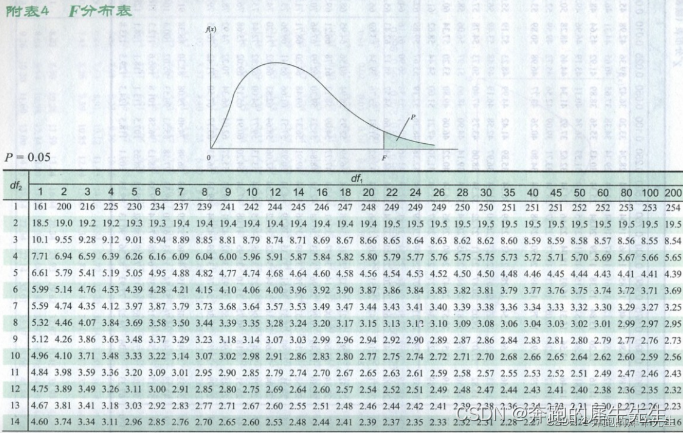
2.2.4 How to look up the table: The following figure is the F value table with a significance of a=0.05 : F0.05(1,28) =4.2
- k1, degrees of freedom between groups = j-1 =2-1 =1
- k2, degrees of freedom within the group = ij =30-2 =28
- Looking up the table, the F value is 4.2
- That is, F0.05(1,28) =4.2


2.2.5 Significance of indicators
- In the F-test, the p-value refers to the probability that, for a given data set, the calculated difference between all groups is due to chance when performing analysis of variance.
- Specifically, the smaller the p-value, the more significant the difference between the data sets, the more reason to reject the null hypothesis (that is, the difference between all groups is due to chance), and accept the alternative hypothesis (that is, there is a significant difference ). In other words, when the p-value is less than 0.05, we can be 95% confident that the difference in the sample data is not due to chance but due to experimental factors or other factors.
- It should be noted that a p value of less than 0.05 only indicates that the difference is significant, but it does not indicate whether the difference has practical significance or importance. Therefore, when performing statistical inference, in addition to p-values, other factors, such as effect size and sample size, need to be considered to more fully evaluate the results of the data.
- The F value indicates the significance of the entire fitting equation, and the larger the F, the more significant the equation and the better the fitting degree.
- In addition, the F value is generally not looked at in statistical interpretation, only the P value is enough, but when writing a paper, the F value should be written out, and the P value should be enclosed in parentheses
2.2.6 How to analyze the results of F-check
The result is as follows
- Because this is a two-sample ANOVA for the F-test
- p=0.48> 0.05 significant degree, indicating that there is no significant difference in variance between the two, that is, homogeneity of variance
- Then select the t test in the analysis tool: double-sample equal variance assumption

2.3 Reverse verification results
Because the data is generated by me with normsinv(), it must conform to the normal distribution, so I plan to use these data to reverse verify the rationality and reliability of the F test.

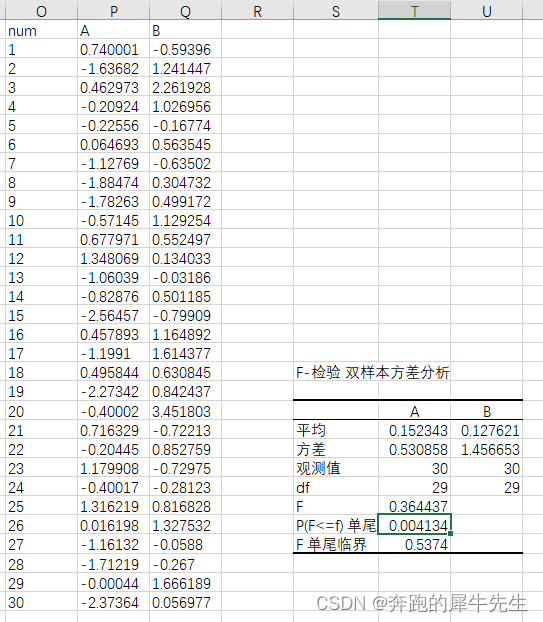
2.3.1 Create 2 normal data with offset
- two columns of data
- Column 1 is standard normal data
- Column 2 is standard normal data + 0.5
- p=0.004<0.05, indicating that the variance is significantly different