1. Python environment construction and configuration
As an excellent programming language, Python is favored by many programmers and programming enthusiasts. In recent years, Python has also flexed its muscles in the office field, and many white-collar workers have joined the ranks of learning Python. This is because Python has unique advantages in data collection, processing, analysis and visualization, and can help professionals calmly cope with the challenges of the big data era.
To write and run Python code, you need to build a Python programming environment on your computer and install related third-party modules.
1. Building a Python programming environment
Use Anaconda and PyCharm to build a Python programming environment.
Anaconda is a release version of Python. Installing Anaconda is equivalent to installing Python, and it also integrates many third-party modules for big data analysis and scientific computing, such as NumPy, pandas, Matplotlib, etc.
PyCharm is a Python code editor, which is better than the two editors that come with Anaconda, Spyder and Jupyter Notebook.
Let's learn how to download, install and set up Anaconda and PyCharm together.
1. Install and configure Anaconda
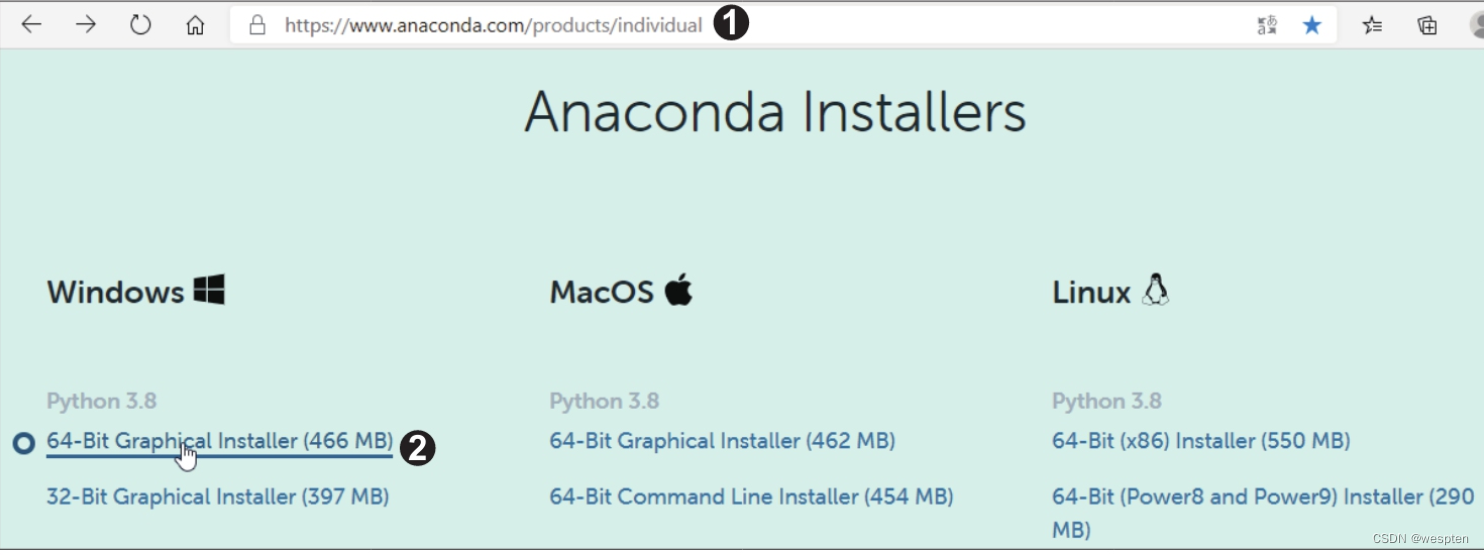
Step 1: Open the URL in your browser
https://www.anaconda.com/products/individual, enter the Anaconda download page, scroll down the page, in the "Anaconda Installers" column, you can see the installation packages corresponding to different types of computer operating systems, select applicable here Python 3.8 version on 64-bit Windows system, as shown in the figure below.
If the official website download speed