Matlab data acquisition, preprocessing, statistics, visualization, dimensionality reduction
Data Preprocessing - MATLAB & Simulink - MathWorks China  https://ww2.mathworks.cn/help/matlab/preprocessing-data.html
1. Data acquisition
1.1 Get from Excel
use readtable()
Example 1:
Use spreadsheetImportOptions (Name, Value) to initially determine the import information,
Then add it in the format of opts.Name=Value .
%    工作簿: C:\Users\Hao\Desktop\程序_MATLAB数学建模方法与实践_卓金武等\Cha2\sz000004.xls
%    工作表: Sheet1

%% 设置导入选项并导入数据
opts = spreadsheetImportOptions("NumVariables", 8);%变量数8
%spreadsheetImportOptions允许指定 MATLAB® 如何从电子表格文件中导入表格数据

% 指定工作表和范围
opts.Sheet = "Sheet1";
opts.DataRange = "A1:H45";

% 指定列名称和类型
opts.VariableNames = ["Date", "DateNum", "Popen", "Phigh", "Plow", "Pclose", "Volum", "Turn"];
opts.VariableTypes = ["double", "double", "double", "double", "double", "double", "double", "double"];

% 导入数据
sz000004 = readtable("C:\Users\Hao\Desktop\程序_MATLAB数学建模方法与实践_卓金武等\Cha2\sz000004.xls", opts, "UseExcel", false);


%% 清除临时变量
clear opts
Example 2:
First initialize the spreadsheetImportOptions object,
Then use the format of opts.Name=Value to add one by one.
% 初始化 SpreadsheetImportOptions 对象
opts = spreadsheetImportOptions;

% 指定变量名称
opts.VariableNames = 'LastName';

% 变量类型
opts.VariableTypes = 'categorical';

% 数据起始单元格
opts.DataRange = 'A2';

% 使用导入选项预览文件中的八行数据
preview('patients.xls',opts)
oneVar = readtable('patients.xls',opts);
% 列出变量及大小和类型
whos oneVar
Example 3:
Store the import information in a variable,
Then use spreadsheetImportOptions (Name, Value) to add import information.
% 变量数
numVars = 7;
% 变量名称
varNames = {'LastName','Gender','Age','Location','Height','Weight','Smoker'} ;
% 变量类型
varTypes = {'char','categorical','int32','char','double','double','logical'} ;
% 数据起始单元格
dataStartLoc = 'A2';

% 使用 spreadsheetImportOptions 函数和变量信息初始化导入选项对象 opts
opts = spreadsheetImportOptions('NumVariables',numVars,...
                                'VariableNames',varNames,...
                                'VariableTypes',varTypes,...
                                'DataRange', dataStartLoc);

% 使用导入选项预览文件中的八行数据
preview('patients.xls',opts)
% 使用 readtable 导入数据
T = readtable('patients.xls',opts);
% 列出变量及大小和类型
whos T
注:readtableOnly the following name-value pairs are supported:
Text and spreadsheet parameters -
ReadVariableNames,ReadRowNamesText parameters only -
DateLocale,EncodingSpreadsheet parameters only -
Sheet,UseExcel
Use xlsread() --xlswrite()
a=xlsread('C:\Coporation_evaluation.xlsx',2,'A2:I16')

% 'C:\Coporation_evaluation.xlsx' 表示读入Excel数据所在位置

% 2 表示位于sheet2

% 'A2:I16' 表示读入的数据范围


a=xlswrite('C:\Coporation_evaluation.xlsx',a,3,'B1:C5')

% 'C:\Coporation_evaluation.xlsx' 表示写入Excel工作簿所在位置,若不存在会自动创建

% a 表示待写入的数据

% 3 表示sheet3

% 'B1:C5' 表示写入Excel中的的具体位置
[data,textdata] = xlsread('D:\Desktop\xx.xls'), what is read
- Read data from the Excel file with file path
D:\桌面\xx.xlsand store the data into two variablesdataandtextdata.- Among them,
xlsread()is the built-in function of MATLAB, which is used to read the data in the Excel file.- The first input parameter
'D:\桌面\aa.xls'indicates the full path of the Excel file, which can be modified according to the actual situation.- If the second parameter is empty, the function reads all numeric data by default; if you specify the second output parameter name (as in this example
textdata), the function will store the text data in the Excel file into the variable.
Suppose we have an Excel file with a file path of D:\桌面\data.xlsx, which contains the following data:
| A | B | C | |
| 1 | 10 | 20 | a |
| 2 | 30 | 40 | b |
Then, we can use the following MATLAB code to read the numeric and text data in this file:
[data, textdata] = xlsread('D:\桌面\data.xlsx');
After executing the above code, MATLAB will store the numerical data in the Excel file into datathe variable, and store the text data into textdatathe variable. At this point, you can enter these two variable names in the MATLAB command window to view their contents:
data =

    10    20
    30    40

textdata =

  2×1 cell 数组

    {2×1 cell}
    {2×1 cell}

>> textdata{1}

ans =

    'a'

>> textdata{2}

ans =

    'b'
- It can be seen that MATLAB has successfully read the data in the Excel file and stored it in the corresponding variable.
- Among them,
textdatathe variable is a 2x1 cell array, and each cell stores a column of text data. - We can use curly braces
{}to access the contents of the cell, such astextdata{1}accessing the text data in the first column.
1.2 Obtain from TXT
use load()
% 生成线性间距向量,返回包含 1 和 30 之间的 8(默认100)个等间距点的行向量

a=linspace(1,30,8);
save d:\exper.txt a -ascii;
b=load('d:\exper.txt')

% save d:\exper.txt a -ascii; 把a以ASCII码的形式存储在D盘的exper.txt中,若不存在会自动创建

% b=load('d:\exper.txt') 读取'd:\exper.txt'中的数据,并储存在变量b中
use textread()
[A,B,C,...]=textread('filename','format',N,'headerlines',M)

% filename 表示txt文件名称

% format 表示所读取变量的字段格式

% N 表示读取的次数

% headerlines 表示从第M+1行开始读取
Use literal reading to ignore matched characters https://blog.csdn.net/jk_101/article/details/106495696
[name,type,x,y,answer]=textread('D:t.txt','%s Type%d %f %n %s',2,...
                                'headerlines',1)

% 格式Type%d只显示%d,因为原数据为Type1,Type2,Type3,Type4
For example:
The first line of mydata.dat is as follows:
Sally Type1 12.34 45 YesRead the first line of the file, ignoring the characters Type in the second field.
[names, typenum, x, y, answer] = textread('mydata.dat', ...
'%s Type%d %f %d %s', 1)
return
names =
    'Sally'
typenum =
    1
x =
  12.34000000000000
y =
    45
answer =
    'Yes'
Use fopen() fread() fclose()
example:
Read the characters in the .m file (it is also possible to read the txt file)
% 用函数fopen打开文件,r代表只读形式打开,w代表写入形式打开,a代表在文件末尾添加内容

fid=fopen('D:\CRM4.m','r'); % fid=fopen('D:\CRM4.m','w')/fid=fopen('D:\CRM4.m','a')

% 以字符形式读取整个文本
var=fread(fid,'*char');

% 将中文字段转换为相应的2字节代码,否则输出可能会乱码
var=native2unicode(var)
fclose(fid)
Use fprintf() to write information to txt
fprintf('file','format',a1,a2...)

% file 表示文件路径

% format 表示数据写入类型

% a 表示要写入的数据内容
1.3 Get from the picture
%% 读取图片
clc, clear, close all
a1=imread('000.bmp');
% 获得像素矩阵行数列数
[m,n]=size(a1);

%% 批量读取图片
dirname = 'ImageChips'; % 'ImageChips'文件夹

files = dir(fullfile(dirname, '*.bmp'));

%% fuiifile用法
% f = fullfile('myfolder','mysubfolder','myfile.m')
% f = 'myfolder/mysubfolder/myfile.m'
%% dir用法
% dir name 列出与 name 匹配的文件和文件夹。如果 name 为文件夹,dir 列出该文件夹的内容。使用绝对
% 或相对路径名称指定 name。name 参数的文件名可以包含 * 通配符,路径名称可以包含 * 和 ** 通配符。
% 与** 通配符相邻的字符必须为文件分隔符。

a=zeros(m,n,19); % 创建全零数组19个m*n数组,共19张图片
pic=[];
for ii = 1:length(files)
  filename = fullfile(dirname, files(ii).name);
  a(:,:,ii)=imread(filename); % 将该图片信息读取到a的第ii个数组里
  pic=[pic,a(:,:,ii)]; % 拼接图像
end
double(pic);
figure
imshow(pic,[])

% imshow(I,[low high]) 显示灰度图像 I,以二元素向量 [low high] 形式指定显示范围

% 若为[],使用 [min(I(:)) max(I(:))] 的显示范围。换句话说,I 中的最小值是黑色,最大值是白色
1.4 Get from video
Use the VideoFileReader from the vision toolbox
%% 读取视频数据
% 从视频文件中读取视频帧、图像和音频样本

videoFReader = vision.VideoFileReader('vippedtracking.mp4');
% 播放视频文件
videoPlayer = vision.VideoPlayer;
while ~isDone(videoFReader)
% 当来自有限数据源的数据取完时(通常是因为已读取所有数据),isDone(obj)返回true
% ~逻辑非
  videoFrame = step(videoFReader); % 运行videoFReader算法,返回输出参数
  step(videoPlayer, videoFrame); % 对videoFrame运行videoPlayer算法
end
release(videoPlayer); %释放资源

%% 设置播放方式
% 重置播放器

reset(videoFReader) % 将图形对象属性重置为其默认值
% 增加播放器的尺寸
r = groot; % r = groot 用于存储图形根对象的句柄。要使用圆点表示法设置根属性,首先必须存储句柄
scrPos = r.ScreenSize;
%  Size/position is always a 4-element vector: [x0 y0 dx dy]
dx = scrPos(3); dy = scrPos(4);
videoPlayer = vision.VideoPlayer('Position',[dx/8, dy/8, dx*(3/4), dy*(3/4)]);
% 指定左下角和右上角的坐标
while ~isDone(videoFReader)
  videoFrame = step(videoFReader);
  step(videoPlayer, videoFrame);
end
release(videoPlayer);
reset(videoFReader)

%% 获取视频中的图像
videoFrame = step(videoFReader);
n = 0;
while n~=15
  videoFrame = step(videoFReader);
  n = n+1;
end
figure, imshow(videoFrame) % 获得第15张图像
release(videoPlayer);
Usage of fopen function in Matlab ![]() https://blog.csdn.net/jk_101/article/details/106494232
https://blog.csdn.net/jk_101/article/details/106494232
2. Data preprocessing
Three elements of data quality: accuracy, completeness, consistency (inconsistent formats, etc.)
Two influencing factors: credibility (how much users trust it), explainability (whether it is easy to understand)
Data type conversion ![]() https://zhuanlan.zhihu.com/p/217597511
https://zhuanlan.zhihu.com/p/217597511
Missing value handling:
| imputable method | method description |
| Mean/median/mode imputation | Depending on the type of attribute value, Use the mean/median/mode of the attribute values for imputation. |
| use fixed value | Replace missing attribute values with a constant. For example, the vacant value of the "basic salary" attribute of ordinary migrant workers in a factory in Guangzhou, You can use the salary standard of ordinary migrant workers in Guangzhou in 2015, which is 1895 yuan per month, The method is to use a fixed value. |
| nearest imputation | Find the closest sample in the record to the missing sample for this attribute value imputation |
| regression method | For variables with missing values, a fitting model is established based on the existing data and the data of other variables (dependent variables) related to it to predict the missing attribute values. |
| Interpolation | The interpolation method is to use known points to establish a suitable interpolation function f(x), The unknown value is approximately replaced by the function value f(x,) obtained from the corresponding point. |
Interpolation and Fitting
The difference and connection between interpolation and fitting
1. Contact
They are all based on a set of known data in practice to construct an approximate function that can reflect the law of data change.
2. Difference
The interpolation problem does not necessarily obtain the expression form of the approximate function, but only finds the value corresponding to the unknown point through the interpolation method.
Data fitting requires the expression of a specific approximation function.
interpolation method
Different types of interpolation functions are selected, and the approximation effect is different. Generally, there are:
( 1 ) Nearest neighbor algorithm interpolation (one-dimensional interpolation)
( 2 ) Lagrangian interpolation algorithm (one-dimensional interpolation)
( 3 ) Bilinear interpolation algorithm (two-dimensional interpolation)
( 4 ) piecewise linear interpolation (two-dimensional interpolation)
( 5 ) Cubic spline interpolation (two-dimensional interpolation)
( 6 ) Kriging interpolation (geography)
( 7 ) Inverse distance weight interpolation algorithm (geography)
- Matlab implementation: Realizing piecewise linear interpolation does not require programming of functions, it provides internal functions
- interp1 ( one-dimensional interpolation )
- interp2 ( two-dimensional )
- interp3 ( three-dimensional )
- intern (n dimension )
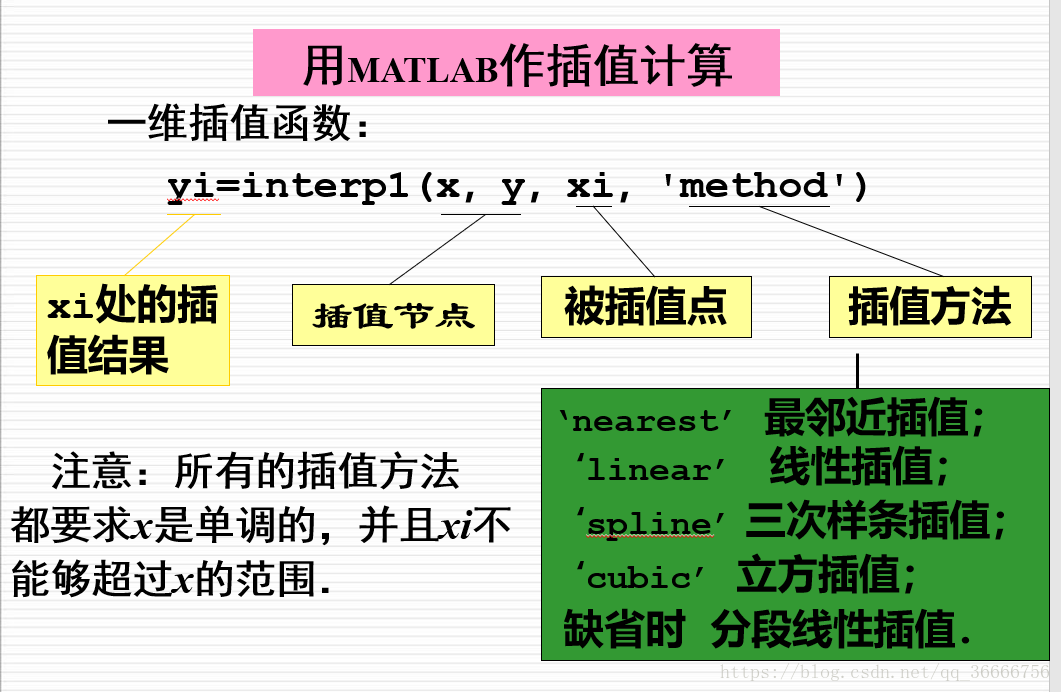
For example: within 11 hours from 1:00 to 12:00 , measure the temperature every 1 hour, the measured temperature values are: 5 , 8 , 9 , 15 , 25 , 29 , 31 , 30 , 22 , 25 , 27 , 24 . Try to estimate the temperature value every 1/10 hour.
hours=1:12;

temps=[5 8 9 15 25 29 31 30 22 25 27 24];

h=1:0.1:12;

t=interp1(hours,temps,h,'spline');

plot(hours,temps,'+',h,t,hours,temps,'r:')     %作图

xlabel('Hour'),ylabel('Degrees Celsius’)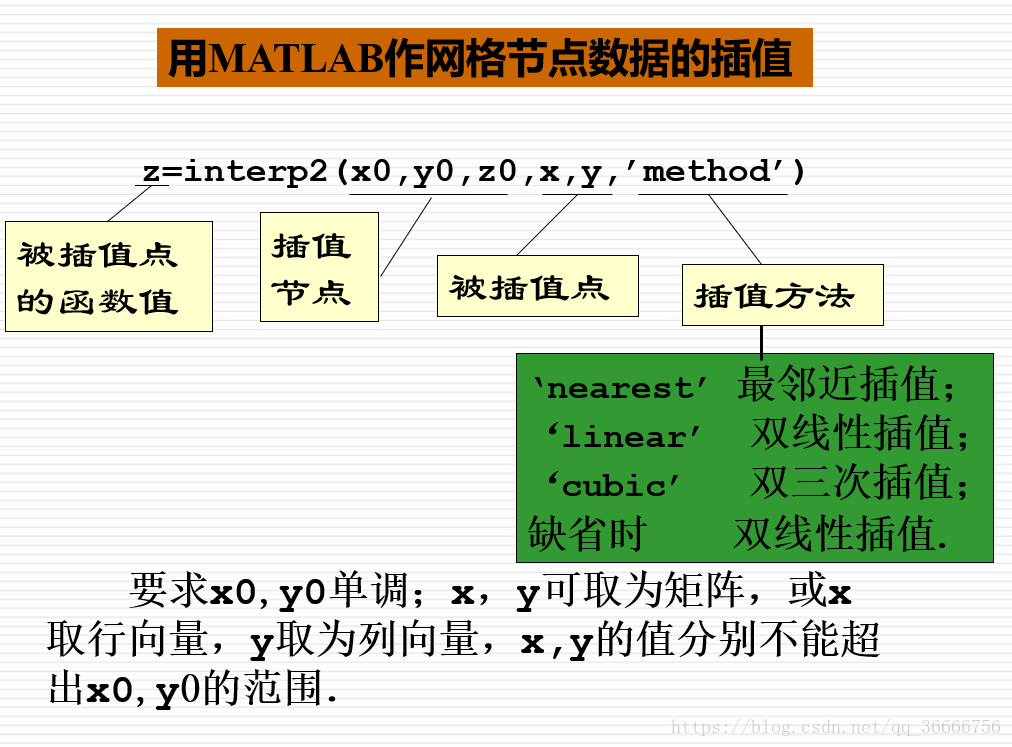
%1.先在三维坐标画出原始数据,画出粗糙的温度分布曲线图.

%输入以下命令:

x=1:5;
y=1:3;
temps=[82 81 80 82 84;79 63 61 65 81;84 84 82 85 86];
mesh(x,y,temps)

%2.以平滑数据,在 x、y方向上每隔0.2个单位的地方进行插值.

再输入以下命令:
xi=1:0.2:5;
yi=1:0.2:3;
zi=interp2(x,y,temps,xi',yi,'cubic');
mesh(xi,yi,zi)

%画出插值后的温度分布曲面图.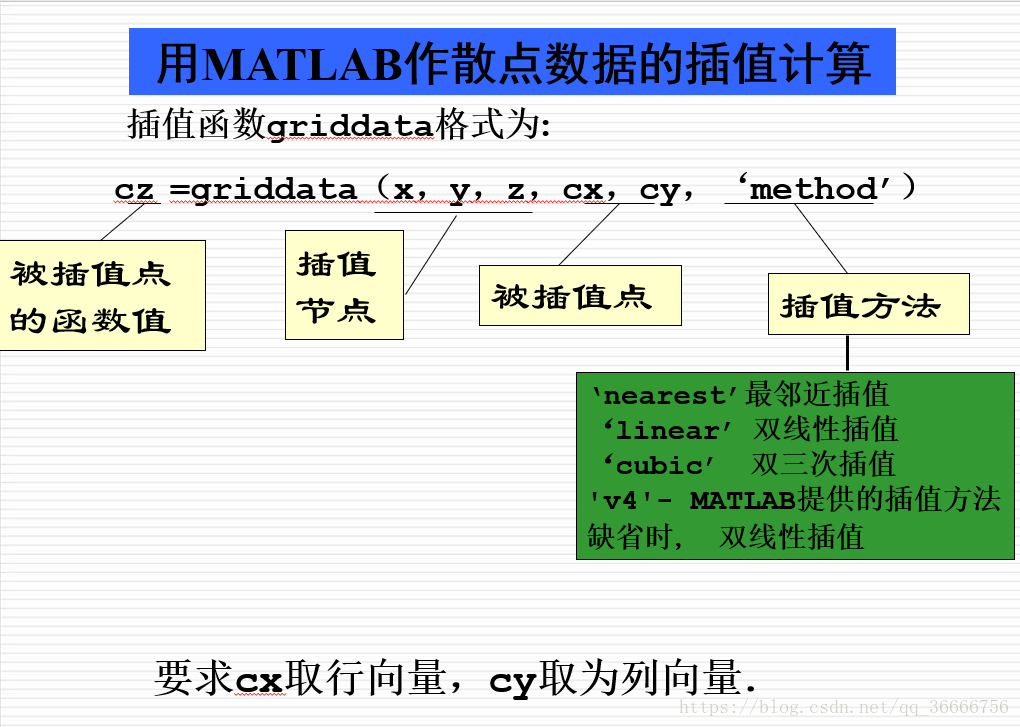
Example The water depth z at some points ( x , y ) measured in a certain sea area is given by the following table. The draft of the ship is 5 feet, which places are in the rectangular area ( 75 , 200 ) × ( -50 , 150 ) The boat should avoid entering.
%1.输入插值基点数据
%2.在矩形区域(75,200)×(-50,150)进行插值。
%3. 作海底曲面图
%4.作出水深小于5的海域范围,即z=5的等高线

%程序一:插值并作海底曲面图

x  =[129.0  140.0  103.5  88.0  185.5  195.0  105.5 157.5  107.5  77.0  81.0  162.0  162.0  117.5 ];

y =[ 7.5  141.5  23.0  147.0  22.5  137.5  85.5      -6.5  -81  3.0  56.5  -66.5  84.0  -33.5 ];

z =[ 4  8  6  8  6  8  8  9  9  8  8  9  4  9 ];

x1=75:1:200;

y1=-50:1:150;

[x1,y1]=meshgrid(x1,y1);

z1=griddata(x,y,z,x1,y1,'v4');

meshc(x1,y1,z1)


%程序二:插值并作出水深小于5的海域范围。

x1=75:1:200;

y1=-50:1:150;

[x1,y1]=meshgrid(x1,y1);

z1=griddata(x,y,z,x1,y1,'v4');  %插值

z1(z1>=5)=nan;   %将水深大于5的置为nan,这样绘图就不会显示出来

meshc(x1,y1,z1)
Outlier handling:
- Outliers are data that deviate from the majority of the data in the data set.
- From the data value, it is expressed as: the data in the data set deviates from the mean by more than two standard deviations,
- Data that deviates more than three standard deviations from the mean are called highly abnormal outliers.
Wavelet Outlier Extraction
Irregular parts such as mutation points and singular points of the signal usually contain important information, and the singularity of the general signal can be divided into two cases:
- The amplitude of the signal changes suddenly at a certain moment, causing the signal to be discontinuous. This type of mutation is called the first type of discontinuity point ;
- The signal is smooth in appearance, and the amplitude has no sudden change, but the first-order differential of the signal has a sudden change and the first-order differential is discontinuous. This type of sudden change is called the second type of discontinuity .
- Application of wavelet analysis can detect the position, type and magnitude of the mutation point in the signal.
Example: Detection of the first type of discontinuity
- In this example, the discontinuity of the signal is due to the sudden addition of a sinusoidal signal with high-frequency characteristics in the second half of the sinusoidal signal with low-frequency characteristics.
- First, the Fourier transform analysis is used to analyze the signal in the frequency domain, and it is found that there is no detected mutation point.
- Then use the wavelet analysis to analyze, the result proves that it can accurately detect the position of the sudden change of the signal amplitude, that is, the time point when the high-frequency signal is added.
load freqbrk;

x=freqbrk;%对信号进行傅里叶变换

f=fft(x,1024);

f=abs(f);

figure;

subplot(211);
plot(x);

subplot(212);
plot(f);

%使用db6小波进行6层

[c,l]=wavedec(x,6,’db6’);

figure(2);
subplot(811);
plot(x);
ylabel('x');

%对分解的第六层低频系数进行重构

a=wrcoef('a',c,l,'db6',6);
subplot(812);
plot(a);
ylabel('a6');

for i=1:6  %对分解的第6层到第1层的高频系数分别进行
    d=wrcoef('d',c,l,'db6',7-i);
    subplot(8,1,i+2);
    plot(d);
    ylabel(['d',num2str(7-i)]);
end
Decomposition of the first kind of empirical mutation by db6 wavelet
The second kind of db4 wavelet decomposition
load nearbrk;

x=nearbrk;

%使用db4对信号进行2层分解

[c,l]=wavedec(x,2,‘db4’);

subplot(411);
plot(x);
ylabel('x');

%对分解的第六层低频系数进行重构

a=wrcoef('a',c,l,'db4',2);

subplot(412);
plot(a);
ylabel('a2');

for i=1:2%对分解的第2层到第1层的高频系数进行重构
    a=wrcoef('a',c,l,'db4',3-i);
    subplot(4,1,i+2);
    plot(d);
    ylabel(['d',num2str(3-i)]);
end
Remove invalid data at the beginning and end https://blog.csdn.net/FDA_sq/article/details/124250130
Example: Milling infeed process
- The first part of the signal data has the data that the signal gradually becomes larger due to the milling feed process ,
- At the end of the data in the corresponding figure, there is a piece of gradually smaller data caused by the end milling retraction .
- These two pieces of data are abnormal milling signal data, so they are invalid data that need to be manually eliminated.
principle:
- Calculate the critical value of invalid data at the beginning and end of each cutting process : the upper quartile value Q of the original data of each cutting.
- The head of the original data searches for the first data greater than or equal to Q from front to back as the end position of the feed, and eliminates all previous signal data less than Q;
- In the same way, the tail looks for the first data greater than or equal to Q from the back to the front as the starting position of tool retraction, and all subsequent data less than Q are eliminated.
%使用函数:

Q=quantile(x,y,z)

% x表示要求的矩阵或者向量;y的取值为表示要求的分位数,

% 如四分之一中位数0.25,四分之三中位数0.75等;

% z的取值为1或者2,若值为1则表示按列求四分位数,若为2表示按行求四分位数。

% Q为计算的上四分位值,常用大小为 (1,n).


%注:对于向量,
Q2=quantile(raw_data,0.75,1)

%等同于Q3 = prctile(raw_data,75)
Duplicate value elimination https://blog.csdn.net/qq_43657442/article/details/118891434
Use the unique function,
Delete duplicate rows directly
unique(A,'rows',setOrder)

%其中,setOrder 参数有两种取值,默认是’sorted’ 即去掉重复后排序输出(以第一个元素大小位依据),

%另一个是'stable' 代表去掉重复后按原来顺序输出
example
>> a=[1 0 1;1 0 1; 1 1 1;2 5 1; 1 1 1;0 1 2 ;0 4 5 ;0 1 2]

a =

     1     0     1
     1     0     1
     1     1     1
     2     5     1
     1     1     1
     0     1     2
     0     4     5
     0     1     2

>> unique(a,'row','stable')

ans =

     1     0     1
     1     1     1
     2     5     1
     0     1     2
     0     4     5

>> unique(a,'row')

ans =

     0     1     2
     0     4     5
     1     0     1
     1     1     1
     2     5     1

>>
Remove duplicate rows by column
[C,ia,ic] = unique(dataRed(:,1:2),'rows'):

% 基于1、2列的数据查找dataRed中所有的唯一行。
% 指定三个输出以返回索引向量 ia 和 ic。

uA = dataRed(ia,:)

%使用 ia 对 dataRed 进行索引并检索包含前两列中元素的唯一组合的行。
dataRed(:,1:2)dataRedThe first two columns of all rows in are selected . This is usually done to find unique combinations of certain columns in the data without regard to others.'rows'The argument tells MATLAB to consider the order of each row when comparing them, so only rows containing the same value in the same order are considered equal.- Execute
uniquethe function that treats the first two columns as a matrix and returns the sorted results for all unique rows. The results are stored in three variablesC, ,iaand , respectivelyic.
Specifically, the output parameters contain the following:
C: A matrix containing all unique rows of the input matrix, in order of first appearance.ia: A vector containing all unique row indices for the selected column in the input matrix. For each row in the input matrix,iathe corresponding element in isCthe index of the corresponding row in .ic: A vector, the same size as the input matrix, that contains the index of each row in the input matrix to indicate itsCposition in .
Suppose there is a matrix dataRedcontaining the following:
dataRed = [1, 2, 3;
           4, 5, 6;
           7, 8, 9;
           1, 2, 3;
           4, 5, 6];
Call uniquethe function:
[C,ia,ic] = unique(dataRed(:,1:2),'rows');
MATLAB then returns the following results:
C =

     1     2
     4     5
     7     8

ia =

     1
     2
     3

ic =

     1
     2
     3
     1
     2
That means, dataRedthe only combinations of the first two columns in the matrix are (1, 2), , (4, 5)and (7, 8).
iaThe vector contains Cthe positions of the rows in the matrix,
And icthe vector indicates the position dataRedof each row in the matrix Cin the matrix.
matlab finds non-empty positions to remove duplicate data/remove NaN https://blog.csdn.net/qq_20784777/article/details/126480643?utm_medium=distribute.pc_relevant.none-task-blog-2~default~baidujs_baidulandingword~default- 0-126480643-blog-118891434.235%5Ev35%5Epc_relevant_increate_t0_download_v2&spm=1001.2101.3001.4242.1&utm_relevant_index=3
find a non-empty location
Find() function usage in matlab ![]() https://blog.csdn.net/qq_45767476/article/details/109081132
https://blog.csdn.net/qq_45767476/article/details/109081132
find() function
idx = find(isnan(data));
- Used to find all subscript indexes containing NaN (Not-a-Number) elements in a vector or matrix.
- Specifically, this statement performs the following steps:
- isnan(data) returns a logical array of the same size as data, which contains information about whether each element in data is NaN.
- If NaN, this position is 1; otherwise, it is 0.
- The find() function takes the subscripts of the non-zero elements in the input parameter, so for the logical array returned by isnan(data),
- find() will return a subscript vector containing the locations of all 1 elements.
- Therefore, the final result is a column vector idx, which contains the subscript indices of all NaN values in data.
idx = find(~isnan(data));
- Used to find all subscript indexes in a vector or matrix that do not contain NaN (Not-a-Number) elements.
- Specifically, this statement performs the following steps:
- isnan(data) returns a logical array of the same size as data, which contains information about whether each element in data is NaN.
- If NaN, this position is 1; otherwise, it is 0.
- In this statement, the ~ operator negates the logical array, that is, 1 becomes 0 and 0 becomes 1.
- Therefore, the resulting logical array represents the positions of all elements in data that are not NaN.
- The find() function takes the subscripts of the non-zero elements in the input argument, so for the logical array returned by ~isnan(data),
- find() will return a subscript vector containing the locations of all 1 elements.
- Therefore, the final result is a column vector idx, which contains the subscript indices of all non-NaN values in data.
For example, suppose you have a 5x5 matrix Acontaining 5 NaN values.
You can find where these NaN values are located with:
A = [1 2 NaN 4 5;
     6 NaN 8 9 10;
     11 12 13 NaN 15;
     16 17 18 19 NaN;
     NaN 21 22 23 24];

idx = find(isnan(A))
result
idx =

     3
     7
    12
    20
    25
This means, Athe 3rd, 7th, 12th, 20th and 25th elements of the matrix are NaN.
Where these non-NaN values reside can be found with:
A = [1 2 NaN 4 5;
     6 NaN 8 9 10;
     11 12 13 NaN 15;
     16 17 18 19 NaN;
     NaN 21 22 23 24];

idx = find(~isnan(A))
result
idx =

     1
     2
     4
     5
     6
     7
     8
     9
    10
    11
    12
    13
    14
    15
    16
    17
    18
    19
    21
    22
    23
    24
isnan() function usage ![]() https://blog.csdn.net/Intangilble/article/details/83786589
https://blog.csdn.net/Intangilble/article/details/83786589
isnan(A):
%判断数组的元素是否是NaN。(True for Not-a-Number.)

%用法说明:
B = isnan(A)

%返回一个与A相同维数的数组;
%若A的元素为NaN(非数值),在对应位置上返回逻辑1(真),否则返回逻辑0(假)。
example
(InF stands for positive infinity; -InF stands for negative infinity; NaN stands for non-numeric quantity;)
>>isnan([pi NaN Inf -Inf])


ans =

  1×4 logical 数组

   0   1   0   0
[data in] = unique(data(:, n)):
b = unique(A)
b = unique(A,'rows')
[b,m,n] = unique(...)
%描述
%1、b = unique(A) 返回的是和A中一样的值,但是没有重复元素。产生的结果向量按升序排序。
%A可以是一个字符串的单元阵列。
%2、b = unique(A,'rows') 返回的是A中的唯一的行数。
%3、[b,m,n] = unique(...) 也返回索引向量m和n,使得B = A(M) 和 A= B(N).
%m的每一个元素是最大的下标,使得B = A(M). 对于行的组合,B = A(M,:) 和 A= B(N,:) Eliminate outliers and smooth processing ![]() https://www.bilibili.com/read/cv9279417
https://www.bilibili.com/read/cv9279417