[Cloud Native Monitoring] Prometheus-based self-defined index elastic scaling (HPA)
What is elastic scaling
"Autoscaling is elastic scaling, which is a very core function in Kubernetes. It can automatically scale Pod copies according to a given indicator (such as CPU or memory), so as to better manage and utilize computing resources and improve system availability. and performance, while reducing overhead and cost. Elastic scaling can solve large fluctuations in service load or gaps between actual resource usage and estimates.”
Three elastic scaling technologies are provided in the Kubernetes cluster:
"CA (Cluster Autoscaler)" : Node-level automatic expansion/reduction
"HPA (Horizontal Pod Autoscaler)" : The number of Pods is automatically expanded/shrunk
"VPA (Vertical Pod Autoscaler)" : Pod configuration automatically expands/reduces capacity, mainly CPU and memory configuration
"Node automatic expansion/shrinkage"
Cluster AutoScaler periodically detects whether there are sufficient resources to schedule newly created Pods, and calls Cloud Provider to create new Nodes when resources are insufficient. Cluster AutoScaler also regularly monitors the resource usage of Node. When a Node's resource utilization is low (below 50%) for a long time, it automatically deletes the virtual machine where it resides from the cluster. At this point, the original Pod will be automatically scheduled to other Nodes.
The increase or decrease of Node may affect the stability of the entire kubernetes cluster. Once a problem occurs, it will affect all business programs deployed on the entire cluster. Therefore, the expansion and contraction of Node nodes in production is generally used with caution. When scaling, it is often done by manually executing scripts.
"Vertical expansion/contraction of Pod (VPA)"
The full name of VPA is Vertical Pod Autoscaler, which is the vertical automatic scaling of Pod. It automatically sets CPU and memory requests according to the container resource usage, thus allowing proper scheduling on the node to provide appropriate resources for each Pod. It can both shrink containers that are overrequesting resources, and scale up underresourced ones at any time based on their usage.
"Currently, the VPA technology is not mature enough. It is a relatively new function of Kubernetes. Updating the resource configuration of the running Pod is an experimental function of VPA, which will cause the Pod to be rebuilt and restarted, and may be scheduled to other nodes. superior."
"Horizontal Expansion/Reduction of Pod (HPA)"
The full name of HPA is Horizontal Pod Autoscaler, that is, the horizontal automatic scaling of pods. It automatically adjusts the number of copies of pods according to resource utilization or custom indicators, so as to realize the expansion and contraction of pods, so that the deployment scale is close to the actual service load.
HPA Elastic Scaling Principle
Horizontal Pod AutoscalerThe function was originally Kubernetes 1.1introduced in and has been continuously developed, and currently HPAsupports autoscaling/v1, autoscaling/v2beta1and autoscaling/v2beta2three major versions.
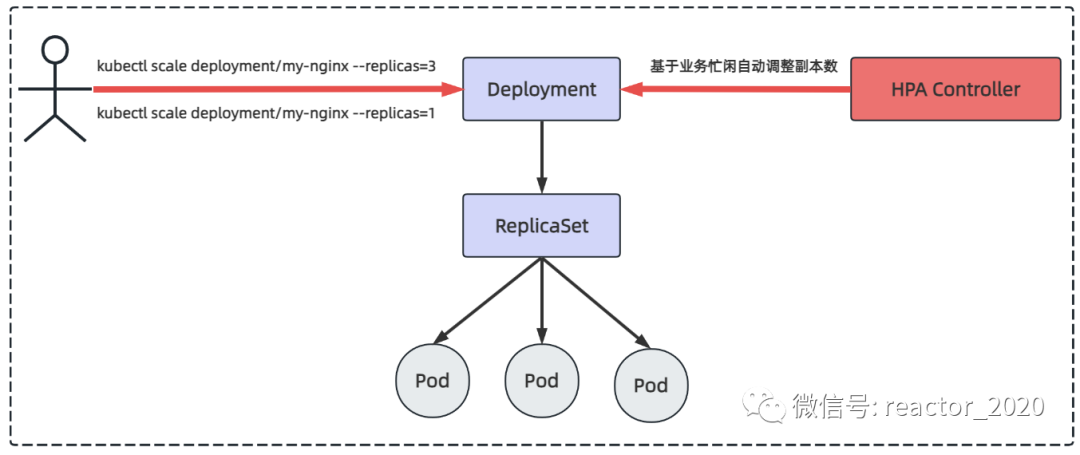
In normal scenarios, such as when the business pressure is low at night, you can use the kubectl scale command to set the number of Pod copies to 1; when you go to work during the day and the business pressure is high, you can use the kubectl scale command to set the number of Pod copies to 3, but these Operations are performed manually. The HPA controller judges whether the business is busy or busy based on business indicators, and automatically calculates the current number of Pod copies based on the algorithm, and automatically adjusts the number of Pod copies.
Kubernetes HPA v2v1Made some major improvements over the version. The most notable improvement is the introduction of "multi-index" automatic scaling, that is, automatic scaling decisions can be made based on multiple indicators (such as CPU usage, memory usage, network load, etc.) at the same time. In addition, the ability to support "custom indicators"HPA v2 has been added , allowing users to define and use their own indicators according to their needs. In general, it is a more mature, flexible and customizable automatic scaling mechanism.Kubernetes HPA v2
"The core mechanism of HPA elastic scaling: automatically adjust the number of copies of business workloads according to the busyness of the business. There are two key points involved here:"
"How to identify the busyness of the business"
"Adjust the number of copies of the control Pod"
"Let's look at the first question first: how to identify the busyness of the business?"
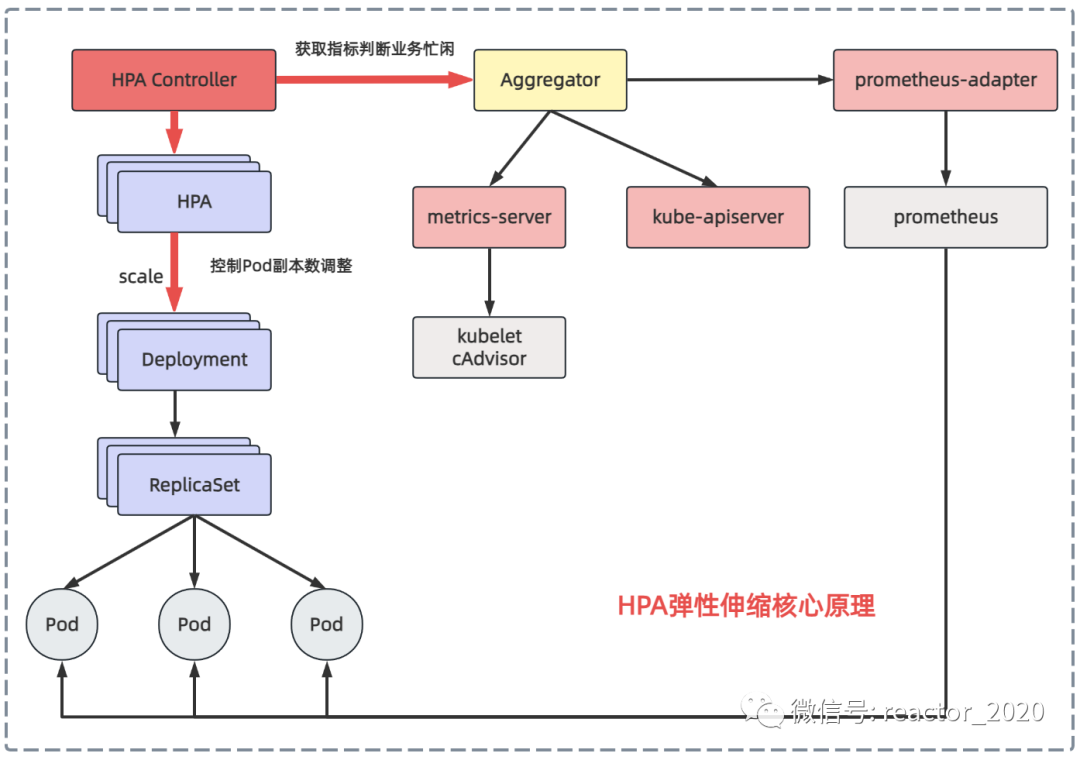
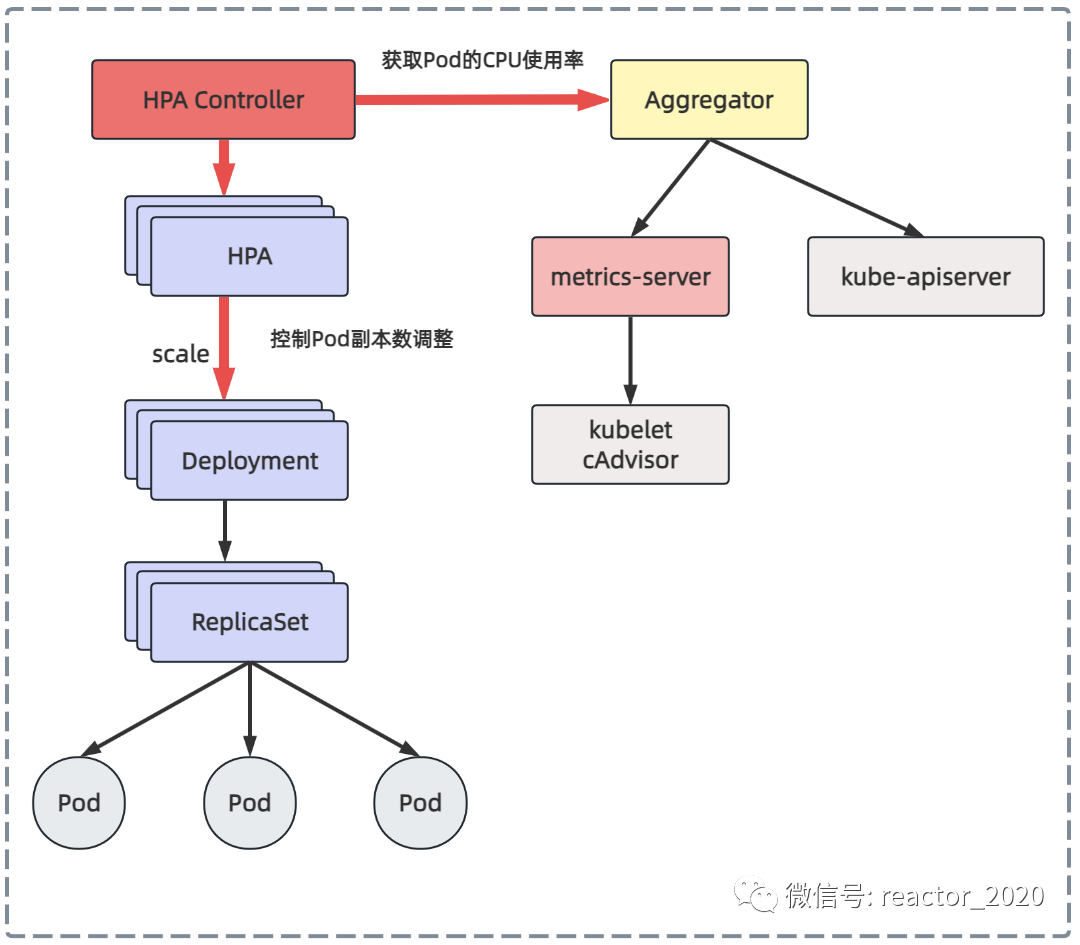
When I introduced the kubernetes cluster monitoring before, I introduced that the metrics-server component can obtain the underlying container runtime indicators from cAdvisor in the kubelet component of all nodes in the cluster, and then after aggregation, you can view the usage of CPU and memory resources through kubectl top node/pod , and can also kubectl get --raw /apis/metrics.k8s.io/v1beta1/nodes be obtained through interface access. Therefore, the HPA controller can obtain the CPU and memory usage of the Pod through the metrics-server component to identify the busyness of the business.
Kubernetes 1.7 introduces the aggregation layer (Aggregator), allowing third-party applications to extend the Kubernetes API by registering themselves as API plug-ins. The metrics-server component is registered to the aggregation layer and then you can access the interface of the metrics-server backend service just like accessing the kube-apiserver interface.
Kubernetes introduces an API aggregation layer in the kube-apiserver service, which is used to forward the access request of the extended API to the user service. For example, when you visit apis/metrics.k8s.io/v1beta1, aggregatorthe component will be based on groupand versionforwarded to the backend metrics-serverservice, and the aggregation layer is only equivalent to the proxy layer. In this way, we can easily Kubernetesexpand API.
Obtaining CPU and memory indicators from the metrics-server is relatively simple. The de facto standard for kubernetes cluster monitoring is prometheus. If indicators can be obtained from prometheus to identify business busyness, the flexibility of elastic scaling will be greatly increased. The prometheus-adapter component can achieve this function. It pulls indicators from prometheus and converts them into data formats recognized by the kubernetes api interface, and registers them in the aggregation layer, so that other services in the kubernetes cluster can be accessed through /apis/.
"Let's look at the second question: how to control the adjustment of the number of Pod copies?"
The HPA controller will periodically execute the reconcile method of each HPA object, mainly including how to operate:
Get current indicator data: get CPU usage, memory usage from metrics-server or custom indicator data from prometheus-adapter;
Calculation of the number of Pod replicas: Compare the obtained indicator data with the target expectation to determine whether to expand, shrink or remain unchanged. If no adjustment is required, the current number of replicas will be returned directly. Otherwise, HPA metrics will be used to correspond to the target type. The algorithm to calculate the target number of copies of the deployment;
Update the number of Pod copies: If the target number of Pod copies calculated in the previous step is inconsistent with the current number of copies, that is, expansion/reduction is required, the HPA controller initiates a scale operation to the Deploymen to adjust the current number of copies and complete the expansion / shrink operation;
Monitoring and adjustment effects: Finally, it is possible to maintain the final metrics (average value) of each pod under the deployment to the level expected by the user. HPA will continue to monitor the impact of the number of new Pod copies on the indicator data, and perform as needed Further adjustments.
❝The reconcile timing interval defaults to 15 seconds, which can be configured through horizontal-pod-autoscaler-sync-period.
❞
HPA based on CPU metrics
The HPA v1 version supports elastic scaling of CPU usage and memory usage. Memory usage is generally affected by cache and it is difficult to truly reflect the system load. Therefore, CPU usage indicators are generally used for elastic scaling. The CPU usage of the container can be proxied to the back-end metrics-server service through the aggregation layer API. The metrics-server sends requests to all kubelet components, and collects the CPU and memory running information of all containers through cAdvisor, so that the HPA controller can obtain to the CPU usage of the Pod, and then perform elastic scaling based on the CPU usage.
"1. Create Pod based on Deployment:"
#vi deploy-for-hpa_cpu.yml
apiVersion: apps/v1
kind: Deployment
metadata:
  name: web
spec:
  replicas: 1
  selector:
    matchLabels:
      app: nginx-php
  template:
    metadata:
      labels:
        app: nginx-php
    spec:
      containers:
      - image: lizhenliang/nginx-php
        name: java
        resources:
           requests:
             memory: "300Mi"
             cpu: "250m"
---
apiVersion: v1
kind: Service
metadata:
  name: web
spec:
  ports:
  - port: 80
    protocol: TCP
    targetPort: 80
  selector:
    app: nginx-php
"2. Create:"
[root@k8s-01 autoscaling]# kubectl apply -f deploy-for-hpa_cpu.yml -n demo01
[root@k8s-01 autoscaling]# kubectl get pod -n demo01
NAME                                  READY   STATUS    RESTARTS   AGE
web-84885d5959-fbtxt                 1/1     Running   0          29s
"3. HPA strategy document:"
# vi hpa_for_cpu.yml
apiVersion: autoscaling/v1
kind: HorizontalPodAutoscaler
metadata:
  name: web
spec:
  #扩/缩容副本范围
  maxReplicas: 3
  minReplicas: 1
  #指定扩容的Deployment
  scaleTargetRef:
    apiVersion: apps/v1
    kind: Deployment
    name: web
targetCPUUtilizationPercentage: 60❝❞
targetCPUUtilizationPercentage: 60Indicates that when the overall resource utilization of the Pod exceeds 60%, the capacity will be expanded.
"4. Create HPA:"
[root@k8s-01 autoscaling]# kubectl apply -f hpa_for_cpu.yml -n demo01
horizontalpodautoscaler.autoscaling/web created
[root@k8s-01 autoscaling]# kubectl get hpa -n demo01
NAME              REFERENCE                       TARGETS   MINPODS   MAXPODS   REPLICAS   AGE
web Deployment/web 0%/60% 1 3 1 44s❝The TARGETS column shows the indicators. The first 0% means that the current Pod gets the overall CPU resource usage. Because there is no HTTP request, it is 0%; 60% is the expansion/shrinkage threshold.
MINPODS, MAXPODS: Specify hpa expansion/reduction
❞
"5. Pressure test:"
[root@k8s-01 autoscaling]# yum install httpd-tools
[root@k8s-01 autoscaling]# kubectl get svc -n demo01
NAME                 TYPE        CLUSTER-IP      EXTERNAL-IP   PORT(S)    AGE
web                  ClusterIP   10.96.237.204   <none>        80/TCP     5d20h
[root@k8s-01 autoscaling]# ab -n 100000 -c 100  http://10.96.237.204/status.php
"6. Observe expansion/contraction:"
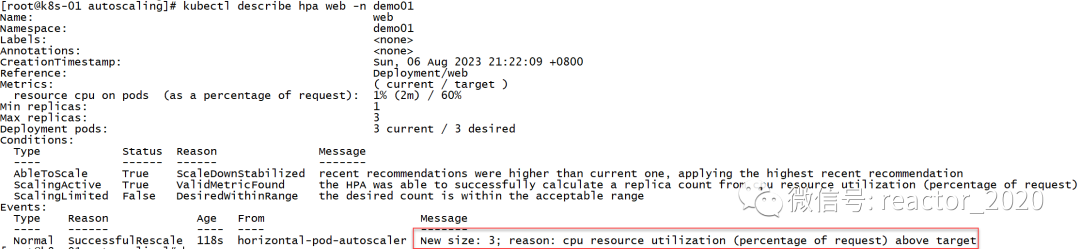
After dozens of seconds of pressure testing, I checked the hpa and found that the overall CPU usage was 173%, exceeding the target value of 60%, but the replicas were still 1, and there was no capacity expansion:
[root@k8s-01 autoscaling]# kubectl get hpa -n demo01
NAME              REFERENCE                       TARGETS    MINPODS   MAXPODS   REPLICAS   AGE
metrics-app-hpa   Deployment/sample-httpserver2   200m/2     1         3         1          46h
web               Deployment/web                  173%/60%   1         3         1          75s
After a while, you will see that replicas=3, which triggers the expansion operation:
[root@k8s-01 autoscaling]# kubectl get hpa -n demo01
NAME              REFERENCE                       TARGETS   MINPODS   MAXPODS   REPLICAS   AGE
metrics-app-hpa   Deployment/sample-httpserver2   200m/2    1         3         1          46h
web               Deployment/web                  15%/60%   1         3         3          76s
View Pod information:
[root@k8s-01 autoscaling]# kubectl get pod -n demo01
NAME                                 READY   STATUS    RESTARTS   AGE
web-84885d5959-d9l4h                 1/1     Running   0          90s
web-84885d5959-fbtxt                 1/1     Running   0          6m9s
web-84885d5959-xgn4n                 1/1     Running   0          90s
kubectl describe hpa information, you can see that there is a message event that the number of replicas has expanded to 3:
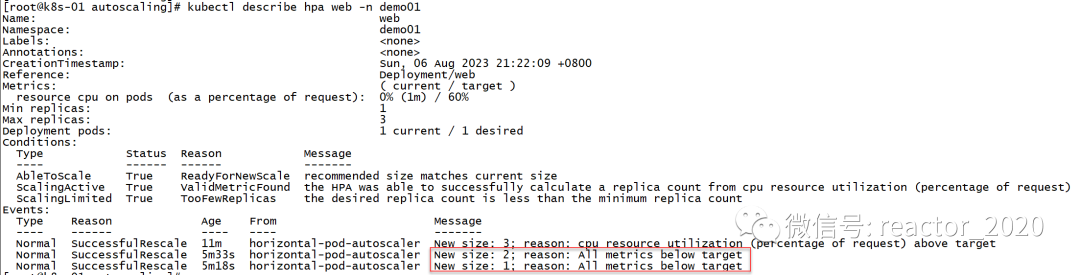
After the pressure test is stopped, the CPU usage pressure will drop. After waiting for a few minutes, the shrinking operation will be triggered again, and the replicas will be set to 1 again:
[root@k8s-01 autoscaling]# kubectl get hpa -n demo01
NAME              REFERENCE                       TARGETS   MINPODS   MAXPODS   REPLICAS   AGE
web               Deployment/web                  0%/60%    1         3         1          7m59s
kubectl describe hpa View the hpa information, you will find two shrinkage message events, one shows the number of copies shrinking from 3 to 2 message events, and the other shows the number of copies shrinking from 2 to 1 message event:
HPA based on Prometheus custom indicators
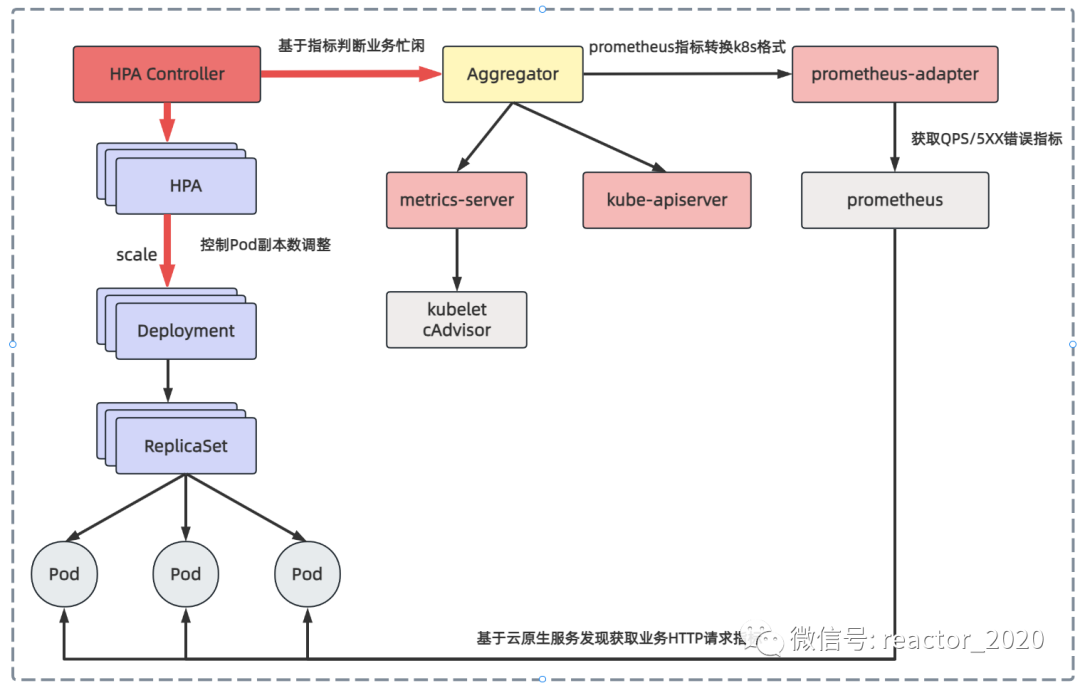
Based on the CPU usage and memory usage obtained by the metrics-server component, the flexibility of elastic scaling is slightly poor. If you want to use custom indicators, such as the QPS of HTTP requests and the number of 5XX errors, Prometheus is basically used for monitoring in the cloud-native field. The custom indicators are provided by Prometheus, and then aggregated to the apiserver using prometheus-adapter to achieve the same effect of obtaining CPU and memory from the metric-server component.
The core process of HPA based on Prometheus custom indicators is as follows:
prometheus-adapter component deployment
"1. Install prometheus-adaptercomponents:"
[root@k8s-01 ~]# helm repo add stable http://mirror.azure.cn/kubernetes/charts
"prometheus-community" has been added to your repositories
[root@k8s-01 ~]# helm repo update
Hang tight while we grab the latest from your chart repositories...
...Successfully got an update from the "prometheus-community" chart repository
Update Complete. ⎈ Happy Helming!⎈
[root@k8s-01 ~]# helm repo list
NAME                    URL
stable                  http://mirror.azure.cn/kubernetes/charts

[root@k8s-01 ~]# helm install prometheus-adapter stable/prometheus-adapter --namespace monitoring --set prometheus.url=http://prometheus,prometheus.port=9090
NAME: prometheus-adapter
LAST DEPLOYED: Tue Aug  1 23:44:08 2023
NAMESPACE: monitoring
STATUS: deployed
REVISION: 1
TEST SUITE: None
NOTES:
prometheus-adapter has been deployed.
In a few minutes you should be able to list metrics using the following command(s):

kubectl get --raw /apis/custom.metrics.k8s.io/v1beta1❝curl http://192.168.31.160:32478/metrics
❞
"2. Check whether the component installation is successful:"
[root@k8s-01 ~]# kubectl get pod -n monitoring
NAME                                      READY   STATUS    RESTARTS   AGE
prometheus-adapter-76d8fb4549-6vzzg       1/1     Running   0          3m25s

[root@k8s-01 ~]# kubectl get apiservices
NAME                                   SERVICE                          AVAILABLE   AGE
...
v1beta1.custom.metrics.k8s.io          monitoring/prometheus-adapter   True        2m28s

[root@k8s-01 ~]# kubectl get --raw /apis/custom.metrics.k8s.io/v1beta1 |jq|more
{
  "kind": "APIResourceList",
  "apiVersion": "v1",
  "groupVersion": "custom.metrics.k8s.io/v1beta1",
  "resources": [
    {
      "name": "namespaces/file_descriptors",
      "singularName": "",
      "namespaced": false,
      "kind": "MetricValueList",
      "verbs": [
        "get"
      ]
    },
    {
      "name": "namespaces/kube_ingress_annotations",
      "singularName": "",
      "namespaced": false,
      "kind": "MetricValueList",
      "verbs": [
        "get"
      ]
    },
...❝Check the log of the prometheus-adapter component, be careful not to appear something like http://prometheus:9090/api/v1/series?match%5B%5D=%7B__name__%3D~%22%5Econtainer_.%2A%22%2Ccontainer%21 %3D%22POD%22%2Cnamespace%21%3D%22%22%2Cpod%21%3D%22%22%7D&start=1690905427.938 timeout This error.
❞
The helm uninstall operation is as follows:
[root@k8s-01 ~]# helm ls -n kube-system
NAME                    NAMESPACE       REVISION        UPDATED                                 STATUS          CHART                           APP VERSION
prometheus-adapter      kube-system     1               2023-08-01 23:44:08.027994527 +0800 CST deployed        prometheus-adapter-4.3.0        v0.11.0
[root@k8s-01 ~]# helm uninstall prometheus-adapter -n kube-system
release "prometheus-adapter" uninstalled
Deploy golang application
"1. Initialize golangthe project project:"
[root@swarm-manager ~]# mkdir metrics
[root@swarm-manager ~]# cd metrics/
[root@swarm-manager metrics]# go mod init metrics
"2. Write metrics.go:"
package main

import (
 "github.com/prometheus/client_golang/prometheus"
 "github.com/prometheus/client_golang/prometheus/promhttp"
 "net/http"
 "strconv"
)

func main() {
 metrics := prometheus.NewCounterVec(
  prometheus.CounterOpts{
   Name: "http_requests_total",
   Help: "Number of total http requests",
  },
  []string{"status"},
 )
 prometheus.MustRegister(metrics)

 http.HandleFunc("/", func(w http.ResponseWriter, r *http.Request) {
  path := r.URL.Path
  statusCode := 200
  switch path {
  case "/metrics":
   promhttp.Handler().ServeHTTP(w, r)
  default:
   w.WriteHeader(statusCode)
   w.Write([]byte("Hello World!"))
  }
  metrics.WithLabelValues(strconv.Itoa(statusCode)).Inc()
 })
 http.ListenAndServe(":3000", nil)
}❝The go project mainly exposes the http_requests_total indicator through the /metrics endpoint.
❞
"3. Local compilation and packaging:"
[root@swarm-manager metrics]# go mod tidy
[root@swarm-manager metrics]# go build -o metrics metrics.go
"4. Create a mirror image and push it to the docker hub:"
Write Dockerfile:
FROM golang:latest
MAINTAINER simon "[email protected]"
RUN mkdir -p /app
WORKDIR /app
COPY ./metrics /app
EXPOSE 3000

RUN chmod +x ./metrics
ENTRYPOINT ["./metrics"]
Build the image:
docker build -t metrics ."5. k8s deployment:"
# sample-httpserver-deployment.yaml
apiVersion: apps/v1
kind: Deployment
metadata:
  labels:
    app: sample-httpserver
  name: sample-httpserver
  namespace: default
spec:
  replicas: 1
  selector:
    matchLabels:
      app: sample-httpserver
  strategy: {}
  template:
    metadata:
      annotations:
        prometheus.io/scrape: "true"
        prometheus.io/path: /metrics
        prometheus.io/port: "3000"
      labels:
        app: sample-httpserver
    spec:
      containers:
        - image: addozhang/httpserver-n-metrics:latest
          name: httpserver-n-metrics
          ports:
            - containerPort: 3000
          resources:
            requests:
              memory: '300Mi'
---
apiVersion: v1
kind: Service
metadata:
  name: sample-httpserver
  labels:
    app: sample-httpserver
spec:
  ports:
  - name: web
    port: 3000
    targetPort: 3000
  selector:
    app: sample-httpserver
"6. The interface acquisition index is normal:"
[root@k8s-01 demo01]# kubectl get svc -n demo01
NAME                TYPE        CLUSTER-IP      EXTERNAL-IP   PORT(S)    AGE
nginx-service       ClusterIP   None            <none>        80/TCP     249d
sample-httpserver   ClusterIP   10.96.153.13    <none>        3000/TCP   32s
tomcat-service      ClusterIP   None            <none>        8080/TCP   249d
web                 ClusterIP   10.96.237.204   <none>        80/TCP     47h
[root@k8s-01 demo01]# curl 10.96.153.13:3000/metrics
# HELP go_gc_duration_seconds A summary of the pause duration of garbage collection cycles.
# TYPE go_gc_duration_seconds summary
go_gc_duration_seconds{quantile="0"} 3.5147e-05
go_gc_duration_seconds{quantile="0.25"} 3.8423e-05
go_gc_duration_seconds{quantile="0.5"} 4.1267e-05
go_gc_duration_seconds{quantile="0.75"} 5.0566e-05
go_gc_duration_seconds{quantile="1"} 9.0761e-05
go_gc_duration_seconds_sum 0.001240037
go_gc_duration_seconds_count 25
......
"7, prometheus configuration capture job:"
- job_name: 'app'
  kubernetes_sd_configs:
  - role: pod
  relabel_configs:
  - action: keep
    source_labels: [__meta_kubernetes_pod_annotation_prometheus_io_scrape]
    regex: true
  - source_labels: [__meta_kubernetes_namespace]
    target_label: namespace
  - source_labels: [__meta_kubernetes_pod_name]
    target_label: pod
"8. Index capture verification:"
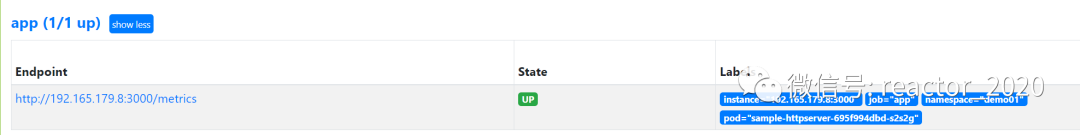
In the prometheus target, you can see that the deployed application indicators are connected successfully:
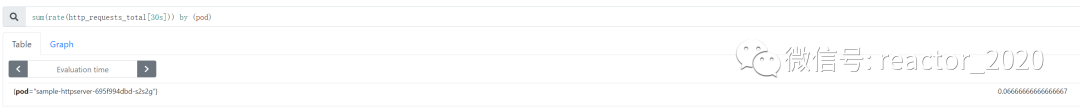
Use PromQL query:sum(rate(http_requests_total[30s])) by (pod)
HPA resource creation
"1. Create hpa:"
# vi app-hpa-v2.yml
apiVersion: autoscaling/v2beta2
kind: HorizontalPodAutoscaler
metadata:
  name: metrics-app-hpa
  namespace: demo01
spec:
  scaleTargetRef:
    apiVersion: apps/v1
    kind: Deployment
    name: sample-httpserver
  minReplicas: 1
  maxReplicas: 3
  metrics:
  - type: Pods
    pods:
      metric:
        name: http_requests_qps
      target:
        type: AverageValue
        averageValue: 2000m   # 2000m 即2个/秒
"2. prometheus-adapterThe component configures the calculation rules of custom indicators, telling prometheus-adapterhow to prometheusobtain indicators and calculate the indicators we need: kubectl edit cm prometheus-adapter -n monitoring"
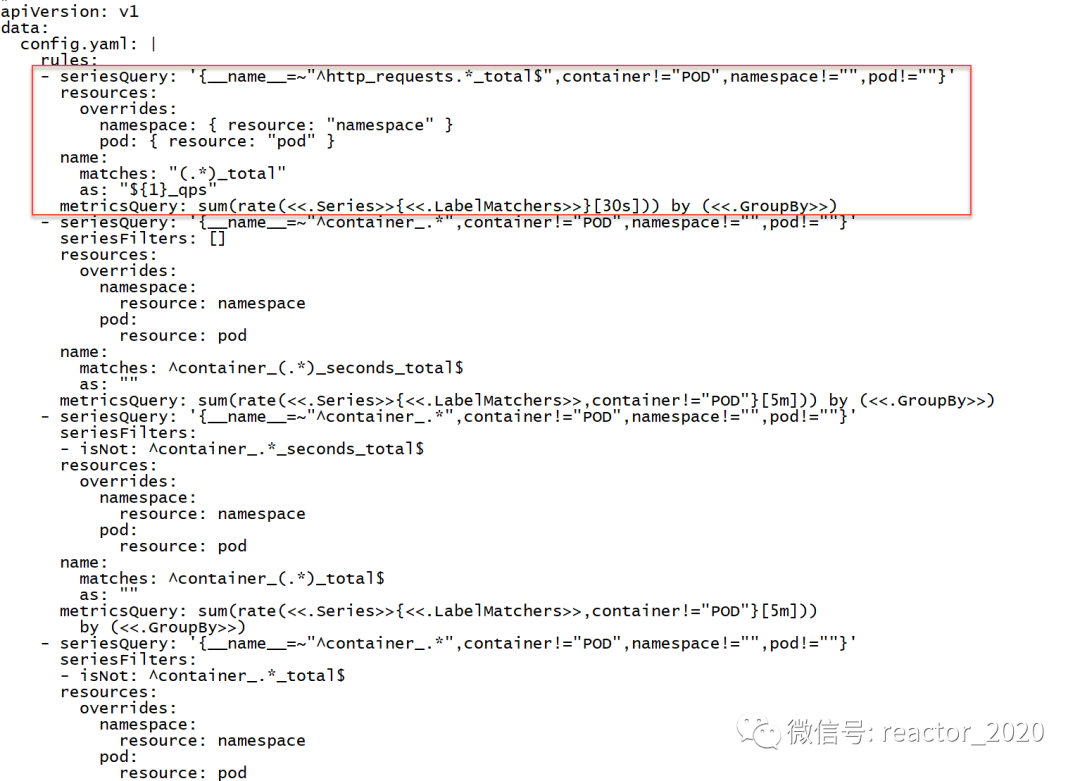
❝prometheus-adapter cannot dynamically load configuration, you need to kubectl delete pod prometheus-adapter-xx, let Pod restart to load the latest configuration.
❞
"3. You can access the api-server to obtain the new indicators calculated and generated by the prometheus-adapter:"
[root@k8s-01 ~]# kubectl get --raw '/apis/custom.metrics.k8s.io/v1beta1/namespaces/demo01/pods/*/http_requests_qps' | jq
{
  "kind": "MetricValueList",
  "apiVersion": "custom.metrics.k8s.io/v1beta1",
  "metadata": {
    "selfLink": "/apis/custom.metrics.k8s.io/v1beta1/namespaces/demo01/pods/%2A/http_requests_qps"
  },
  "items": [
    {
      "describedObject": {
        "kind": "Pod",
        "namespace": "demo01",
        "name": "sample-httpserver-695f994dbd-s2s2g",
        "apiVersion": "/v1"
      },
      "metricName": "http_requests_qps",
      "timestamp": "2023-08-02T15:32:56Z",
      "value": "66m",
      "selector": null
    }
  ]
}❝"Note: Here
❞value: 66m, the suffix "m" of the value is identifiedmilli-requests per seconds, so 66m here means 0.06/s 0.06 requests per second."
"4. With the indicator data, prometheus-adapter can create hpa based on the indicator: kubectl apply -f app-hpa-v2.yml"
# vi app-hpa-v2.yml
apiVersion: autoscaling/v2beta2
kind: HorizontalPodAutoscaler
metadata:
  name: metrics-app-hpa
  namespace: demo01
spec:
  scaleTargetRef:
    apiVersion: apps/v1
    kind: Deployment
    name: sample-httpserver
  minReplicas: 1
  maxReplicas: 3
  metrics:
  - type: Pods
    pods:
      metric:
        name: http_requests_qps
      target:
        type: AverageValue
        averageValue: 2000m   # 2000m 即2个/秒
"5. Check that hpa obtains indicators from the prometheus-adapter component normally:"

The current number of Pod replicas is 1:
"6. Interface pressure test:"
[root@k8s-01 ~]# kubectl get svc -n demo01
NAME                TYPE        CLUSTER-IP      EXTERNAL-IP   PORT(S)    AGE
nginx-service       ClusterIP   None            <none>        80/TCP     249d
sample-httpserver   ClusterIP   10.96.153.13    <none>        3000/TCP   8m11s
[root@k8s-01 ~]# ab -n 100000 -c 30  http://10.96.153.13:3000/metrics
This is ApacheBench, Version 2.3 <$Revision: 1430300 $>
Copyright 1996 Adam Twiss, Zeus Technology Ltd, http://www.zeustech.net/
Licensed to The Apache Software Foundation, http://www.apache.org/

Benchmarking 10.96.153.13 (be patient)
Completed 10000 requests
Completed 20000 requests
"7. Elastic scaling verification:"
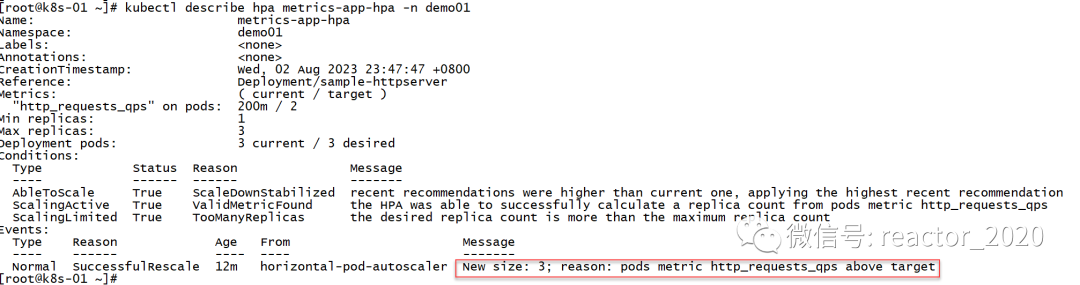
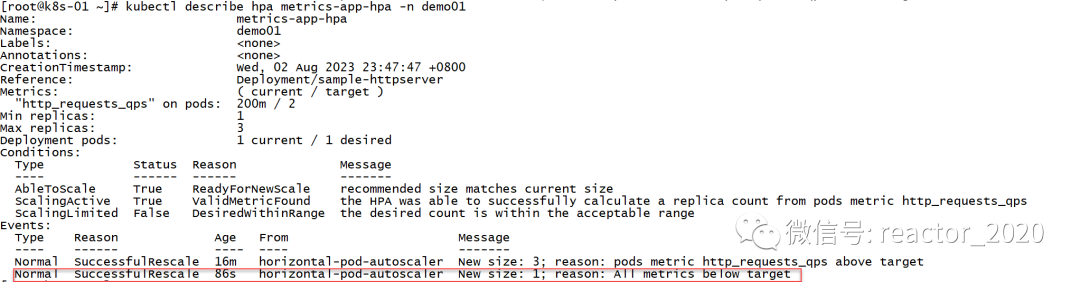
Check the HPA status, the targets column shows that the current index has reached about 10900m, and the 2 behind the slash means that it will be elastically stretched when it reaches 2, and 10900m/1000=10, which is obviously more than 2, and the replicas column shows that the current expansion to the maximum number of replicas is 3 :

Check the HPA description information, you can see that there is an Event that clearly describes the http_requests_qps index exceeding the target setting of 2, and the number of copies is set to 3:
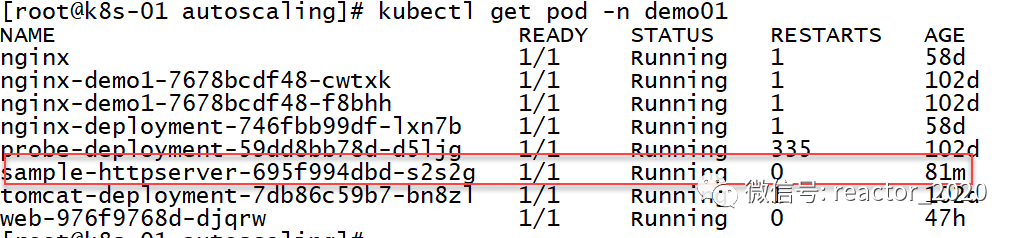
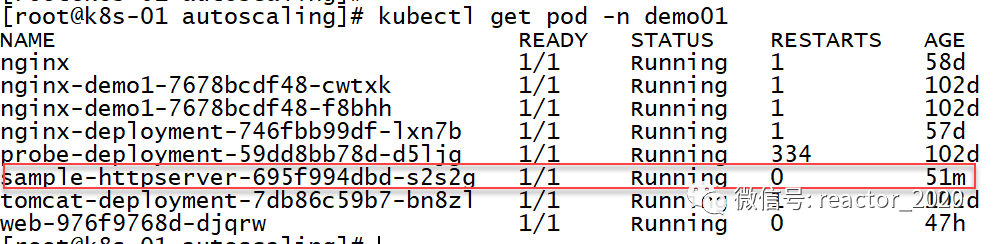
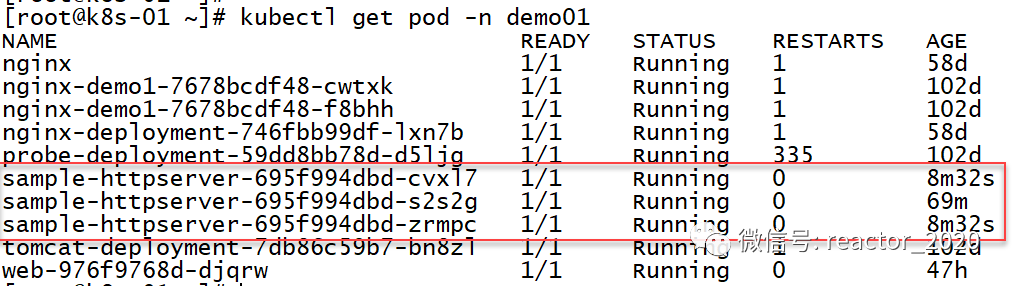
Looking at the pod information again, it is found that the number of replicas has indeed been expanded to 3:
"8. Elastic shrinkage verification:"
After stopping the interface pressure test, the hpa index drops, and the 200m is obviously less than 2. After about 5 minutes of stability, the hpa starts to shrink, reducing the number of copies from 3 to 1:

Viewing the description information of hpa also confirms that hpa shrinks:
Let's confirm that the Pod has become 1: