[Cloud native • Monitoring] Prometheus-based cloud native cluster monitoring (theory + practice)-03
k8s service component indicators
kubernetesAs a large-scale multi-node container scheduling platform, cloud-native clusters have gradually become a technology trend due to their huge advantages in delivery and deployment, such as rapid expansion/contraction based on workload, self-healing of faults, and resource elasticity.
However, on the other hand, kubernetesthe cloud-native cluster has "higher complexity" . There are many components in the cluster itself, such as running on the master node: api-server component, etcd component, kube-scheduler component, kube-controller-manager component, coredns components, etc. There are kubelet components, kube-proxy components, etc. on the node node. There is another problem implied here: once there is a problem with the cloud-native cluster, the application components deployed on the cloud-native cluster may be affected, "the impact is relatively large . "
Therefore, as the operation and maintenance personnel of cloud-native clusters, pay attention to the overall operation status of cloud-native cluster components, especially the operation status of some core components, so as to avoid performance bottlenecks and abnormal crashes of some components, which may lead to low performance of the entire cloud-native cluster or even In this section, we will focus on monitoring the core components of cloud-native clusters for the occurrence of unavailability risks.
kubernetes architecture
Before kubernetesmonitoring service components, we need to understand kubernetesthe architecture (see the figure below):
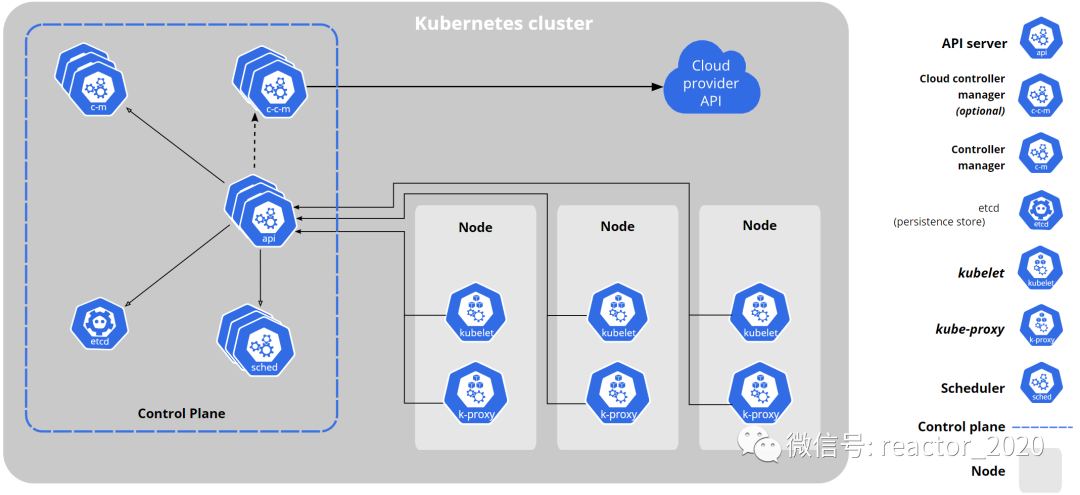
kubernetesCluster nodes are roughly divided into two categories: control nodes and worker nodes.
The blue box on the left is the core component running on the control node:
API ServerComponent:API ServerThe brain of the entire cluster that can be seen. From the figure, it can be seen that basically all components mustAPI Serverinteract with components. At the same time, internal and external interface requests must also pass throughAPI Servercomponents, such askubectlinstructions,client-goobtaining monitoring cluster resources, and so on.ETCDComponents:API ServerAs the external interface layer of the cluster, components will receive a large number of external requests. A persistent database is definitely needed to store these metadata information.ETCDComponents arekubernetesthe databases for storing metadata.SchedulerComponent:kubernetesAs a large-scale multi-node container scheduling platform, it can flexibly implement container scheduling based on multiple strategies, which isSchedulerthe responsibility of the component.Controller ManagerComponents:kubernetesThe core design concept is declarative.kubernetesAll operations in the cluster can be clearly described through declarative yaml files. Users don’t need to pay too much attention to how the underlying layer is implemented. The logic behind this is that in thekubernetescluster Thanks to the existence of a large number of controllers,kubernetesthe secondary development is mainly to customize various controllers, andController Managerthe component is the manager that manages these controllers.
The right frame is the working node. The control node is equivalent to the cluster management layer and drives the operation of the entire cluster. The working node is the node that actually runs the business container, and the tasks assigned by the control node scheduling can be completed. Its core components:
kubeletComponent: The most important component on the working node is the kubelet component, which is mainly responsible for the creation, management, and operation of the underlying container.kubeletBased on communicationCRI(Container Runtime Interface)with the container runtime (Docker、containerdetc.), this standardized interface enableskubernetescommunication with different container runtimes. Interaction improves the flexibility and scalability of the system.kube-proxyComponent:kube-proxyIt iskubernetesan important component responsible for network proxy and load balancing in the cluster. It ensures the accessibility and high availability of services through functions such as forwarding requests, load balancing and session binding, and provides stable and reliable network services for applications.
API Server component monitoring
1. API ServerAs kubernetesthe core component, of course its monitoring is also very necessary. API ServerComponents are deployed kube-systemunder the namespace:
[root@k8s-01 manifests]# kubectl get pod -n kube-system -owide -l component=kube-apiserver
NAME                    READY   STATUS    RESTARTS   AGE   IP               NODE     NOMINATED NODE   READINESS GATES
kube-apiserver-k8s-01   1/1     Running   2          21d   192.168.31.160   k8s-01   <none>           <none>
And defaultcreate it under the namespace service, and configure it manually endpoint:
[root@k8s-01 manifests]# kubectl get svc
NAME         TYPE        CLUSTER-IP   EXTERNAL-IP   PORT(S)   AGE
kubernetes   ClusterIP   10.96.0.1    <none>        443/TCP   519d
[root@k8s-01 manifests]# kubectl get ep kubernetes
NAME         ENDPOINTS             AGE
kubernetes   192.168.31.160:6443   519d
2. Therefore, we can discover services based serviceon :endpoints
- job_name: 'kube-apiserver'
   metrics_path: metrics
   scheme: https
   tls_config:
     ca_file: /var/run/secrets/kubernetes.io/serviceaccount/ca.crt
   bearer_token_file: /var/run/secrets/kubernetes.io/serviceaccount/token
   kubernetes_sd_configs:
   - role: endpoints
   relabel_configs:
   - source_labels: [__meta_kubernetes_service_name]
     regex: kubernetes
     action: keep
   - source_labels: [__meta_kubernetes_endpoint_port_name]
     regex: https
     action: keep
   - action: labelmap
     regex: __meta_kubernetes_pod_label_(.+)
3. prometheus targetCheck that the access of the collection point is normal through the interface:

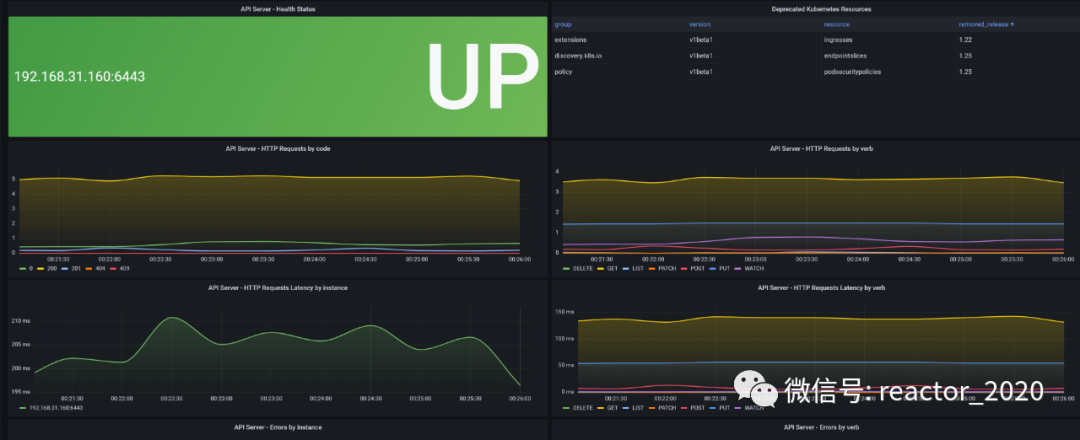
4. Import 15761 dashboard, and API Serverthe component monitoring indicators will be displayed on the template.
For example, you can see the health check status of the API Server component. API ServerAs kubernetesthe cluster brain, the component mainly provides external APIinterfaces. Therefore, here we focus on monitoring API Serverthe request volume, request response delay, and error request volume of the component:
ETCD component monitoring
kubernetesBy default, the cluster ETCDis enabled to expose metricsdata.
1. Get Etcd Podthe name:
[root@k8s-01 manifests]# kubectl edit pod etcd-k8s-01 -n kube-system
spec:
  containers:
  - command:
    - etcd
    - --advertise-client-urls=https://192.168.31.160:2379
    - --cert-file=/etc/kubernetes/pki/etcd/server.crt
    - --client-cert-auth=true
    - --data-dir=/var/lib/etcd
    - --initial-advertise-peer-urls=https://192.168.31.160:2380
    - --initial-cluster=k8s-01=https://192.168.31.160:2380
    - --key-file=/etc/kubernetes/pki/etcd/server.key
    - --listen-client-urls=https://127.0.0.1:2379,https://192.168.31.160:2379
    - --listen-metrics-urls=http://127.0.0.1:2381
    - --listen-peer-urls=https://192.168.31.160:2380
    - --name=k8s-01
    - --peer-cert-file=/etc/kubernetes/pki/etcd/peer.crt
    - --peer-client-cert-auth=true
    - --peer-key-file=/etc/kubernetes/pki/etcd/peer.key
    - --peer-trusted-ca-file=/etc/kubernetes/pki/etcd/ca.crt
    - --snapshot-count=10000
    - --trusted-ca-file=/etc/kubernetes/pki/etcd/ca.crt
    image: registry.cn-hangzhou.aliyuncs.com/lfy_k8s_imag
We can see that there is a configuration in the startup parameters --listen-metrics-urls=http://127.0.0.1:2381, which is to specify that the Metrics interface runs under port 2381, and it is an http protocol, so there is no need for any certificate configuration, which is much simpler than the previous version , the previous version needs to use the https protocol to access, so the corresponding certificate must be configured.
Note: What is monitored here is 127.0.0.1that it needs to be modified /etc/kubernetes/manifests/etcd.yaml, and it will --listen-metrics-urls=http://127.0.0.1:2381be modified to --listen-metrics-urls=http://0.0.0.0:2381, and the Pod (static Pod) will be automatically updated after editing.
2. Create a etcdcomponent serviceservice:
apiVersion: v1
kind: Service
metadata:
  name: etcd-k8s
  namespace: kube-system
  labels:
    k8s-app: etcd
spec:
  type: ClusterIP
  clusterIP: None  #设置为None,不分配Service IP
  ports:
  - name: port
    port: 2381
---
apiVersion: v1
kind: Endpoints
metadata:
  name: etcd-k8s
  namespace: kube-system
  labels:
    k8s-app: etcd
subsets:
- addresses:
  - ip: 192.168.31.160   # 指定etcd节点地址,如果是集群则继续向下添加
    nodeName: k8s-01
  ports:
  - name: port
    port: 2381         # Etcd 端口号
3. prometheusMonitoring access:
- job_name: 'kube-etcd'
   metrics_path: metrics
   scheme: http
   tls_config:
     ca_file: /var/run/secrets/kubernetes.io/serviceaccount/ca.crt
   bearer_token_file: /var/run/secrets/kubernetes.io/serviceaccount/token
   kubernetes_sd_configs:
   - role: endpoints
   relabel_configs:
   - source_labels: [__meta_kubernetes_service_name]
     regex: etcd-k8s
     action: keep
   - action: labelmap
     regex: __meta_kubernetes_pod_label_(.+)
4. prometheus targetCheck that the access to the collection point is normal through the interface:

5. Import 3973 或者 3070 dashboard, and ETCDthe component monitoring indicators will be displayed on the template.
Scheduler component monitoring
1. Create kube-schedulercomponents service:kube-scheduler.yaml
apiVersion: v1
kind: Service
metadata:
  namespace: kube-system
  name: kube-scheduler
  labels:
    k8s-app: kube-scheduler
spec:
  selector:
    component: kube-scheduler
  type: ClusterIP
  clusterIP: None
  ports:
  - name: http-metrics
    port: 10251
    targetPort: 10251
    protocol: TCP
2. Modify/etc/kubernetes/manifests/kube-scheduler.yaml
spec:
  containers:
  - command:
    - kube-scheduler
    - --authentication-kubeconfig=/etc/kubernetes/scheduler.conf
    - --authorization-kubeconfig=/etc/kubernetes/scheduler.conf
    - --bind-address=127.0.0.1
    - --kubeconfig=/etc/kubernetes/scheduler.conf
    - --leader-elect=true
    - --port=0
    image: registry.cn-hangzhou.aliyuncs.com/lfy_k8s_images/kube-scheduler:v1.21.0
    imagePullPolicy: IfNotPresent
    livenessProbe:
There are two main points of modification:
Will
--bind-address=127.0.0.1be modified to--bind-address=0.0.0.0, otherwise it will not be accessible externally.--portYou may have completely disabled the HTTP service using the flag to specify the port for--port=0the HTTP service, configured here--port=10251.
After the modification is complete, wait for the restart:
[root@k8s-01 kube-scheduler]# kubectl get pod -n kube-systemz -n kube-system -owide|grep kube-scheduler
kube-scheduler-k8s-01                     1/1     Running   0          5m37s   192.168.31.160   k8s-01   <none>           <none>
On the master node (k8s-01) where the kube-scheduler-k8s-01 component runs, check whether the port is enabled for listening:
[root@k8s-01 prometheus]# netstat -antp|grep 10251
tcp6       0      0 :::10251                :::*                    LISTEN      68892/kube-schedule
tcp6       0      0 192.168.31.160:10251    192.168.31.161:57196    ESTABLISHED 68892/kube-schedule
[root@k8s-01 prometheus]# netstat -antp|grep 10259
tcp6 0 0 :::10259 :::* LISTEN 68892/kube-schedule❝When --port=0 is disabled, only 10259 HTTPS listening port is enabled. After --port=10251 is configured, 10251 HTTP listening port will also be enabled.
❞
3. prometheusMonitoring access:
- job_name: 'kube-scheduler'
metrics_path: metrics
scheme: http
tls_config:
ca_file: /var/run/secrets/kubernetes.io/serviceaccount/ca.crt
insecure_skip_verify: false
bearer_token_file: /var/run/secrets/kubernetes.io/serviceaccount/token
kubernetes_sd_configs:
- role: endpoints
relabel_configs:
- source_labels: [__meta_kubernetes_service_name]
regex: kube-scheduler
action: keep
- action: labelmap
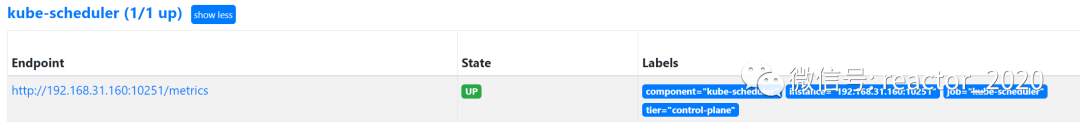
regex: __meta_kubernetes_pod_label_(.+)4. prometheus targetCheck that the access to the collection point is normal through the interface:
Controller Manager component
1. Create kube-schedulercomponents service:kubeControllerManager.yaml
apiVersion: v1
kind: Service
metadata:
  labels:
    k8s-app: kube-controller-manager
  name: kube-controller-manager
  namespace: kube-system
spec:
  selector:
    component: kube-controller-manager
  type: ClusterIP
  clusterIP: None
  ports:
  - name: https-metrics
    port: 10252
    targetPort: 10252
    protocol: TCP
2. Modify/etc/kubernetes/manifests/kube-controller-manager.yaml
spec:
  containers:
  - command:
    - kube-scheduler
    - --authentication-kubeconfig=/etc/kubernetes/scheduler.conf
    - --authorization-kubeconfig=/etc/kubernetes/scheduler.conf
    - --bind-address=127.0.0.1
    - --kubeconfig=/etc/kubernetes/scheduler.conf
    - --leader-elect=true
    - --port=0
    image: registry.cn-hangzhou.aliyuncs.com/lfy_k8s_images/kube-scheduler:v1.21.0
    imagePullPolicy: IfNotPresent
    livenessProbe:
There are two main points of modification:
Will
--bind-address=127.0.0.1be modified to--bind-address=0.0.0.0, otherwise it will not be accessible externally.--portYou may have completely disabled the HTTP service using the flag to specify the port for--port=0the HTTP service, configured here--port=10252.
After the modification is complete, wait for the restart:
[root@k8s-01 manifests]# kubectl get pod -n kube-systemz -n kube-system -owide|grep kube-controller-manager
kube-controller-manager-k8s-01            1/1     Running   0          35s    192.168.31.160   k8s-01   <none>           <none>
Check whether the port is enabled for listening on the node ( ) where kube-controller-manager-k8s-01the component is running :masterk8s-01
[root@k8s-01 manifests]# netstat -antp|grep 10252
tcp6       0      0 :::10252                :::*                    LISTEN      125547/kube-control
[root@k8s-01 manifests]# netstat -antp|grep 10257
tcp6 0 0 :::10257 :::* LISTEN 125547/kube-control❝When --port=0 is disabled, only 10257 HTTPS listening port is enabled, and after --port=10251 is configured, 10252 HTTP listening port is also enabled.
❞
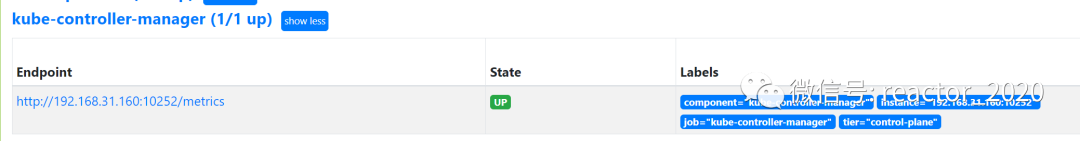
3. prometheusMonitoring access:
- job_name: 'kube-controller-manager'
   metrics_path: metrics
   scheme: http
   tls_config:
     ca_file: /var/run/secrets/kubernetes.io/serviceaccount/ca.crt
     insecure_skip_verify: false
   bearer_token_file: /var/run/secrets/kubernetes.io/serviceaccount/token
   kubernetes_sd_configs:
   - role: endpoints
   relabel_configs:
   - source_labels: [__meta_kubernetes_service_name]
     regex: kube-controller-manager
     action: keep
   - action: labelmap
     regex: __meta_kubernetes_pod_label_(.+)
4. prometheus targetCheck that the access to the collection point is normal through the interface:
kubelet-component
kubeletComponent integration exposes container performance indicators cAdvisorthrough endpoints, and components also expose their own component indicators through endpoints./metrics/cadvisorkubelet/metrics
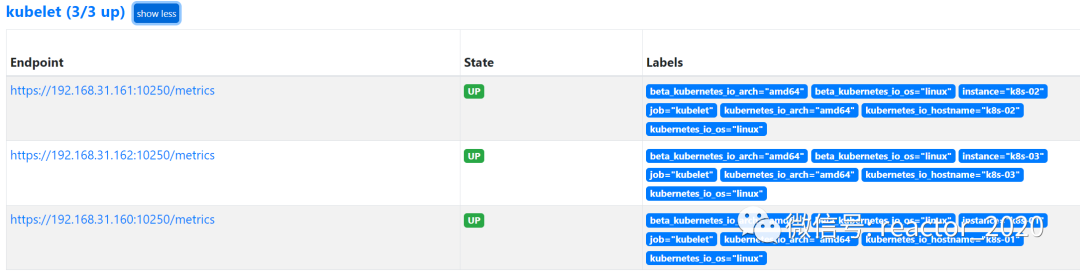
1. prometheusMonitoring access:
- job_name: "kubelet"
  kubernetes_sd_configs:
    - role: node
  scheme: https
  tls_config:
    ca_file: /var/run/secrets/kubernetes.io/serviceaccount/ca.crt
    insecure_skip_verify: true
  bearer_token_file: /var/run/secrets/kubernetes.io/serviceaccount/token
  relabel_configs:
    - action: labelmap
      regex: __meta_kubernetes_node_label_(.+)
      replacement: $1
    - replacement: /metrics
      target_label: __metrics_path__
2. prometheus targetCheck that the access of the collection point is normal through the interface:
kube-proxy component
kube-proxyTwo ports are exposed by default, one is 10249, which exposes monitoring indicators at the /metrics endpoint, and the other is 10256. netstatYou can check if these two ports are listening with the command:
[root@k8s-01 prometheus]# netstat -antp|grep 10256
tcp6       0      0 :::10256                :::*                    LISTEN      101021/kube-proxy
[root@k8s-01 prometheus]# netstat -antp|grep 10249
tcp        0      0 127.0.0.1:10249         0.0.0.0:*               LISTEN      101021/kube-proxy
If you need to modify the listening port, modify it kubectl edit configmap kube-proxy -n kube-system, just metricsBindAddressmodify this paragraph metricsBindAddress: 0.0.0.0:10249. Default monitoring 127.0.0.1, modify:
metricsBindAddress: 0.0.0.0:10249Then restart kube-proxythis pod:
[root@k8s-01 prometheus]# kubectl get pods -n kube-system | grep kube-proxy |awk '{print $1}' | xargs kubectl delete pods -n kube-system
pod "kube-proxy-75h6q" deleted
pod "kube-proxy-jhnbg" deleted
pod "kube-proxy-s8jmc" deleted
[root@k8s-01 prometheus]# kubectl get pod -n kube-system|grep kube-proxy
kube-proxy-s8nhd                          1/1     Running   0          42s
kube-proxy-wx6vg                          1/1     Running   0          44s
kube-proxy-xcq4t 1/1 Running 0 44snetstatUse detection 10249 to listen to 0.0.0.0 again :
[root@k8s-01 prometheus]# netstat -antp|grep 10249
tcp6       0      0 :::10249                :::*                    LISTEN      109228/kube-proxy
tcp6       0      0 192.168.31.160:10249    192.168.31.161:57096    ESTABLISHED 109228/kube-proxy
1. Create service:
# vi kube-proxy-service.yaml
apiVersion: v1
kind: Service
metadata:
labels:
k8s-app: kube-proxy
name: kube-proxy
namespace: kube-system
spec:
selector:
k8s-app: kube-proxy
type: ClusterIP
clusterIP: None
ports:
- name: https-metrics
port: 10249
targetPort: 10249
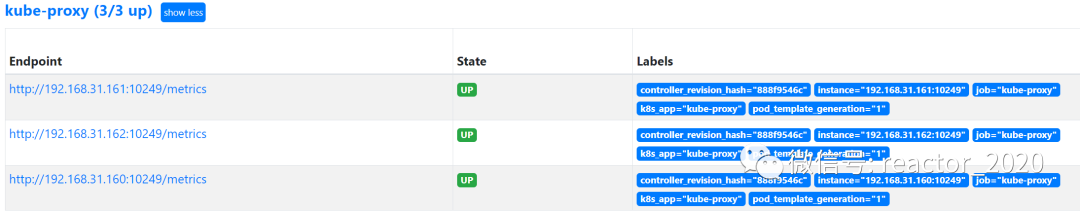
protocol: TCP2. prometheusMonitoring access:
- job_name: 'kube-proxy'
   metrics_path: metrics
   scheme: http
   tls_config:
     ca_file: /var/run/secrets/kubernetes.io/serviceaccount/ca.crt
     insecure_skip_verify: false
   bearer_token_file: /var/run/secrets/kubernetes.io/serviceaccount/token
   kubernetes_sd_configs:
   - role: endpoints
   relabel_configs:
   - source_labels: [__meta_kubernetes_service_name]
     regex: kube-proxy
     action: keep
   - action: labelmap
     regex: __meta_kubernetes_pod_label_(.+)
3. prometheus targetCheck that the access of the collection point is normal through the interface:
CoreDNS
kubernetesThe plug-ins that are very important in the cluster CoreDNSare generally enabled by default /metrics. Interface:
kubectl get cm coredns -n kube-system -o yamlConfigMapThe above prometheus :9153is the enabled prometheusplugin:
[root@k8s-01 ~]# kubectl get pods -n kube-system -l k8s-app=kube-dns -o wide
NAME                      READY   STATUS    RESTARTS   AGE   IP               NODE     NOMINATED NODE   READINESS GATES
coredns-b98666c6d-cdhwp   1/1     Running   2          80d   192.165.61.208   k8s-01   <none>           <none>
coredns-b98666c6d-zmg8t   1/1     Running   2          80d   192.165.61.206   k8s-01   <none>           <none>
We can try to access the interface manually first /metrics. If we can access it manually, it proves that there is no problem with the interface:
[root@k8s-01 ~]# curl http://192.165.61.208:9153/metrics|more
# TYPE coredns_build_info gauge
coredns_build_info{goversion="go1.15.3",revision="054c9ae",version="1.8.0"} 1
# HELP coredns_cache_entries The number of elements in the cache.
# TYPE coredns_cache_entries gauge
coredns_cache_entries{server="dns://:53",type="denial"} 31
coredns_cache_entries{server="dns://:53",type="success"} 7
# HELP coredns_cache_hits_total The count of cache hits.
# TYPE coredns_cache_hits_total counter
coredns_cache_hits_total{server="dns://:53",type="denial"} 23
coredns_cache_hits_total{server="dns://:53",type="success"} 6
# HELP coredns_cache_misses_total The count of cache misses.
# TYPE coredns_cache_misses_total counter
coredns_cache_misses_total{server="dns://:53"} 468
We can see that it can be accessed normally, and the CoreDNSmonitoring data interface we can see from here is normal, and then we can configure this /metricsinterface into prometheus.yml.
By default, components kube-systemare created under the namespace :CoreDNSservice
[root@k8s-01 kube-dns]# kubectl get svc -n kube-system|grep dns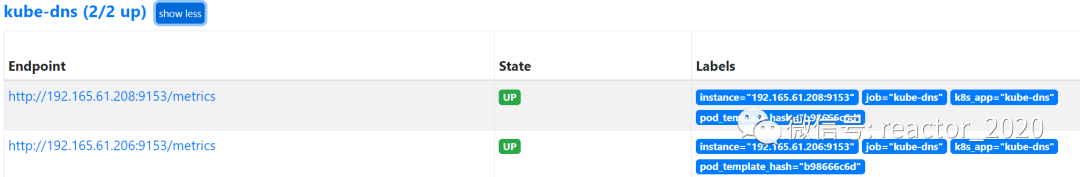
kube-dns ClusterIP 10.96.0.10 <none> 53/UDP,53/TCP,9153/TCP 520dCoreDNSComponent monitoring access configuration:
- job_name: 'kube-dns'
   metrics_path: metrics
   scheme: http
   tls_config:
     ca_file: /var/run/secrets/kubernetes.io/serviceaccount/ca.crt
     insecure_skip_verify: false
   bearer_token_file: /var/run/secrets/kubernetes.io/serviceaccount/token
   kubernetes_sd_configs:
   - role: endpoints
   relabel_configs:
   - source_labels: [__meta_kubernetes_service_name]
     regex: kube-dns
     action: keep
   - source_labels: [__meta_kubernetes_endpoint_port_name]
     regex: metrics
     action: keep
   - action: labelmap
     regex: __meta_kubernetes_pod_label_(.+)
Check that the collection point access is normal through prometheus targetthe interface:

[For more cloud-native monitoring and operation and maintenance, please pay attention to the WeChat public account: cloud-native ecological laboratory]