Through more than a month of hard work, the FullGC has been optimized from 40 times per day to nearly 10 days, and the YoungGC time has been reduced by more than half. For such a large optimization, it is necessary to record the intermediate tuning process.
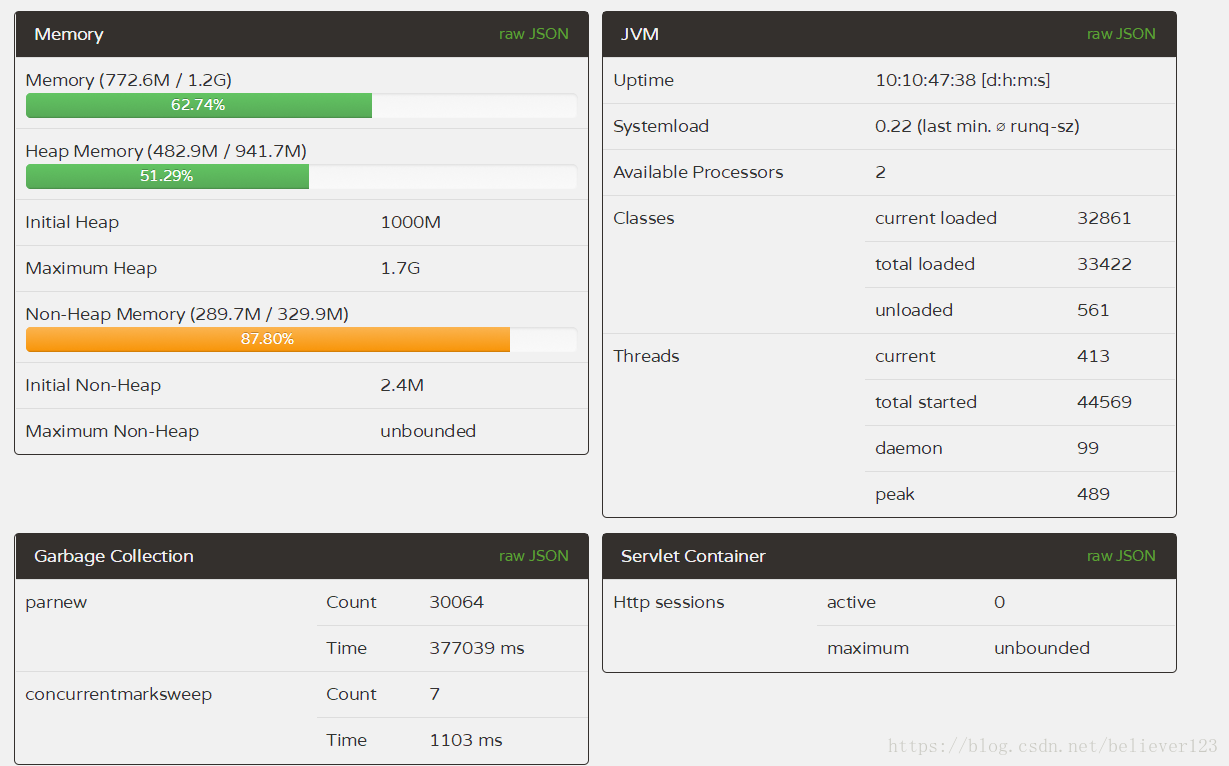
For JVM garbage collection, it has always been in the theoretical stage before, and we know the promotion relationship between the new generation and the old generation. This knowledge is only enough for interviews. Some time ago, the FullGC of the online server was very frequent, with an average of more than 40 times a day, and the server automatically restarted every few days, which shows that the state of the server is very abnormal. To get such a good opportunity, of course, you must take the initiative Tuning is requested. The server GC data before tuning, FullGC is very frequent.
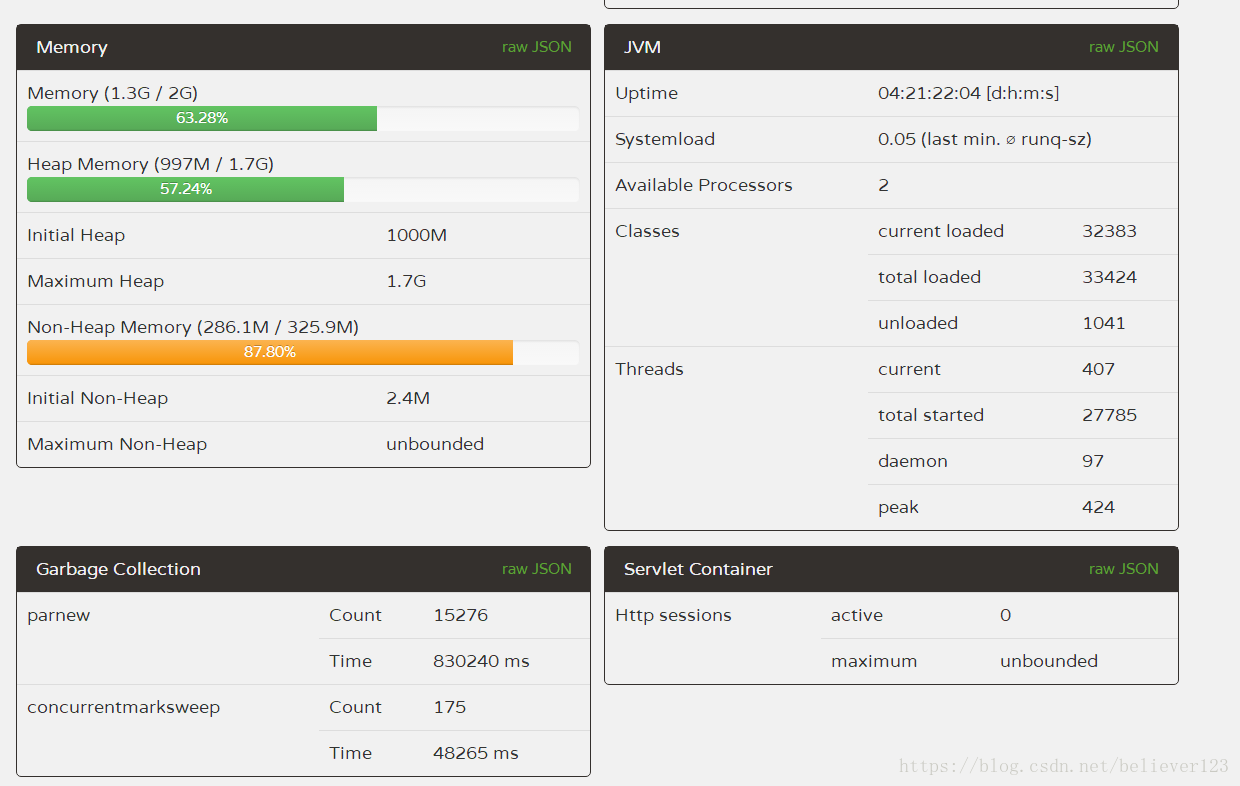
First of all, the configuration of the server is very general (2 cores 4G), a total of 4 server clusters. The number and time of FullGC for each server are basically the same. Among them, the startup parameters of several JVM cores are:
-Xms1000M -Xmx1800M -Xmn350M -Xss300K -XX:+DisableExplicitGC -XX:SurvivorRatio=4 -XX:+UseParNewGC -XX:+UseConcMarkSweepGC -XX:CMSInitiatingOccupancyFraction=70 -XX:+CMSParallelRemarkEnabled -XX:LargePageSizeInBytes=128M -XX:+UseFastAccessorMethods -XX:+UseCMSInitiatingOccupancyOnly -XX:+PrintGCDetails -XX:+PrintGCTimeStamps -XX:+PrintHeapAtGC
-Xmx1800M: Set the maximum available memory of the JVM to 1800M.
-Xms1000m: Set the JVM initialization memory to 1000m. This value can be set the same as -Xmx to avoid JVM to reallocate memory after each garbage collection completes.
-Xmn350M: Set the young generation size to 350M. The entire JVM memory size = young generation size + old generation size + permanent generation size. The permanent generation generally has a fixed size of 64m, so increasing the young generation will reduce the size of the old generation. This value has a great impact on system performance, and Sun officially recommends configuring it as 3/8 of the entire heap.
-Xss300K: Set the stack size for each thread. After JDK5.0, the stack size of each thread is 1M, and the stack size of each thread was 256K before. Adjust the memory size required by more application threads. Under the same physical memory, reducing this value can generate more threads. However, the operating system still has a limit on the number of threads in a process, and it cannot be generated infinitely. The experience value is around 3000~5000.
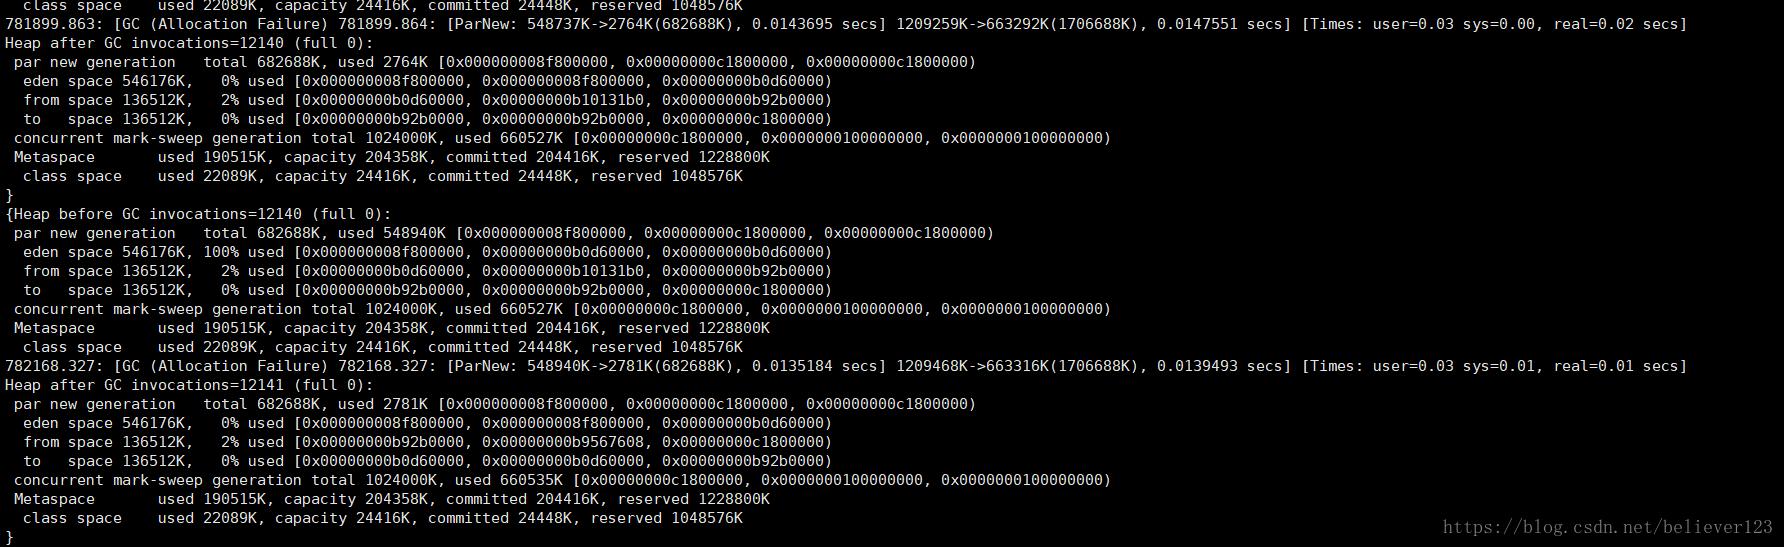
first optimization
Looking at the parameters, I immediately feel why the new generation is so small, and how to improve the throughput if it is so small, and it will cause frequent triggering of YoungGC. The collection of the new generation as above takes 830s. The initial heap memory is not consistent with the maximum heap memory. After consulting various materials, it is recommended to set these two values to be the same, which can prevent memory reallocation after each GC. Based on the previous knowledge, the first online tuning was carried out: increase the size of the new generation, and set the initial heap memory to the maximum memory
-Xmn350M -> -Xmn800M
-XX:SurvivorRatio=4 -> -XX:SurvivorRatio=8
-Xms1000m ->-Xms1800m
The original intention of changing SurvivorRatio to 8 is to let as much garbage as possible be recycled in the new generation. In this way, after deploying the configuration to two online servers (prod, prod2, the other two remain unchanged for comparison), after running for 5 days, observing the GC results, the number of YoungGC has been reduced by more than half, and the time has been reduced by 400s, but FullGC The average number of times increased by 41 times. YoungGC is basically in line with expectations, but this FullGC is completely dead.
In this way, the first optimization failed.
Second optimization
During the optimization process, our supervisor found that there are more than 10,000 instances of an object T in memory, and these instances occupy nearly 20M of memory. So according to the use of this bean object, the reason was found in the project: caused by anonymous inner class reference, the pseudo code is as follows:
public void doSmthing(T t){
	redis.addListener(new Listener(){
		public void onTimeout(){
			if(t.success()){
				//执行操作
			}
		}
	});
}
Since the listener will not be released after the callback, and the callback is a timeout operation, the callback will only be performed when an event exceeds the set time (1 minute), which will cause the object T to never be recycled, so the memory There will be so many object instances in .
After discovering a memory leak through the above example, first check the error log file in the program, and first resolve all error events. Then after the re-release, the GC operation remained basically unchanged. Although a little memory leak problem was solved, it can be explained that the root cause was not solved, and the server continued to restart inexplicably.
memory leak investigation
After the first tuning, a memory leak problem was found, so everyone started to investigate the memory leak, and first checked the code, but this efficiency was quite low, and basically no problems were found. So I continued to dump the memory when the line was not very busy, and finally caught a large object.
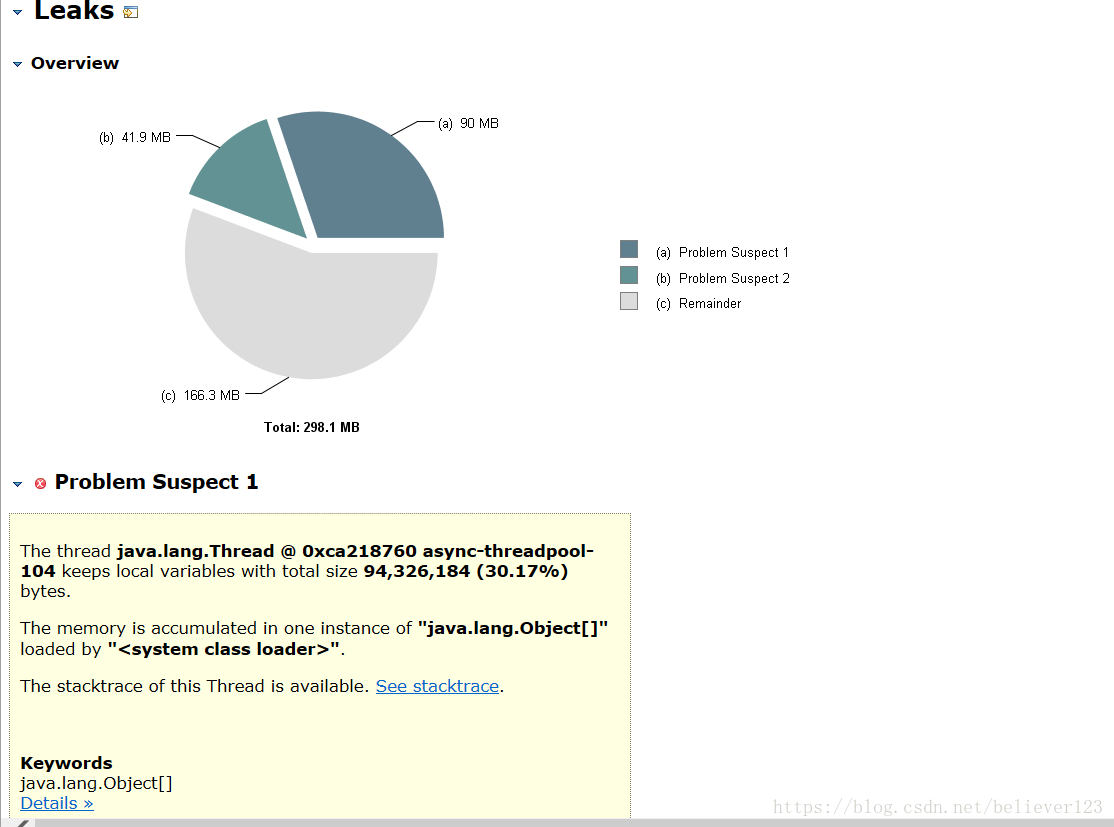

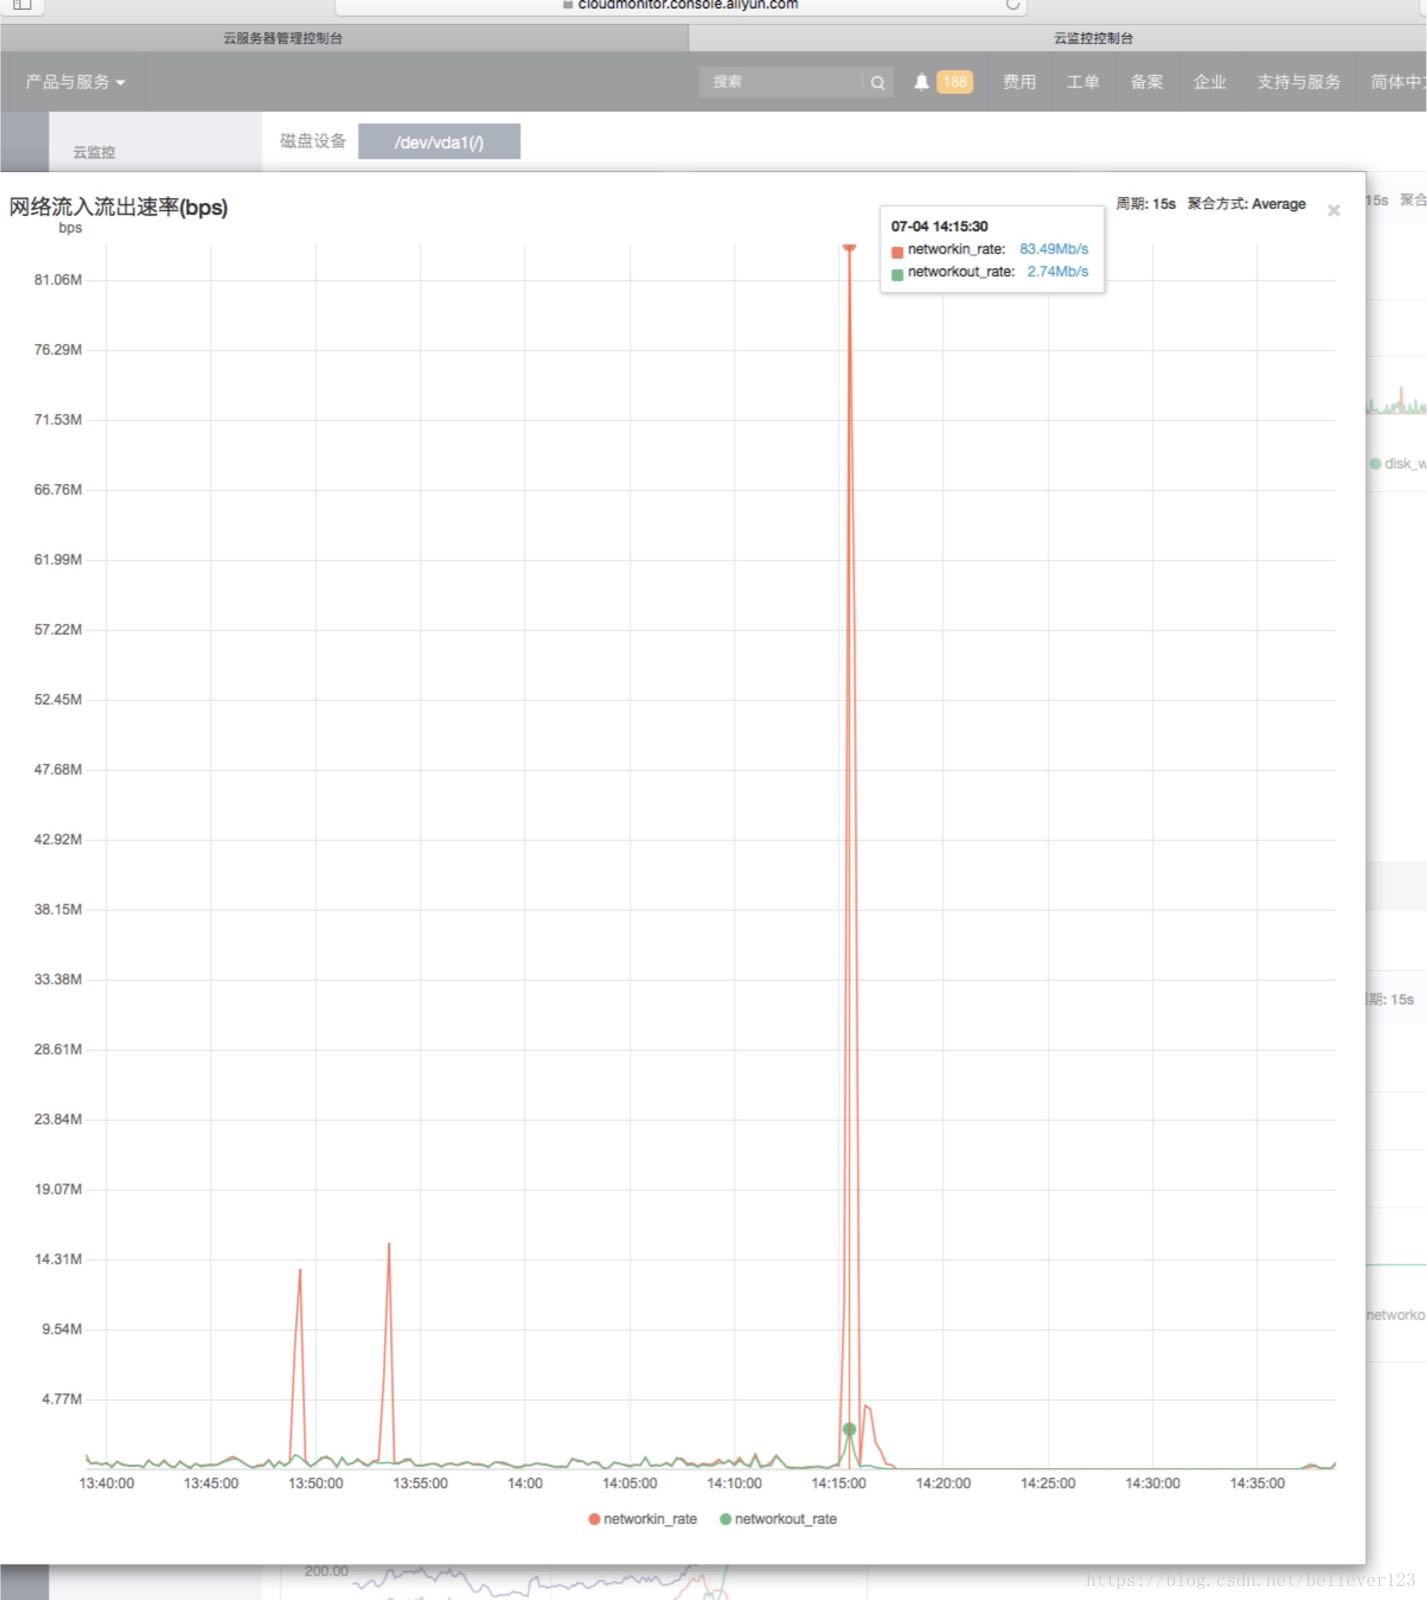
There are more than 4W objects, and they are all ByteArrowRow objects. It can be confirmed that these data are generated during database query or insertion. So another round of code analysis was carried out. During the code analysis, colleagues in the operation and maintenance found that the entrance traffic had doubled several times at a certain time of the day, and it was as high as 83MB/s. After some confirmation, there is no such thing at present. There is a large amount of business, and there is no file upload function. Consulting Alibaba Cloud customer service also showed that the traffic is completely normal, and the possibility of an attack can be ruled out.
While I was still investigating the problem of ingress traffic, another colleague found the root cause. It turned out that under a certain condition, all unprocessed specified data in the table would be queried, but because the where condition was less added when querying The condition of the module is met, resulting in more than 400,000 queries, and by viewing the requests and data at that time through the log, it can be judged that this logic has indeed been executed. There are only more than 4W objects in the dumped memory. This is Because so many were queried during the dump, and the rest were still being transmitted. And this can also explain very well why the server will automatically restart.
After solving this problem, the online server is running completely normally. With the parameters before tuning, it has been running for about 3 days and there are only 5 times of FullGC.
Second tuning
The problem of memory leaks has been solved, and the rest can be tuned. After checking the GC log, it was found that during the first three GullGCs, the memory occupied by the old generation was less than 30%, but FullGC occurred. So I conducted a survey of various materials. In the https://blog.csdn.net/zjwstz/article/details/77478054 blog, it is very clear and clear that the metaspace leads to FullGC. The default metaspace of the server is 21M. In the GC log Seeing that the metaspace occupied about 200M when it was the largest, we performed the following adjustments. The following are the modified parameters of prod1 and prod2, and prod3 and prod4 remain unchanged
-Xmn350M -> -Xmn800M
-Xms1000M ->1800M
-XX:MetaspaceSize=200M
-XX:CMSInitiatingOccupancyFraction=75
and
-Xmn350M -> -Xmn600M
-Xms1000M ->1800M
-XX:MetaspaceSize=200M
-XX:CMSInitiatingOccupancyFraction=75
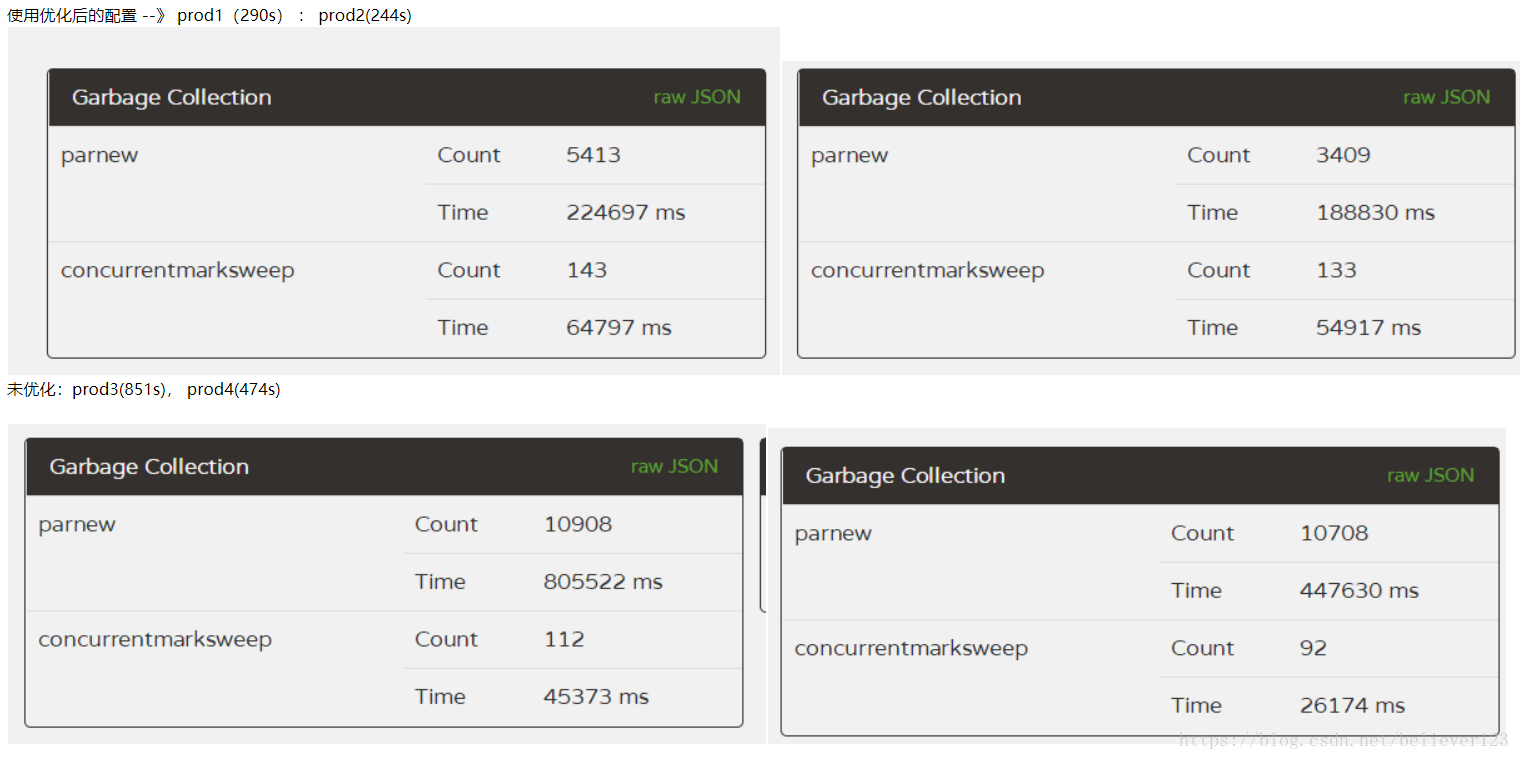
prod1 and 2 are only different in the size of the new generation, and the others are the same. It has been running online for about 10 days for comparison:
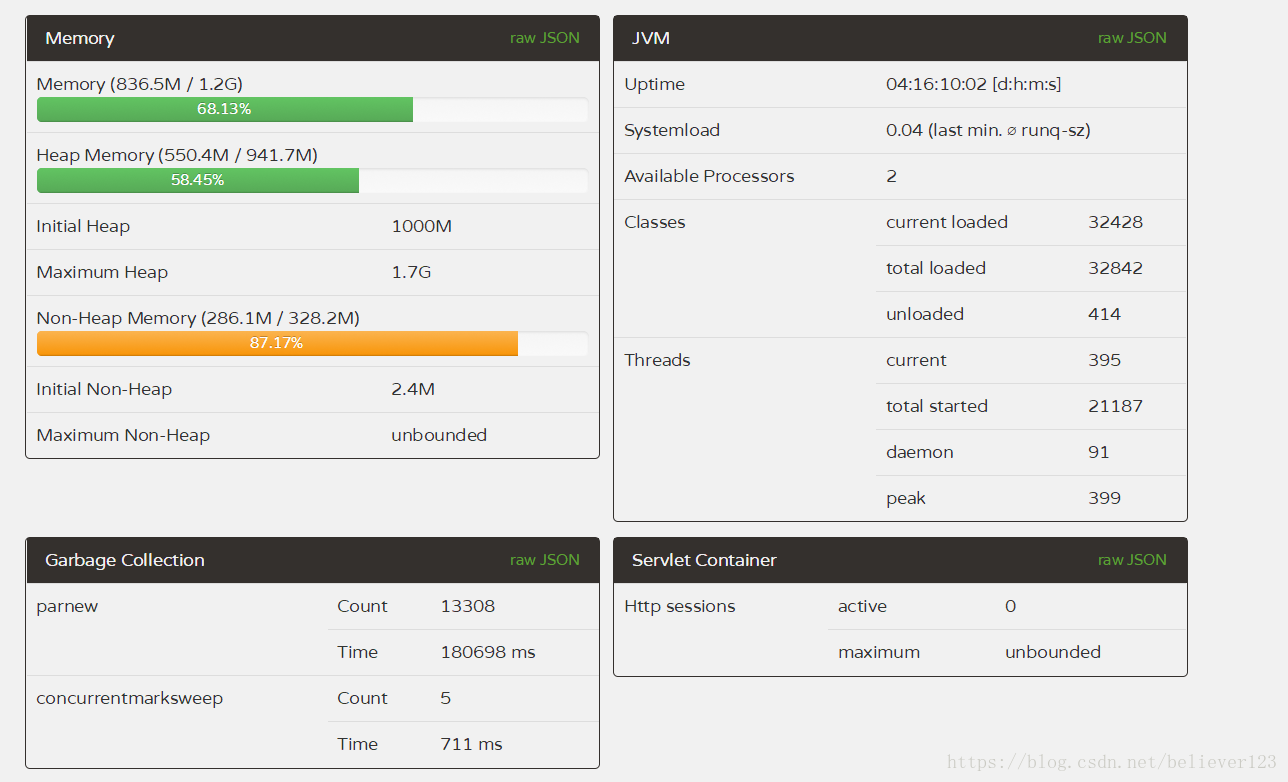
prod1:
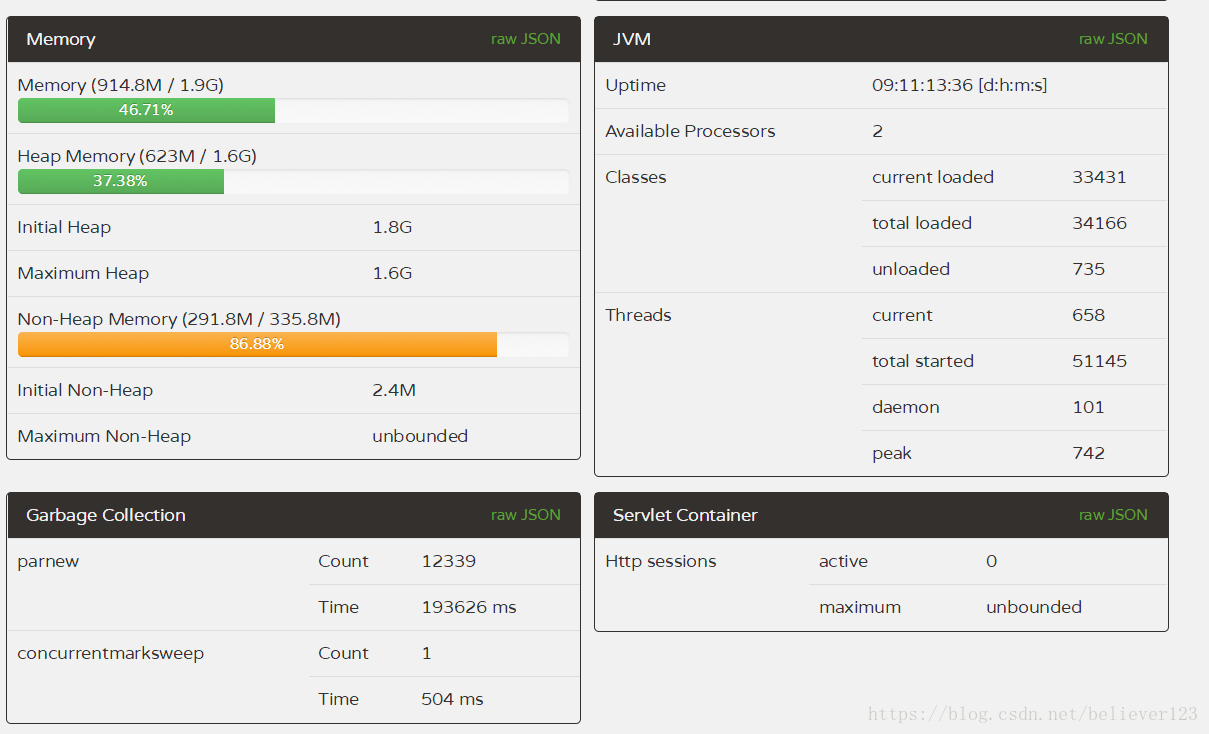
prod2:
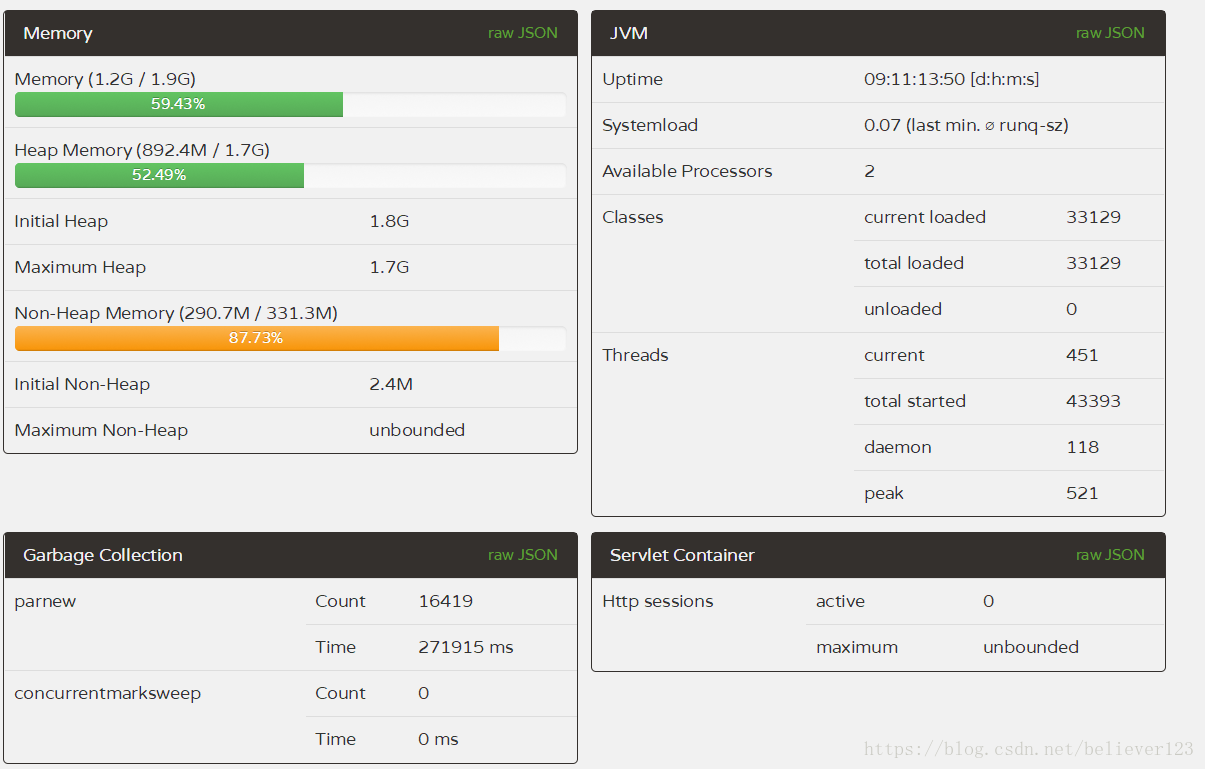
prod3:
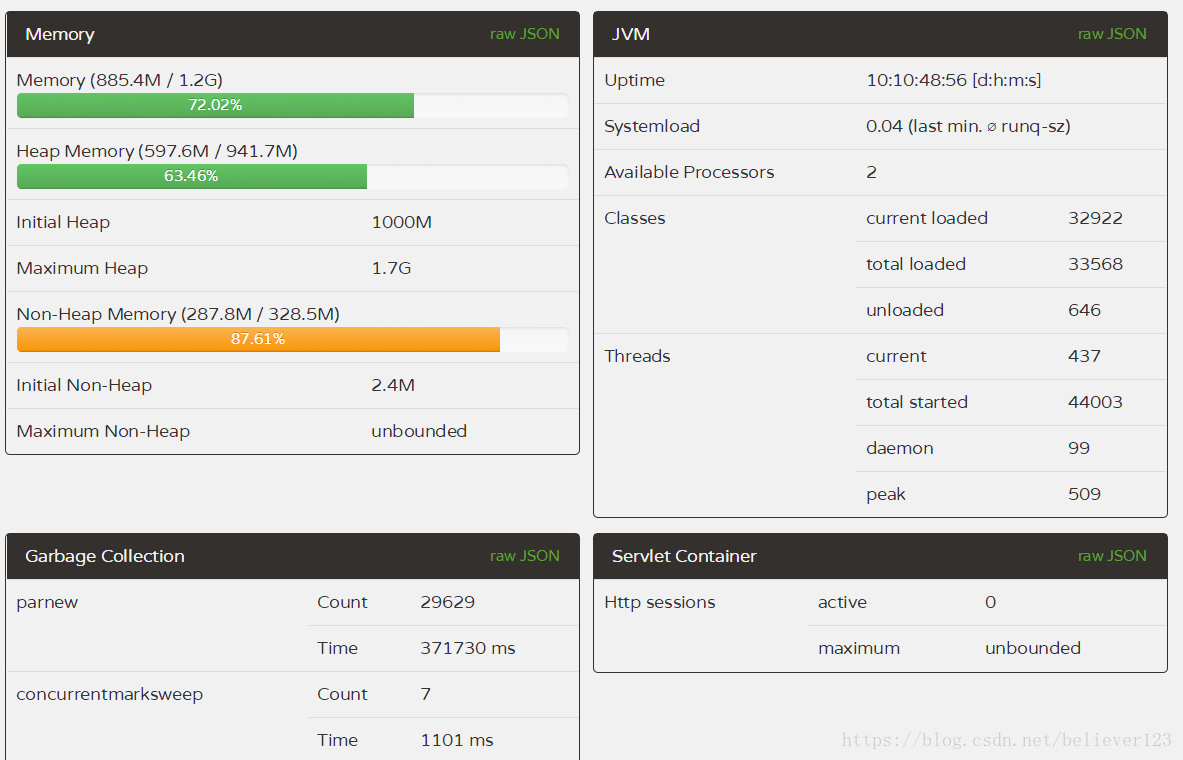
prod4:
In comparison, the FullGC of the two servers 1 and 2 is far lower than that of the two servers 3 and 4, and the YoungGC of the two servers 1 and 2 is also reduced by about half compared with 3 and 4, and the efficiency of the first server is more obvious. In addition to the reduction in the number of YoungGC, and the throughput is higher than that of 3 and 4 that have been running for one more day (through the number of thread starts), it shows that the throughput of prod1 is particularly improved.
Through the number of GC times and GC time, this optimization is declared successful, and the configuration of prod1 is better, which greatly improves the throughput of the server and reduces the GC time by more than half .
The only FullGC in prod1:

I can't see the reason through the GC log. The old generation only occupied about 660M when cms remarked. This should not be the condition to trigger FullGC, and through the previous YoungGC investigations, the promotion of large memory objects was also ruled out. It is possible that the size of the metaspace does not meet the conditions of GC. This still needs to be investigated further. Anyone who knows is welcome to point it out. Thanks in advance.
Summarize
Through this more than a month of tuning, the following points are summarized:
- FullGC more than once a day is definitely not normal.
- When it is found that FullGC is frequent, the priority is to investigate memory leaks.
- After the memory leak is resolved, there is less room for jvm tuning, which is fine for learning, otherwise don't invest too much time.
- If you find that the CPU continues to be high, you can consult the operation and maintenance customer service of Alibaba Cloud after troubleshooting the code problem. During this investigation, it was found that 100% of the CPU was caused by a server problem. After the server migration, it will be normal.
- Data query is also counted as the ingress traffic of the server. If there is not such a large amount of access business and there is no attack problem, you can investigate the database.
- It is necessary to pay attention to the GC of the server from time to time, so that problems can be found early.