1. Write a java calling program
//http://localhost:8945/api/ExecPy/ExecPyPollutionRadarMap
@ApiOperation(value = "ExecPy")
@GetMapping(value = "/ExecPyPollutionRadarMap")
public String ExecPyPollutionRadarMap() {
    String  scriptpath="F:\\demo\\Radar\\Radarplot1.py";
    try {
        this.execPython(scriptpath,"202202", UUID.randomUUID().toString());
    } catch (IOException e) {
        e.printStackTrace();
    } catch (InterruptedException e) {
        e.printStackTrace();
    }
    return "success";
}
2. Photoelectric radar data analysis json
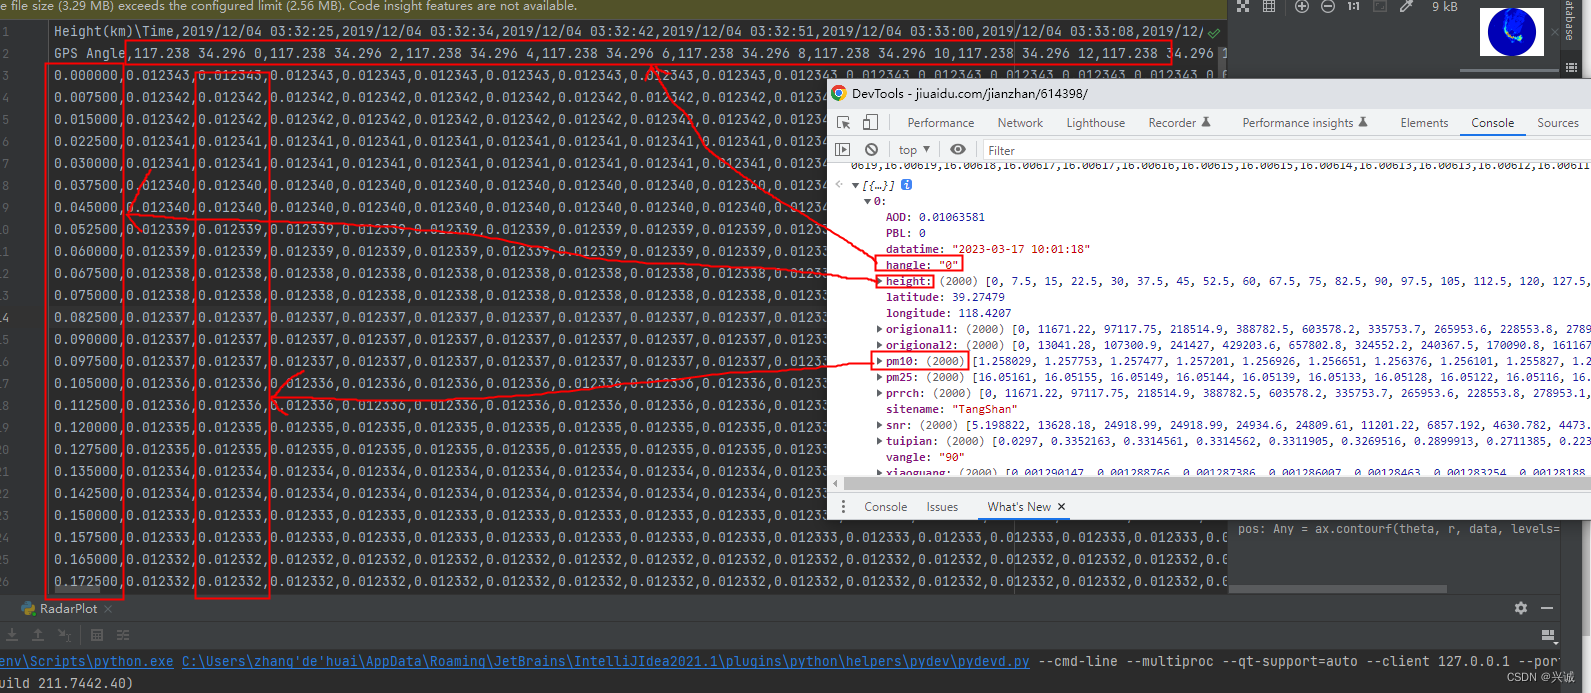
| field description |
|||
| field |
name |
Data length |
|
| sitename |
Site name |
1 |
|
| datatime |
Data collection time |
1 |
|
| longitude |
1 |
||
| latitude |
1 |
||
| height |
high |
2000 |
|
| Xiaoguang |
extinction |
2000 |
|
| tuipian |
Depolarization |
2000 |
|
| prrch |
echo signal |
2000 |
|
| origional1 |
Original information P channel |
2000 |
|
| Origional2 |
raw information channel |
2000 |
|
| snr |
SNR |
2000 |
|
| pm10 |
PM10 |
2000 |
|
| pm25 |
PM2.5 |
2000 |
|
| AOD |
AOD |
1 |
|
| yundigao |
high cloud base |
1 |
|
| PBL |
PBL |
1 |
|
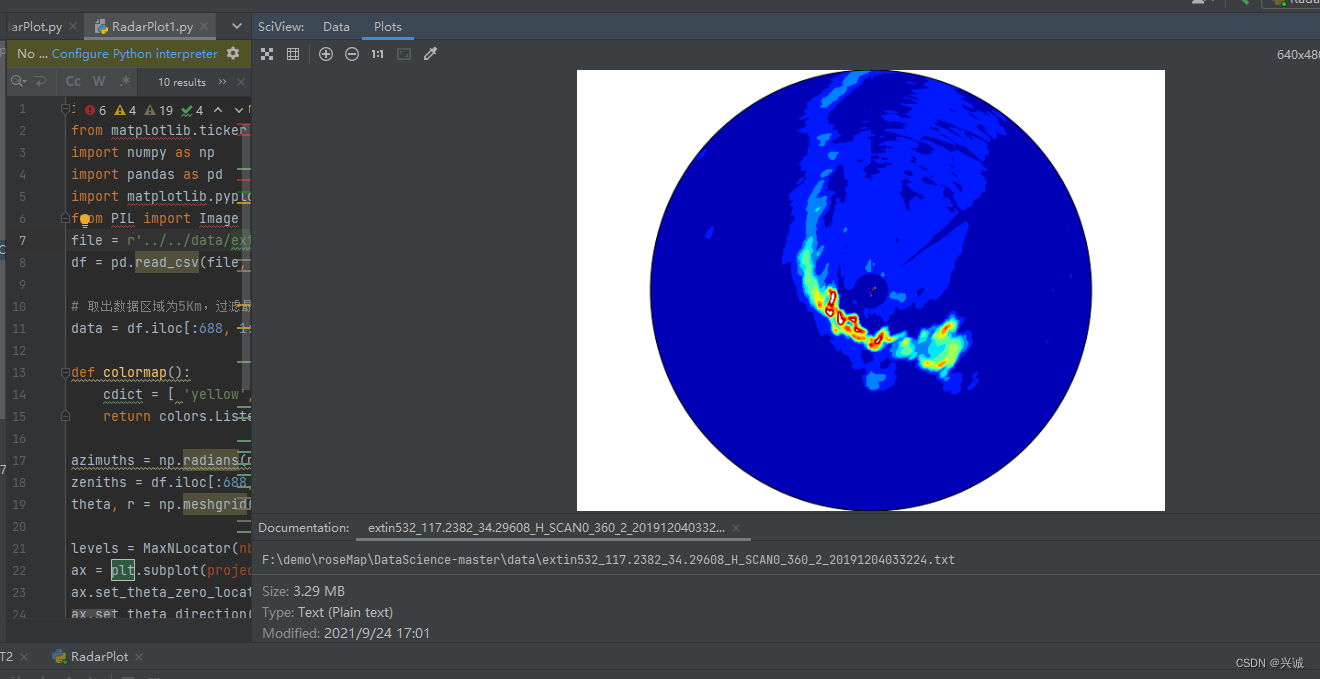
3. Write python code to generate radar chart
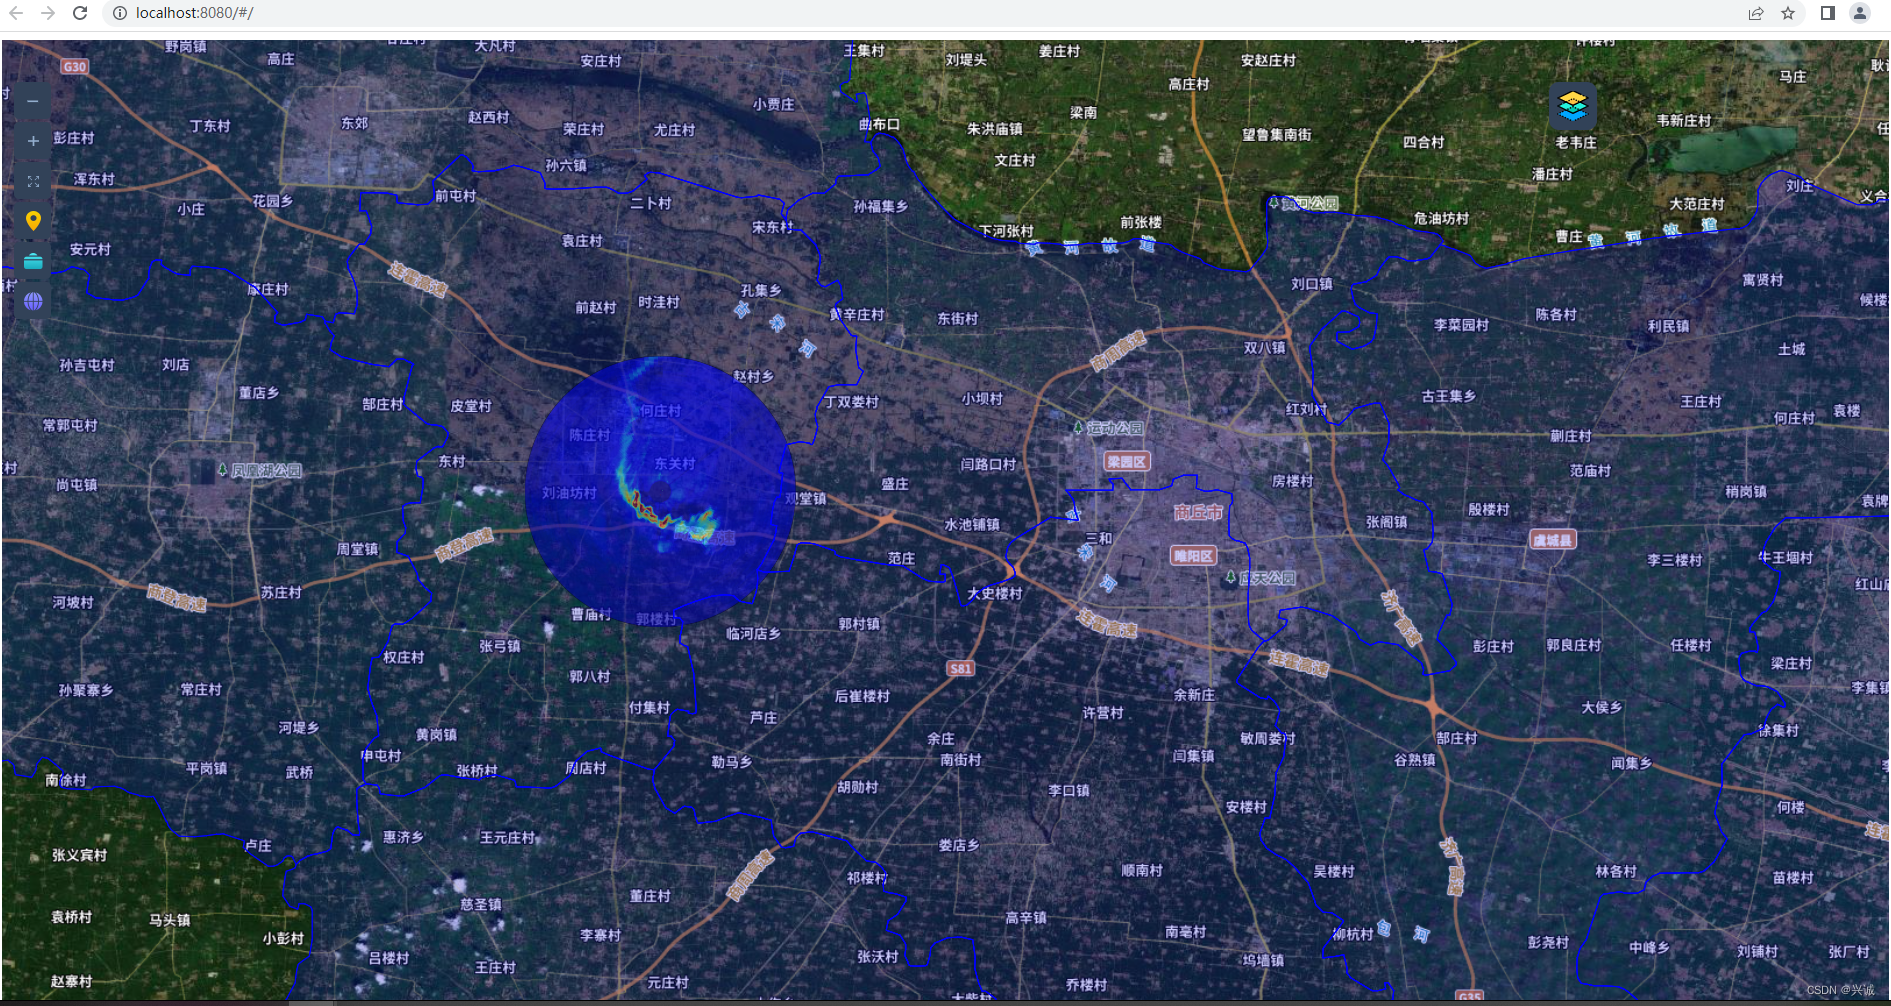
Map front-end call visual display
If it is helpful to you, please like and reward support!
Technical cooperation exchange qq: 2401315930