[TikZ Simple Learning (Part 2): Basic Drawing] Drawing macro package under Latex

above

draw multiple nodes

  • Method 1:
    Use \path A node[attr]{info}to draw multiple nodes, where the nodes have nothing to do with the "path"
\documentclass{
    
    article}
\usepackage{
    
    tikz}
\begin{
    
    document}
\begin{
    
    tikzpicture}
	\path 	( 0,2) node [shape=circle,draw] {
    
    }
			( 0,1) node [shape=circle,draw] {
    
    }
			( 0,0) node [shape=circle,draw] {
    
    }
			( 1,1) node [shape=rectangle,draw] {
    
    }
			(-1,1) node [shape=rectangle,draw] {
    
    };
\end{
    
    tikzpicture}
\end{
    
    document}

insert image description here

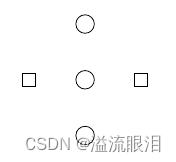
  • Method 2:
    \nodeIt is \path nodethe omission of , which needs to be added here at, that is, as
    \node at A [attr]{info};
    mentioned earlier, [draw]the meaning is and the meaning of drawing. Here [shape=circle]can be abbreviated as[circle]
\documentclass{
    
    article}
\usepackage{
    
    tikz}
\begin{
    
    document}
\begin{
    
    tikzpicture}
	\node at ( 0,2) [circle,draw] {
    
    };
	\node at ( 0,1) [circle,draw] {
    
    };
	\node at ( 0,0) [circle,draw] {
    
    };
	\node at ( 1,1) [rectangle,draw] {
    
    };
	\node at (-1,1) [rectangle,draw] {
    
    };
\end{
    
    tikzpicture}
\end{
    
    document}

Add a unified style to the node

  • There is no text in the node, why does the node still have a size? Since TikZthe automatically adds some space around the text inner sep
    , you can change the [inner sep = 0pt]to modify things like that.
    But to make sure the node is displayed properly, set its minimum size[minumun size = 6mm]
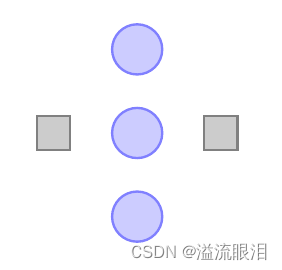
  • Then it is to set a unified style [XXX/.style={……}].
\documentclass{
    
    article}
\usepackage{
    
    tikz}
\begin{
    
    document}
\begin{
    
    tikzpicture}
	[place/.style={
    
    circle,draw=blue!50,fill=blue!20,thick,
		inner sep=0pt,minimum size=6mm},
		transition/.style={
    
    rectangle,draw=black!50,fill=black!20,thick,
		inner sep=0pt,minimum size=4mm}]
	\node at ( 0,2) [place] {
    
    };
	\node at ( 0,1) [place] {
    
    };
	\node at ( 0,0) [place] {
    
    };
	\node at ( 1,1) [transition] {
    
    };
	\node at (-1,1) [transition] {
    
    };
\end{
    
    tikzpicture}
\end{
    
    document}

insert image description here

name the node

  • Naming the nodes can save convenience for subsequent operations, and there is no need to calculate the coordinate drawing separately.
    (name), Note that the name cannot have special characters, etc., and can have underscores and hyphens.
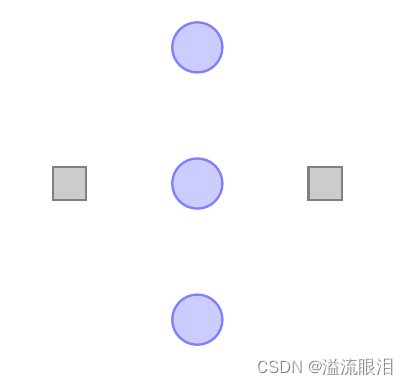
  • TikiZThe syntax is relatively loose for the order of multiple parallel attributes, such as \node [A] (B) at Cor \node (B) [A] at Cand the like.
\documentclass{
    
    article}
\usepackage{
    
    tikz}
\begin{
    
    document}
\begin{
    
    tikzpicture}
	[place/.style={
    
    circle,draw=blue!50,fill=blue!20,thick,
		inner sep=0pt,minimum size=6mm},
		transition/.style={
    
    rectangle,draw=black!50,fill=black!20,thick,
		inner sep=0pt,minimum size=4mm}]

	\node[place] (waiting 1) at ( 0,2) {
    
    };
	\node[place] (critical 1) at ( 0,1) {
    
    };
	\node[place] (semaphore) at ( 0,0) {
    
    };
	\node[transition] (leave critical) at ( 1,1) {
    
    };
	\node[transition] (enter critical) at (-1,1) {
    
    };

\end{
    
    tikzpicture}
\end{
    
    document}

draw with relative position

  • Many coordinates are given above, in fact, we can also draw by relative position
    Need to import \usetikzlibrary {positioning}, and then use the following syntax:
    [below = of name], [right = of name]etc., the distance between them is node distance, the default is the distance between the centers of nodes, or the distance between boundaries distance.
\documentclass{
    
    article}
\usepackage{
    
    tikz}
\usetikzlibrary {
    
    positioning}

\begin{
    
    document}
\begin{
    
    tikzpicture}
	[place/.style={
    
    circle,draw=blue!50,fill=blue!20,thick,
		inner sep=0pt,minimum size=6mm},
		transition/.style={
    
    rectangle,draw=black!50,fill=black!20,thick,
		inner sep=0pt,minimum size=4mm}]

	\node[place] (waiting) {
    
    };
	\node[place] (critical) [below=of waiting] {
    
    };
	\node[place] (semaphore) [below=of critical] {
    
    };
	\node[transition] (leave critical) [right=of critical] {
    
    };
	\node[transition] (enter critical) [left=of critical] {
    
    };
\end{
    
    tikzpicture}
\end{
    
    document}

insert image description here

label the node

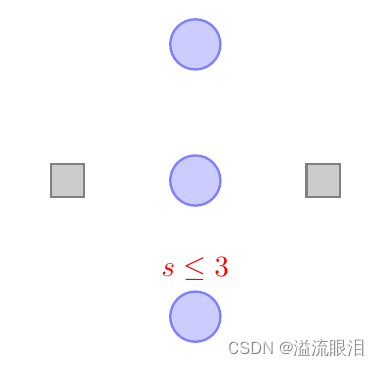
  • Method 1:
    Add a node with a surname, set the attribute to [red,above], add it to (semaphore.north)the north of a node, and the text information is{s \e 3}
\documentclass{
    
    article}
\usepackage{
    
    tikz}
\usetikzlibrary {
    
    positioning}

\begin{
    
    document}
\begin{
    
    tikzpicture}
	[place/.style={
    
    circle,draw=blue!50,fill=blue!20,thick,
		inner sep=0pt,minimum size=6mm},
		transition/.style={
    
    rectangle,draw=black!50,fill=black!20,thick,
		inner sep=0pt,minimum size=4mm}]

	\node[place] (waiting) {
    
    };
	\node[place] (critical) [below=of waiting] {
    
    };
	\node[place] (semaphore) [below=of critical] {
    
    };
	\node[transition] (leave critical) [right=of critical] {
    
    };
	\node[transition] (enter critical) [left=of critical] {
    
    };
	\node [red,above] at (semaphore.north) {
    
    $s\le 3$};
\end{
    
    tikzpicture}
\end{
    
    document}

insert image description here

  • Method 2:
    Use [label=above:$info$]the label attribute to directly add label information.
\documentclass{
    
    article}
\usepackage{
    
    tikz}
\usetikzlibrary {
    
    positioning}

\begin{
    
    document}
\begin{
    
    tikzpicture}
	[place/.style={
    
    circle,draw=blue!50,fill=blue!20,thick,
		inner sep=0pt,minimum size=6mm},
		transition/.style={
    
    rectangle,draw=black!50,fill=black!20,thick,
		inner sep=0pt,minimum size=4mm}]

	\node[place] (waiting) {
    
    };
	\node[place] (critical) [below=of waiting] {
    
    };
	\node[place] (semaphore) [below=of critical,
		label=above:$s\le3$] {
    
    };
	\node[transition] (leave critical) [right=of critical] {
    
    };
	\node[transition] (enter critical) [left=of critical] {
    
    };
\end{
    
    tikzpicture}
\end{
    
    document}
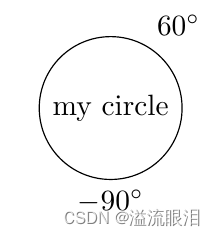
  • Multiple labels can also be given.
    Use here [label=60]to add a label at a position of 60 degrees,
    [label=-90]to add a label at a position of 270 degrees
  • Use [every label/.style={}]to modify the label's style.
\tikz
	\node [circle,draw,label=60:$60^\circ$,label=below:$-90^\circ$] {
    
    my circle};

insert image description here

Drawing of Linked Edges

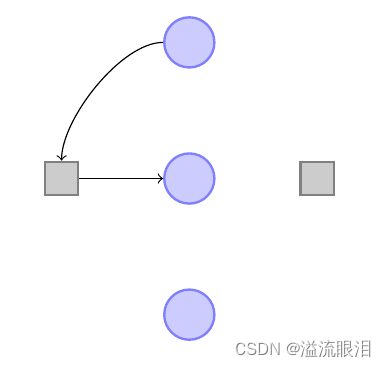
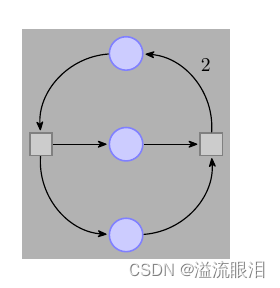
  • Method 1:
    Use syntax \draw [->] (A.west) -- (B.east)or \draw A .. controls B and C .. Ddraw a curve
    Here you need to indicate where the starting point is, and where it ends
\documentclass{
    
    article}
\usepackage{
    
    tikz}
\usetikzlibrary {
    
    positioning}

\begin{
    
    document}
\begin{
    
    tikzpicture}
	[place/.style={
    
    circle,draw=blue!50,fill=blue!20,thick,
		inner sep=0pt,minimum size=6mm},
		transition/.style={
    
    rectangle,draw=black!50,fill=black!20,thick,
		inner sep=0pt,minimum size=4mm}]

	\node[place] (waiting) {
    
    };
	\node[place] (critical) [below=of waiting] {
    
    };
	\node[place] (semaphore) [below=of critical] {
    
    };
	\node[transition] (leave critical) [right=of critical] {
    
    };
	\node[transition] (enter critical) [left=of critical] {
    
    };
	\draw [->] (enter critical.east) -- (critical.west);
	\draw [->] (waiting.west) .. controls +(left:5mm) and +(up:5mm)
		.. (enter critical.north);
\end{
    
    tikzpicture}
\end{
    
    document}

insert image description here

  • Method Two:
    But this is stupid. A simple way of writing is to omit all the above directions, just like the following code.
    Because TikZit will automatically and intelligently choose the appropriate direction.
\draw [->] (enter critical) -- (critical);
\draw [->] (waiting) .. controls +(left:8mm) and +(up:8mm)
.. (enter critical);
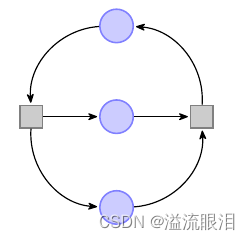
  • Method 3:
    Or try a new syntax
    use \draw [->] A to Binstead of \draw [->] A .. B
    using to \draw [->] A to [out=B,in=C] Ddraw a curve, that is, the given in,outattribute represents the angle of the arc leaving or entering the coordinate.
\draw [->] (enter critical) to (critical);
\draw [->] (waiting) to [out=180,in=90] (enter critical);
  • Method 4:
    Use [bend left=A]to indicate the degree of left/right bend, and you can also draw the corresponding link curve.
\draw [->] (waiting) to [bend right=45] (enter critical);
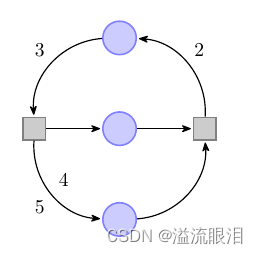
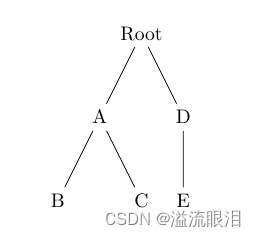
  • Method 5:
    Syntactic sugar, use \node A edge B edge C……to draw the edges linking point A to point B and point C.
\node[transition] (enter critical) [left=of critical] {
    
    }
	edge [->] (critical)
	edge [<-,bend left=45] (waiting)
	edge [->,bend right=45] (semaphore);
  • The comprehensive drawing code is as follows, and it is recommended to use edgethe syntax, which is relatively simple.
\documentclass{
    
    article}
\usepackage{
    
    tikz}
\usetikzlibrary {
    
    arrows.meta,positioning}

\begin{
    
    document}
\begin{
    
    tikzpicture}
	[place/.style={
    
    circle,draw=blue!50,fill=blue!20,thick,
		inner sep=0pt,minimum size=6mm},
		transition/.style={
    
    rectangle,draw=black!50,fill=black!20,thick,
		inner sep=0pt,minimum size=4mm},
		bend angle=45,
		pre/.style={
    
    <-,shorten <=1pt,>={
    
    Stealth[round]},semithick},
		post/.style={
    
    ->,shorten >=1pt,>={
    
    Stealth[round]},semithick}]

	\node[place] (waiting) {
    
    };
	\node[place] (critical) [below=of waiting] {
    
    };
	\node[place] (semaphore) [below=of critical] {
    
    };
	\node[transition] (leave critical) [right=of critical] {
    
    }
		edge [pre] (critical)
		edge [post,bend right] (waiting)
		edge [pre, bend left] (semaphore);

	\node[transition] (enter critical) [left=of critical] {
    
    }
		edge [post] (critical)
		edge [pre, bend left] (waiting)
		edge [post,bend right] (semaphore);

\end{
    
    tikzpicture}
\end{
    
    document}

insert image description here

Add labels to the edge of the line

  • After [上篇]we learned to add information directly above/middle/directly below the line, we use etc. [sloped, below]Here
    our requirement is to add information on the side[auto] of the line, just use the attribute.
    Using [swap]the property mirrors drawing on the other side of the line. See code below.
\documentclass{
    
    article}
\usepackage{
    
    tikz}
\usetikzlibrary {
    
    arrows.meta,positioning}

\begin{
    
    document}
\begin{
    
    tikzpicture}
	[place/.style={
    
    circle,draw=blue!50,fill=blue!20,thick,
		inner sep=0pt,minimum size=6mm},
		transition/.style={
    
    rectangle,draw=black!50,fill=black!20,thick,
		inner sep=0pt,minimum size=4mm},
		bend angle=45,
		pre/.style={
    
    <-,shorten <=1pt,>={
    
    Stealth[round]},semithick},
		post/.style={
    
    ->,shorten >=1pt,>={
    
    Stealth[round]},semithick}]

	\node[place] (waiting) {
    
    };
	\node[place] (critical) [below=of waiting] {
    
    };
	\node[place] (semaphore) [below=of critical] {
    
    };
	\node[transition] (leave critical) [right=of critical] {
    
    }
		edge [pre] (critical)
		edge [post,bend right] node[auto,swap]{
    
    2}	(waiting)
		edge [pre, bend left] (semaphore);

	\node[transition] (enter critical) [left=of critical] {
    
    }
		edge [post] (critical)
		edge [pre, bend left] 	node[auto]{
    
    3}(waiting)
		edge [post,bend right] node[auto]{
    
    4} node[auto,swap]{
    
    5} (semaphore);

\end{
    
    tikzpicture}
\end{
    
    document}

insert image description here

Draw serpentine lines and multiline text

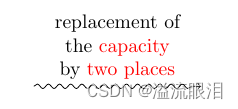
  • Add \usetikzlibrary {decorations.pathmorphing}library
    Use [decoration={snake}]to add serpentine lines, you can also change other parameters, such as [amplitude, segment length, post length]etc.
  • Multi-line text is very simple, LateXsimilar to the syntax, use \\to wrap.
    You can also use [text width=3cm]to have it automatically segment by text length.
\documentclass{
    
    article}
\usepackage{
    
    tikz}
\usetikzlibrary {
    
    decorations.pathmorphing}

\begin{
    
    document}
\begin{
    
    tikzpicture}
	\draw [->,decorate,
		decoration={
    
    snake,amplitude=.4mm,segment length=2mm,post length=1mm}]
	(0,0) -- (3,0)
	node [above,align=center,midway]
	{
    
    
		replacement of\\
		the \textcolor{
    
    red}{
    
    capacity}\\
		by \textcolor{
    
    red}{
    
    two places}
	};
\end{
    
    tikzpicture}
\end{
    
    document}

insert image description here

layer map

  • After drawing a picture, it is hoped to add a background rectangle of a certain color behind the background of the picture.
    Since the size of the graph is dynamic, you can choose to specify the coordinates to draw, or you can use the layer layer
    . The layer graph needs to import backgroundsthe library, which uses fitthe library, and both need to be imported
  • Add one scopethat specifies where [on background layer]to draw the background layer
    to use [fit = A B C D E]to accommodate overlaying these elements.
\documentclass{
    
    article}
\usepackage{
    
    tikz}
\usetikzlibrary {
    
    arrows.meta,backgrounds,fit,positioning}

\begin{
    
    document}
\begin{
    
    tikzpicture}
	[place/.style={
    
    circle,draw=blue!50,fill=blue!20,thick,
		inner sep=0pt,minimum size=6mm},
		transition/.style={
    
    rectangle,draw=black!50,fill=black!20,thick,
		inner sep=0pt,minimum size=4mm},
		bend angle=45,
		pre/.style={
    
    <-,shorten <=1pt,>={
    
    Stealth[round]},semithick},
		post/.style={
    
    ->,shorten >=1pt,>={
    
    Stealth[round]},semithick}]

	\node[place] (waiting) {
    
    };
	\node[place] (critical) [below=of waiting] {
    
    };
	\node[place] (semaphore) [below=of critical] {
    
    };
	\node[transition] (leave critical) [right=of critical] {
    
    }
	edge [pre] (critical)
	edge [post,bend right] node[auto,swap] {
    
    2} (waiting)
	edge [pre, bend left] (semaphore);
	\node[transition] (enter critical) [left=of critical] {
    
    }
	edge [post] (critical)
	edge [pre, bend left] (waiting)
	edge [post,bend right] (semaphore);
	\begin{
    
    scope}[on background layer]
		\node [fill=black!30,fit=(waiting) (critical) (semaphore)
		(leave critical) (enter critical)] {
    
    };
	\end{
    
    scope}

\end{
    
    tikzpicture}
\end{
    
    document}

insert image description here

draw a simple tree

  • More commonly used, use to \node {}create a root node
    use to child {node{}}create child nodes
\documentclass{
    
    article}
\usepackage{
    
    tikz}
\usetikzlibrary {
    
    arrows.meta,backgrounds,fit,positioning}

\begin{
    
    document}
\begin{
    
    tikzpicture}
	\node {
    
    Root}
	child {
    
    	node{
    
    A}
		child {
    
    node{
    
    B}}
		child {
    
    node{
    
    C}}
	}
	child {
    
    node{
    
    D}
		child {
    
    node{
    
    E}}
	}
	;
\end{
    
    tikzpicture}
\end{
    
    document}

insert image description here

Guess you like

Origin blog.csdn.net/weixin_45775438/article/details/130828621