A line chart can compare the current data with a certain time period, such as the previous day, last week, and last year.

Data comparison enable condition
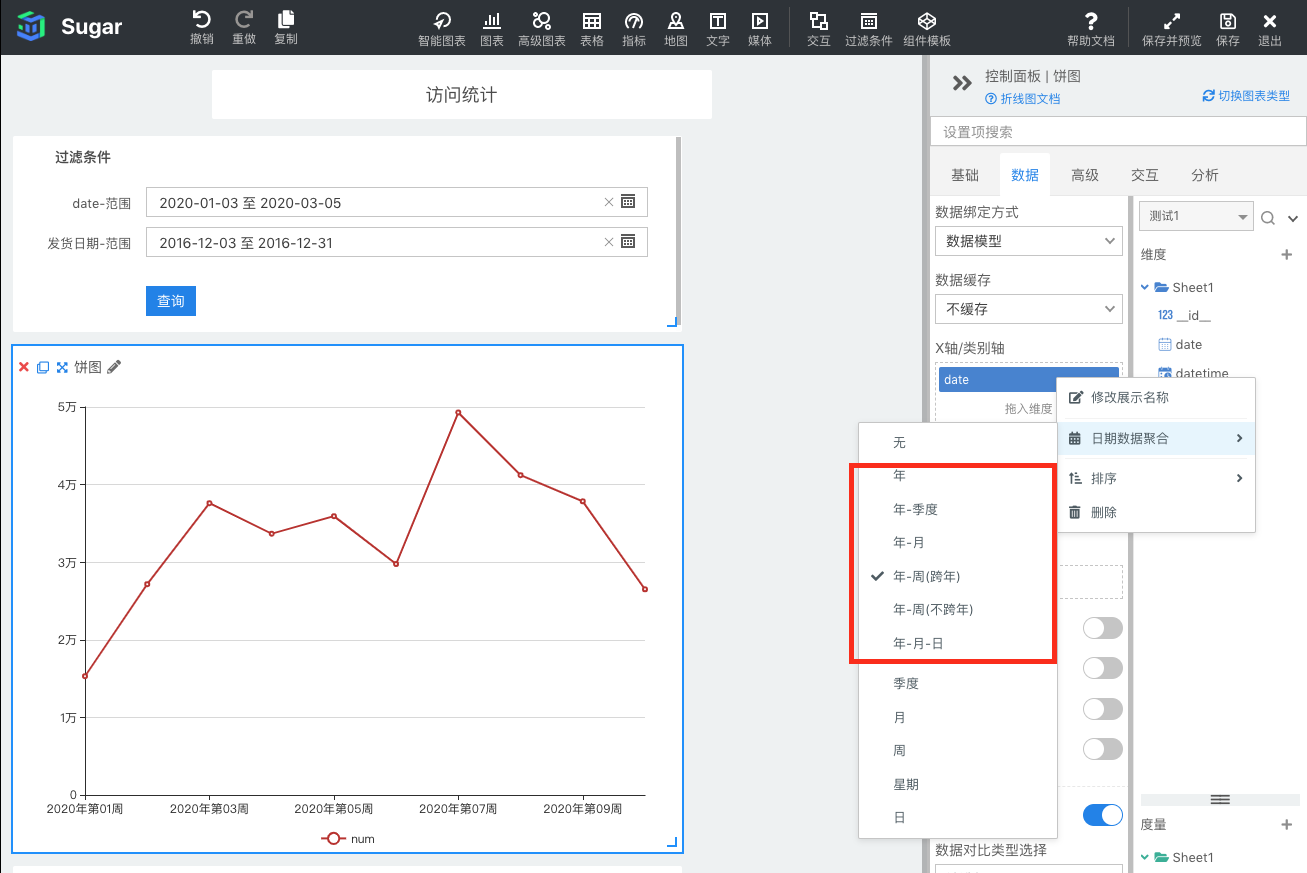
When the X-axis of the line chart has one and only one date or time field, and the aggregation method is year-xx, and the Y-axis has one and only one measurement field, you can enable and configure the data comparison of the line chart.
The date and time aggregation types that support data comparison and their corresponding optional data comparison types are shown in the following table:
| datetime aggregation type | Data Comparison Options |
|---|---|
| Year | Previous Year, Custom End Date |
| year-quarter | Previous Quarter, Same Period Last Year, Custom End Date |
| years | Last month, Same period last year, Same period last quarter, Custom end date |
| Year-week, New Year-week | Last week, Same period last year, Custom end date |
| Year-Month-Day, Year-Month-Day-Hour | Previous Day, Last Week Same Period, Last Month Same Period, Last Quarter Same Period, Last Year Same Period, Custom End Date |
Configuration comparison items
After data comparison is enabled, you need to configure the data comparison type, as shown in the figure below, and the checked comparison items will be displayed at the top of the line chart.

The custom end date refers to the end date of the comparison date range. For example, the current query date range is from January 3, 2020 to February 1, 2020, and we set the end date to January 28, 2020. As shown in the figure below: the comparison date corresponding to February 1 is January 28, and the comparison date corresponding to January 31 is 1.27, and the aggregation granularity of the current date dimension is decreased together.


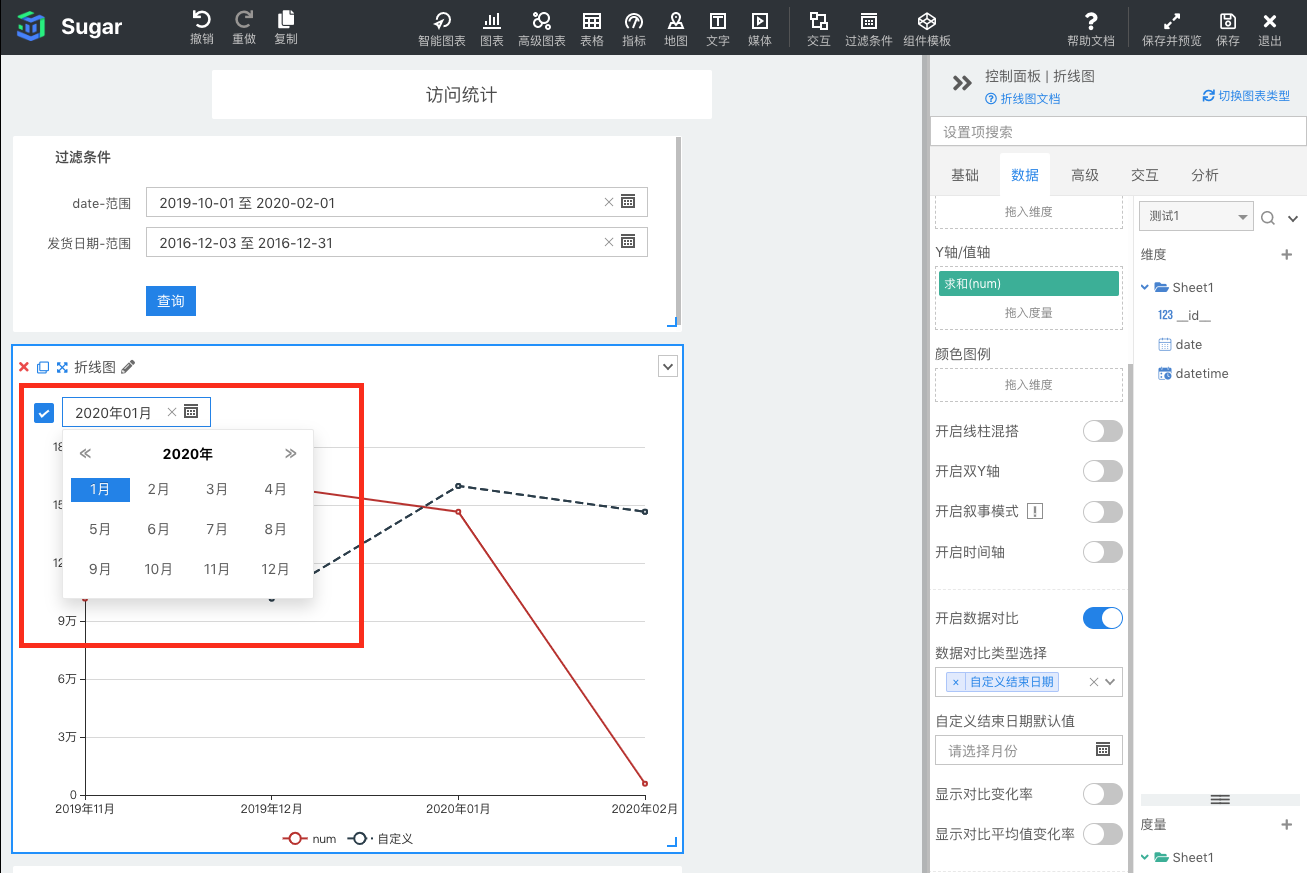
If we have checked the custom end date in the data comparison type, then there will be an option to customize the default end date, and you can set the default end date here. In addition, the custom end date is synchronized with the aggregation granularity of the current date dimension. As shown in the figure below, the aggregation granularity of the current date dimension is year-month, so the custom end date is also a month selector.
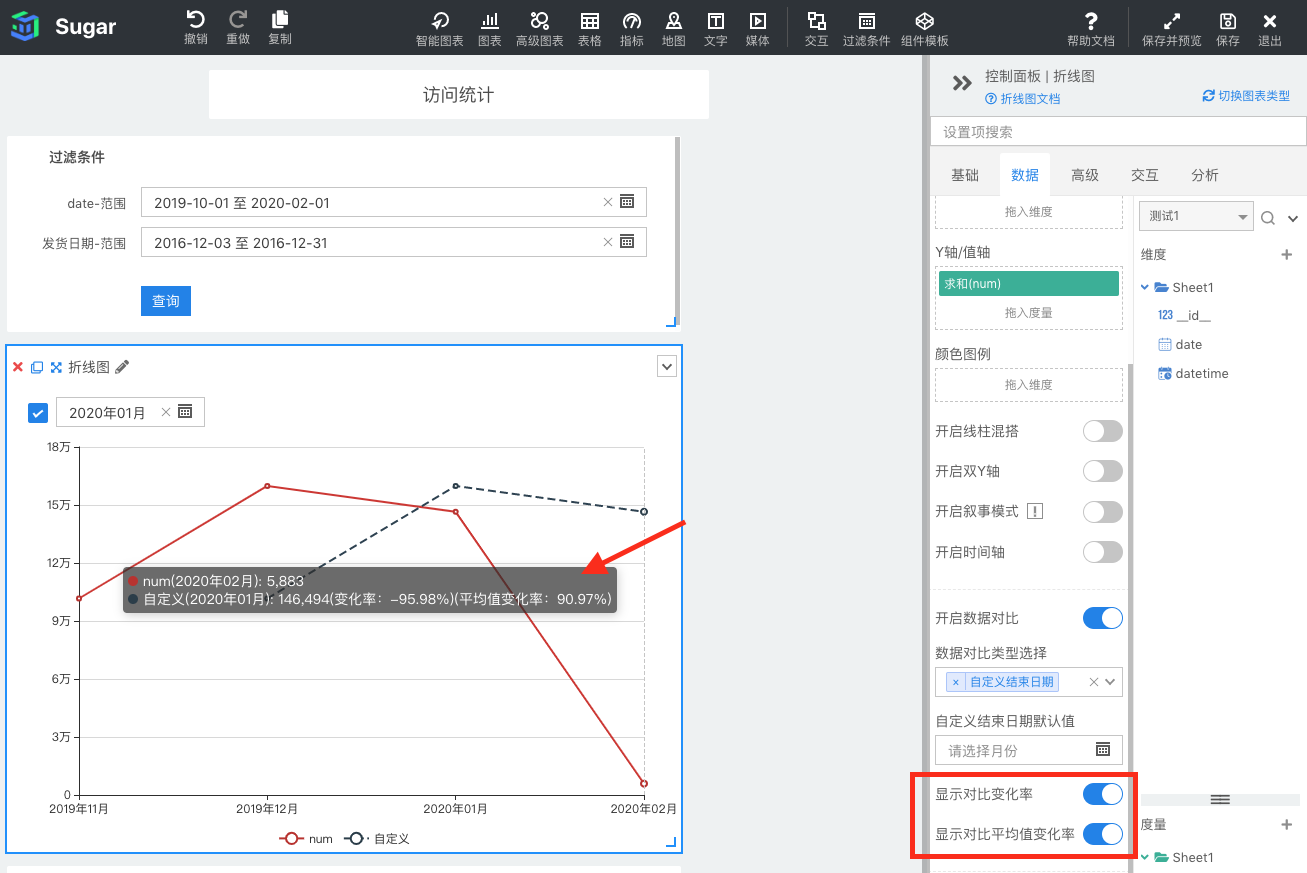
After enabling data comparison, you can also enable "Display Comparison Change Rate" and "Display Comparison Average Change Rate". After enabling, the change rate will be displayed in the tooltip, as shown in the figure below:
Data comparison and filter conditions are used at the same time
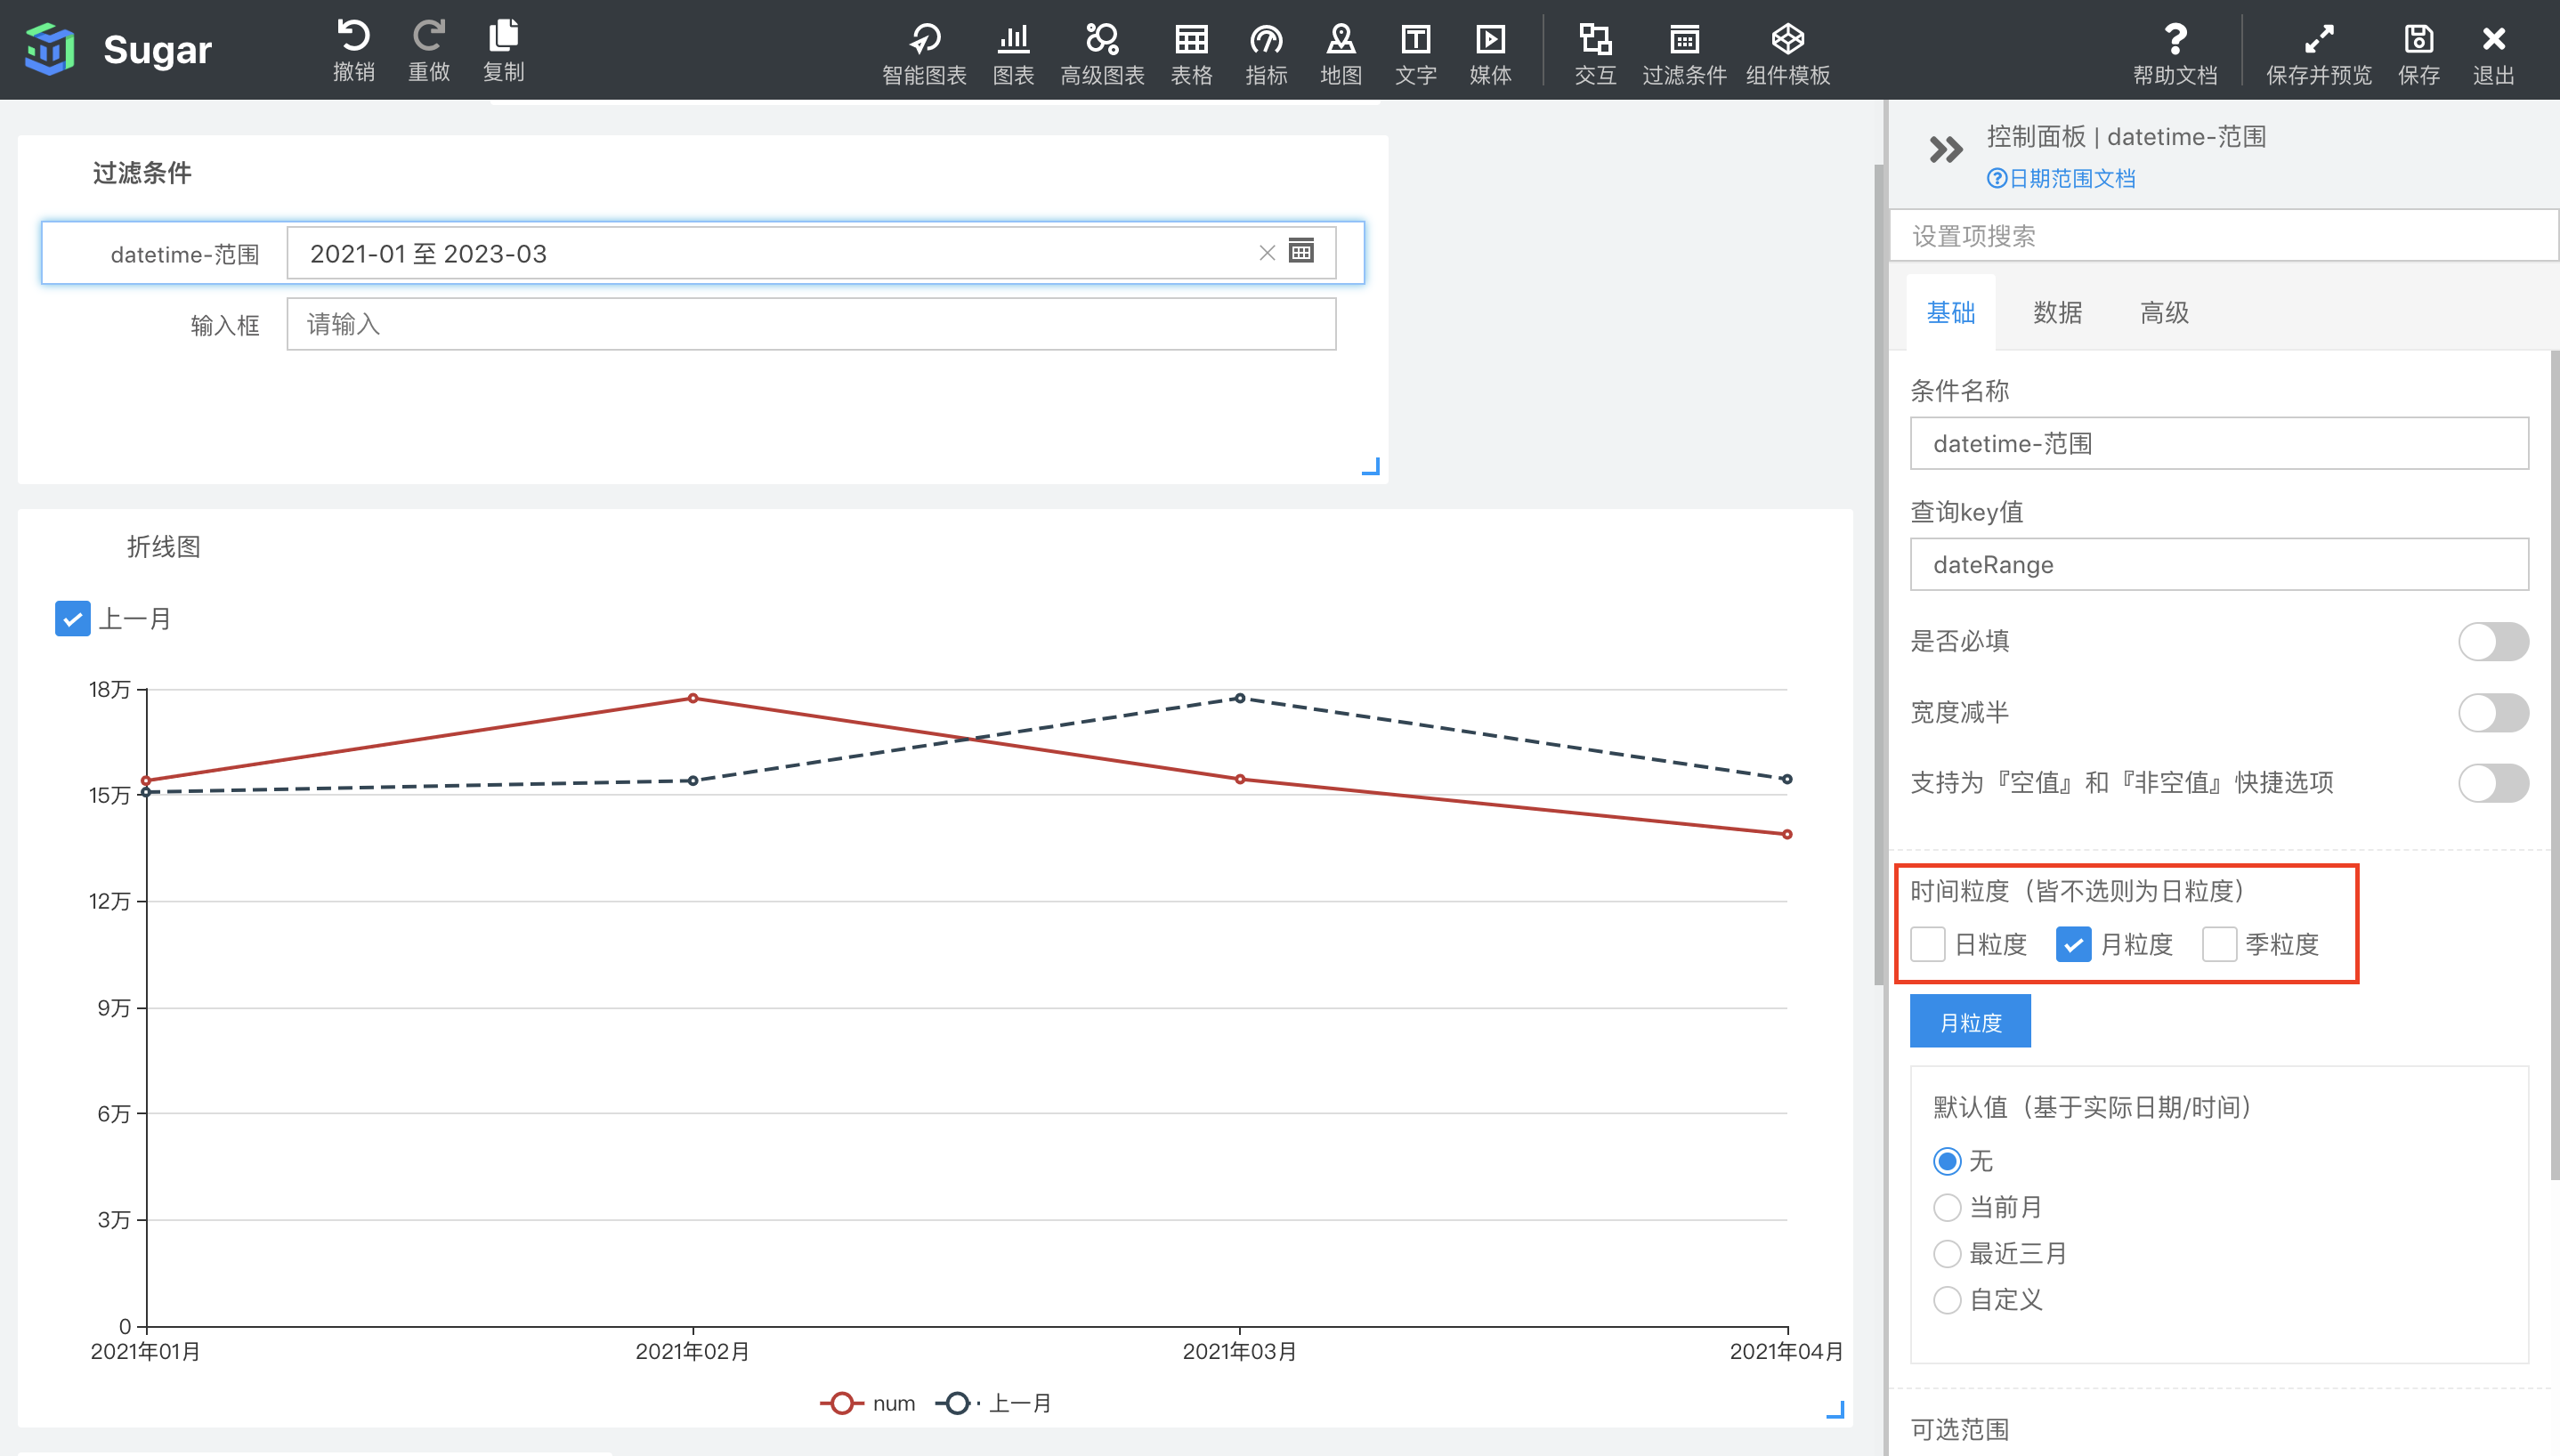
If you use filter conditions while using data comparison, you need to use the same time granularity as the date aggregation granularity. If the aggregation granularity of the current date field is year-month, then the time granularity of the filter condition should also be set to month granularity.
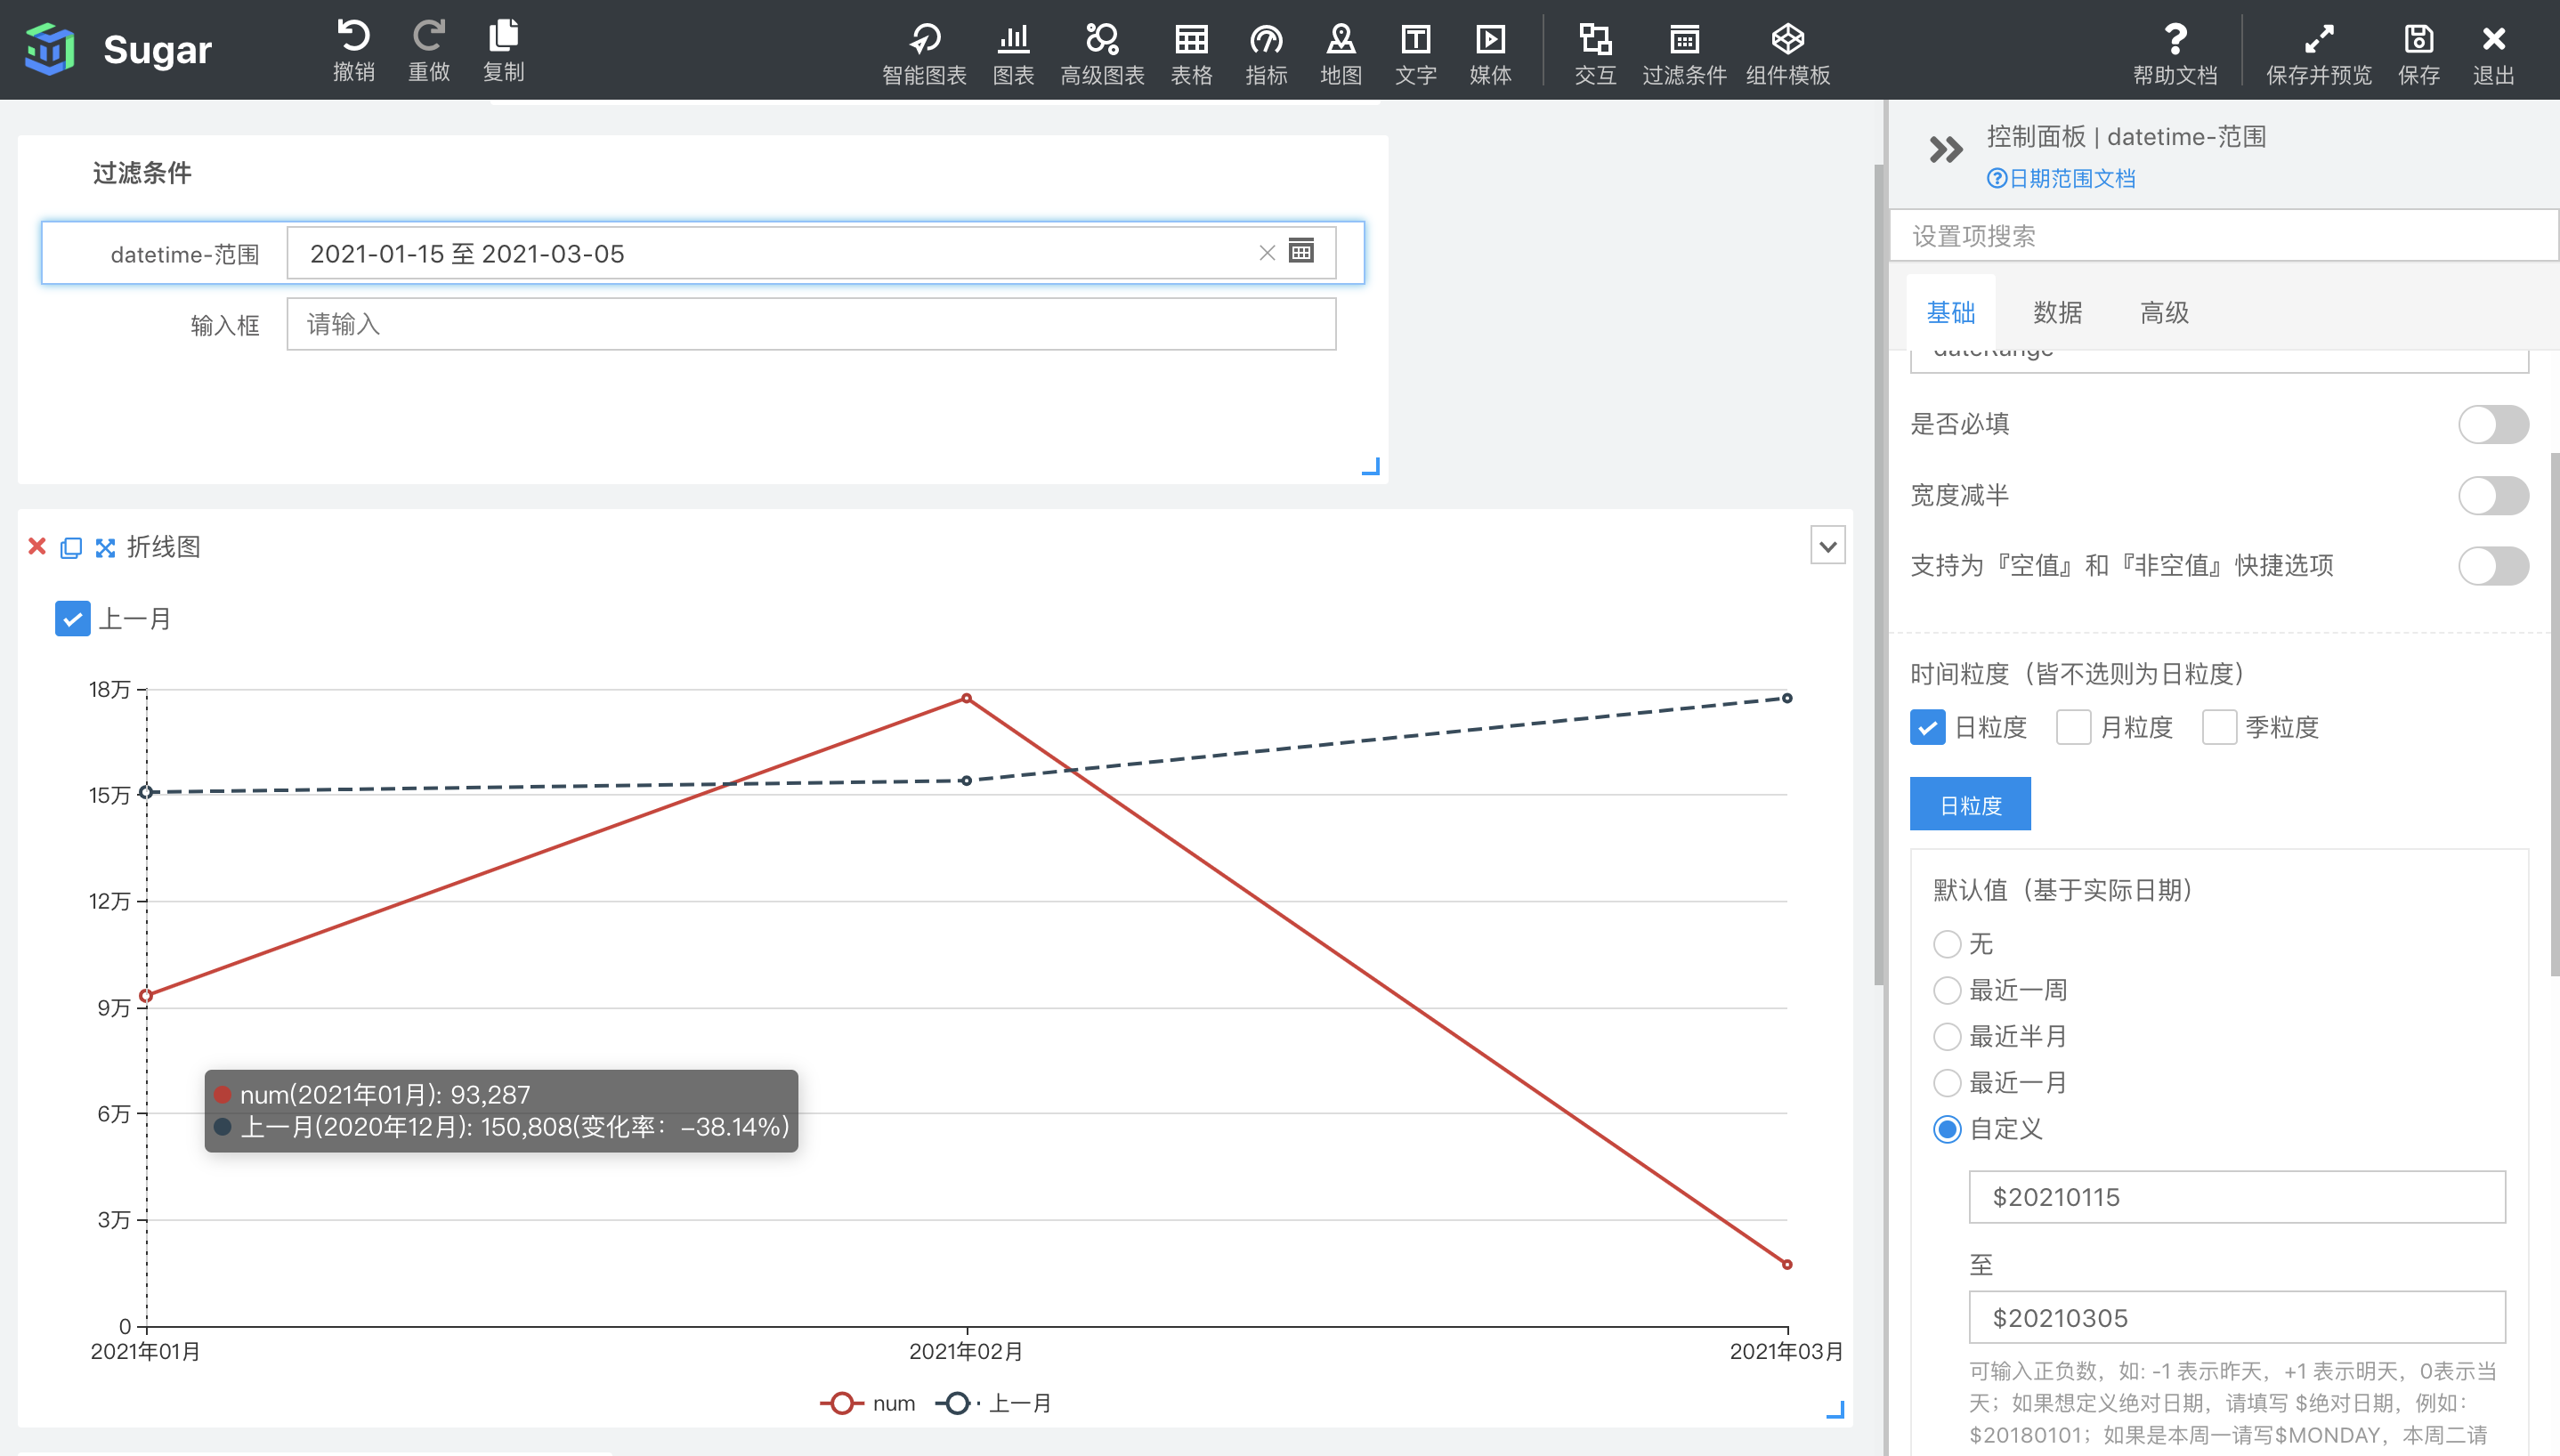
If the aggregation granularity of the current date field is year-month, but the time granularity of the filter condition is the default daily granularity, and the filtered date range is not from the beginning of a certain month to the end of a certain month, then the compared data will still check the entire month , the comparison of the first date and the last date will be inaccurate.
As shown in the figure below, the range of date filter conditions is from 2021-01-15 to 2021-03-10, then the current data represented by the red line in the line chart is from 2021-01-15 to 2021-03-10, but the blue The data query of the last month indicated by the dotted line is from 2020-12-01 to 2021-02-28. In this case, the comparison between the first data and the last data will be wrong, January 2021 The corresponding current data is from 2021-01-15 to 2021-01-31, and the data of the previous month is from 2020-12-01 to 2020-12-31. The rate of change calculated in this way is also meaningless.
Sugar BI supports a free trial , and everyone is welcome to come and experience it!