3. Ensure that all client requests are handled properly
How to ensure that all connections are properly handled when the pod starts
1. Avoid client connection disconnection when pod starts
When a pod starts, it exposes all services as service endpoints whose label selectors match the pod's label. The pod needs to send a signal to kubernetes that it is ready. After the pod is ready, it can become a service endpoint, otherwise it cannot accept any client connection request.
A pod is always considered ready if no readiness probe is specified in the pod spec. After the first kube-proxy updates the iptables rules on its node, and the first client pod starts connecting to the service, the pod, which is considered ready by default, will start accepting requests almost immediately. If the application is not ready to accept connections at this time, the client will receive an error message such as "connection refused".
All you need to do is make the readiness probe return success if and only if the message is ready to handle the incoming request. The first step in practice is to add a readiness probe for HTTP GET requests to the application root URL.
2. When the pod is closed, the client connection is disconnected
When the pod is deleted and the pod's container is terminated, how does the pod's container shut down cleanly when it receives the SIGTERM signal. How to ensure that all client requests are handled properly?
Understand the chain of events that occurs when a pod is deleted
1) When the api server receives a request to delete a pod, it first modifies the state in etcd and notifies the observer of the deletion event. Two of the observers are the kubelet and the Endpoint Controller.
When the kubelet receives the notification that the pod application is terminated, it executes the pre-stop hook, sends the SIGTERM signal, waits for a period of time, and then forcibly kills the container if the container does not self-terminate.
If the application understands to stop accepting client requests in response to the SIGTERM signal, any attempt to connect to the application will receive a Connection Refused error. The time from when the pod is deleted to when this request occurs is relatively short. Because this is a direct communication between the api server and the kubelet.
2) Before the pod is removed from the iptables rules, when the endpoint controller receives the notification that the pod is about to be deleted, he removes the service endpoint of the pod from all the services where the pod is located. He modifies the Endpoit API object by sending a REST request to the api server. Then the api server will notify all clients to pay attention to this Endpoint object. Some of these watchers are kube-proxy services running on worker nodes. Each kube-proxy service updates iptables rules on its own node to prevent new connections from being forwarded to these stopped pods.
The above two series of times occur in parallel. Most likely, the time taken to shut down the application process in the pod is slightly shorter than the time required to complete the update of the iptables rules, and the series of events that lead to the update of the iptables rules is relatively long . Because these events must first reach the Endpoint controller, then the Endpoint controller sends a new request to the api server, then the api server must control the kube-proxy, and finally the kube-proxy is modifying the iptables rules. There is a high possibility that the SIGTERM signal will be sent before the iptables rules are updated to all nodes.
The end result is that after sending a kill signal to the pod, the pod can still receive client requests. If the application understands to close the server socket and stop receiving requests, this will cause the client to receive a "connection refused" type error
Solve the problem
Adding a readiness probe to the pod solves the problem. If all that is required is that the readiness probes start failing when the pod receives a SIGTERM signal, this will cause the pod to be removed from the service's endpoint. But this removal action will only happen after the readiness probe continues to fail for a period of time (can be configured in the spec of the readiness probe), and this removal action needs to reach kube-proxy first and then the iptables rule will be removed this pod.
The only reasonable thing you can do is wait long enough for all kube-proxy to finish their work, so how long is enough? In most scenarios, a few seconds should be enough, but there is no guarantee that it will be enough every time. When the api server or endpoint controller is overloaded, it will take longer for notifications to reach kube-proxy. It is important to understand that there is no perfect solution to this problem, but adding a 5 or 10 second delay in time can also greatly improve the user experience. You can use a longer delay time, but not too long, because this will cause the container to fail to shut down normally, and it will cause the pod to be deleted for a long time and still be displayed in the list, which will cause trouble for users who delete pods .
summary:
Closing an application gracefully involves the following steps:
- Wait a few seconds, then stop accepting new connections
- Close all long connections that have not been requested
- Wait for all requests to complete
- then close the application completely
4. Let the application run and manage conveniently in kubernetes
1. Build a manageable container image
When packaging an application into an image, it can include the binary file of the application and its dependent libraries, or package a complete operating system and the application together. Is every file in the operating system in the image needed? No, most files are never used and will just make your image bigger than it needs to be. When a pod is scheduled to a node for the first time, it takes a long time. Minimal build images are very difficult to debug. When you need to run some tools, such as ping, dig, curl or other similar commands in the container, you will realize how important it is for the container to contain at least the minimum set of these tools.
Which tools are included in the image and which tools are not included depends on your own needs.
2. Reasonably label the image and use the ImagePullPolicypod correctly
It is best not to use latest in the manifest, otherwise you cannot fall back to the specified version.
You must use a label that can specify the specific version. If you use a changeable label, you need to set the imagepullpolicy to always in the pod spec. But if you use this method in a production environment, you need to pay attention to his additional instructions. If the pull policy of the image is set to always, the container operation will contact the image registry when it encounters a new pod that needs to be deployed. This will slow down the pod startup speed, because the node needs to check whether the image has been modified. Worse yet, this strategy prevents new pods from starting when the mirror registry cannot be reached.
3. Use multi-dimensional labels instead of single-dimensional labels
Labels can contain the following:
- The name of the application (or microservice) to which the resource belongs
- Application level (frontend, backend, etc.)
- Runtime environment (dev, test, staging, production, etc.)
- version number
- release type
- Release type (stable, canary, green or blue in blue-green development, etc.)
- Tenants (if you run different pods in each tenant instead of using namespaces)
- Sharding (system with sharding)
Tag management allows you to manage resources in groups rather than in isolation, making it easy to understand where resources belong
4. Describe each resource through annotations
Annotations can be used to add additional information to your resources. A resource should at least include an annotation describing the resource and an annotation describing the owner of the resource.
In a microservices framework, a pod should contain an annotation describing the names of other services that the pod depends on. This makes it easy to show dependencies between pods. Other annotations can include build and version information, as well as meta information (icon names, etc.) used by other tools or GUIs
5. Provide more information for process termination
To make diagnosis easier, displaying the reason for container termination in the pod status allows the process in the container to write a termination message to a specified file in the container's system. The content of this file will be read by kubelet after the container terminates, and then displayed in kubectl describe pod. The default path to the file that this process needs to write termination messages to is /dev/termination-log. This path can also be customized by setting the terminationMessagePath field in the container definition part of the pod spec.
Note: If the container does not write messages to any files, the terminationMessagePolicy field can only be set to FallbackToLogsOnError. In this case, the last few lines of the container's log will be treated as termination messages (only if the container did not terminate successfully)
6. Processing application logs
The application writes the log to the standard output interrupt instead of the file, and the application log can be easily viewed through the kubectl log command.
Tip: If a container crashes and a new container replaces it, you will see the new container's logs. If you want to see the logs of the previous container, when using the kubectl logs command, add the option --provious
If the application writes logs to a file instead of the standard output terminal, there is another way to view the logs:
$kubectl exec <pod> cat <logfile>
This command executes the cat command inside the container, returns the log stream to kubectl, and kubectl displays them on your terminal.
Copy logs or other files to and from the container
Transfer the file to the local machine:
$kubectl cp foo-pod:/var/log/foo.log foo.log
To copy files from your local machine into a pod, you can specify the pod name as the second argument:
$kubectl cp localfile foo-pod:/etc/remotefile
Use centralized logging
kubectl itself does not provide any centralized logging, and must support centralized storage and analysis of all container logs through other components, which typically run as ordinary pods in the cluster.
Deploying a centralized logging solution is very simple. All you need to do is to deploy a few YAML/JSON manifest files, and that's it.
On Google's kubernetes engine, this is even simpler, just select the "Enable Strackdriver Logging" option when setting up the cluster.
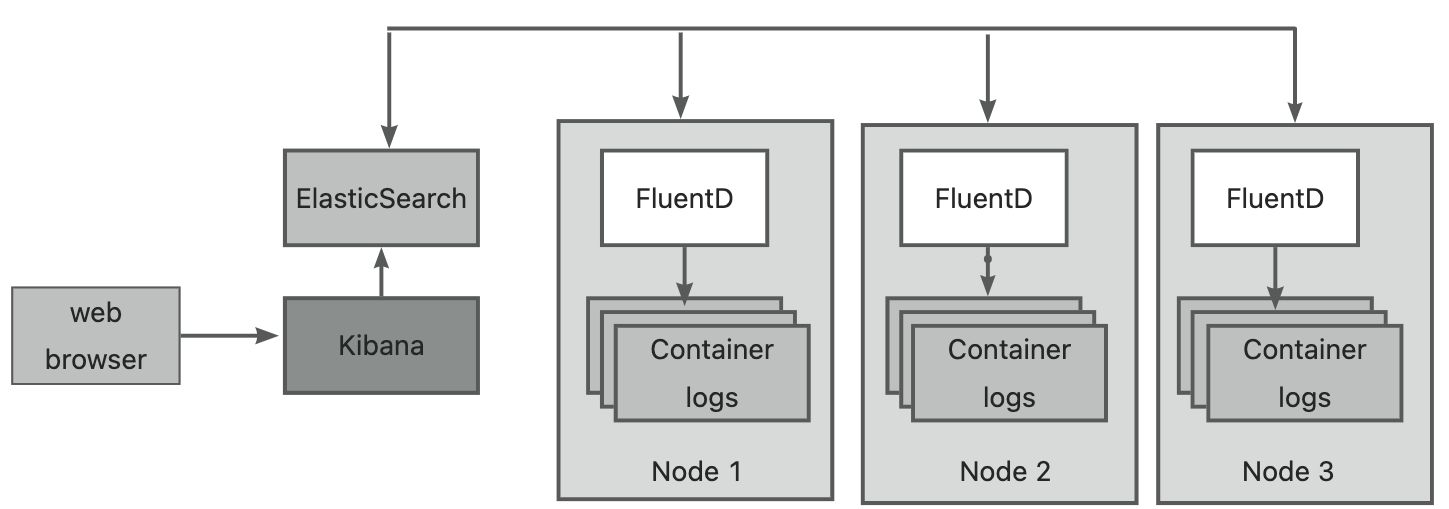
Perhaps you have heard of the ELK stack consisting of ElasticSearch, Logstash and Kibanna, a slightly modified variant of the EFK stack, where Logstash is replaced by FluentD.
When using EFK as centralized logging, each kubernetes cluster node will run a FluentD agent (deployed by using DaemonSet as a pod). This agent is responsible for collecting logs from containers, marking the logs with pod-related information, and then Send them to ElasticSearch, and ElasticSearch will store them permanently. ElasticSearch is also deployed as a pod in the cluster. These logs can be viewed and analyzed in a web browser through kubana, a tool for visualizing ElasticSearch data, which is often run as a pod and exposed as a service. The three components of EFK are shown in the figure below:
Handle multi-line log input
The FluentD agent stores each line of the log file as an entry in the ElasticSearch data storage. When the log output spans multiple lines, such as the exception stack of java, it will be stored in the centralized logging system as different entries.
To solve this problem, you can make the application log output content in JSON format instead of plain text. In this way, a multi-line log output can be stored as an entry. It can also be displayed as an entry in kibana, but this approach will make the kubectl log command to view the log less user-friendly.
The solution is that the logs output to the standard output terminal are still user-scaled logs, but the logs written to the log file for FluentD to process are in JSON format. This requires a reasonable configuration of the FluentD agent at the node level or adding a lightweight logging container to each pod.