jmeter version: jmeter5.1.1
plug-in resource (can be downloaded from its official website or obtained from the following network disk):
Link: https://pan.baidu.com/s/1vBr85BLuhhENrnWrFTDGhg
Extraction code: ywr4
1. Plugins Manager (plugins manager)
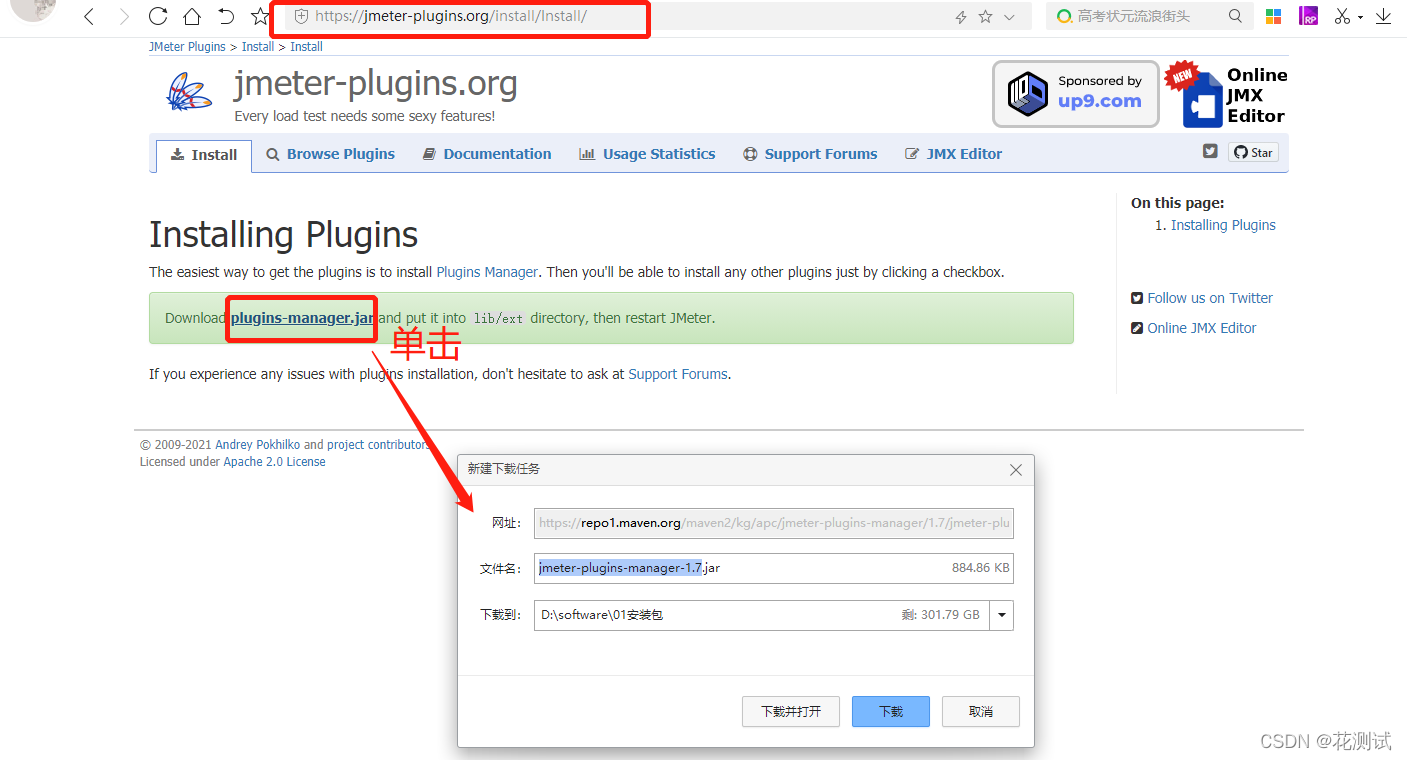
The easiest way to get plugins is to install the Plugins Manager , then just click on the checkbox in Jmeter to install any other plugin.
1) Download the jmeter-plugins-manager-1.3.jar file
Download address: http://jmeter-plugins.org/downloads/all/
2) Operation method
Put the downloaded .jar file in the apache-jmeter-5.1.1\lib\ext folder under the jmeter installation path
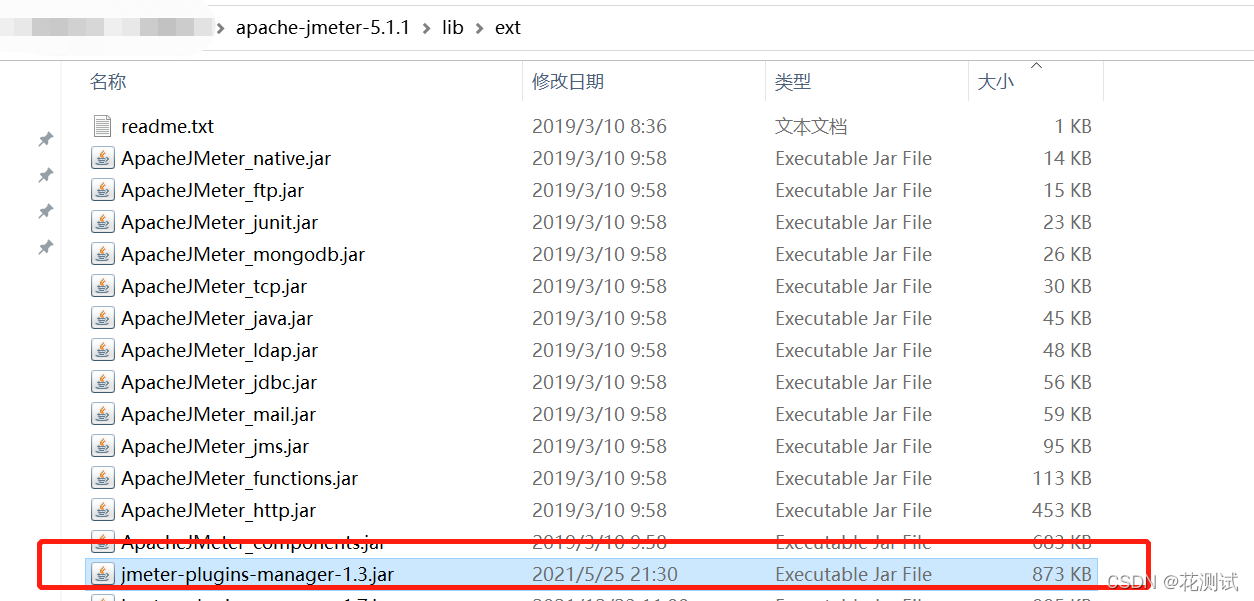
3) restart jmeter
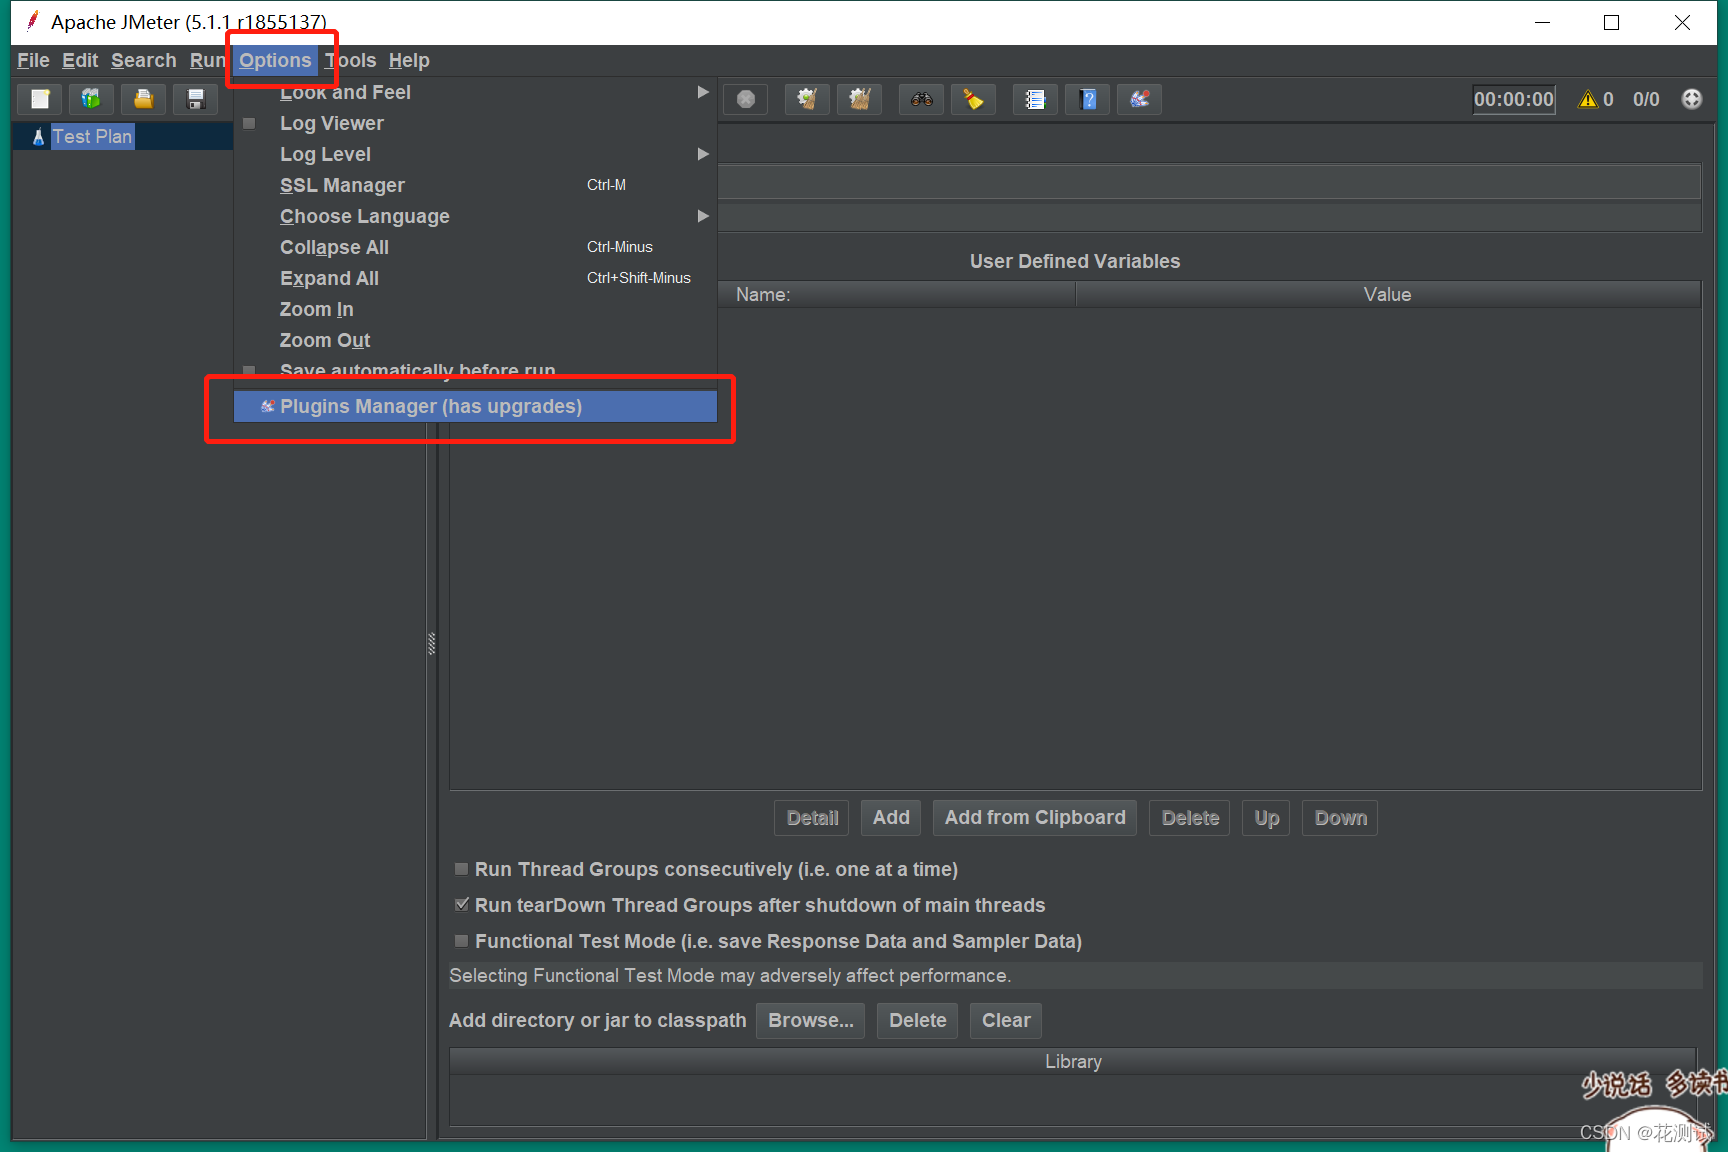
After restarting, there will be an additional option in Options: Plugins Manager

2. PerfMon (server performance monitoring)
Install the Permon Metrics Collector plugin:
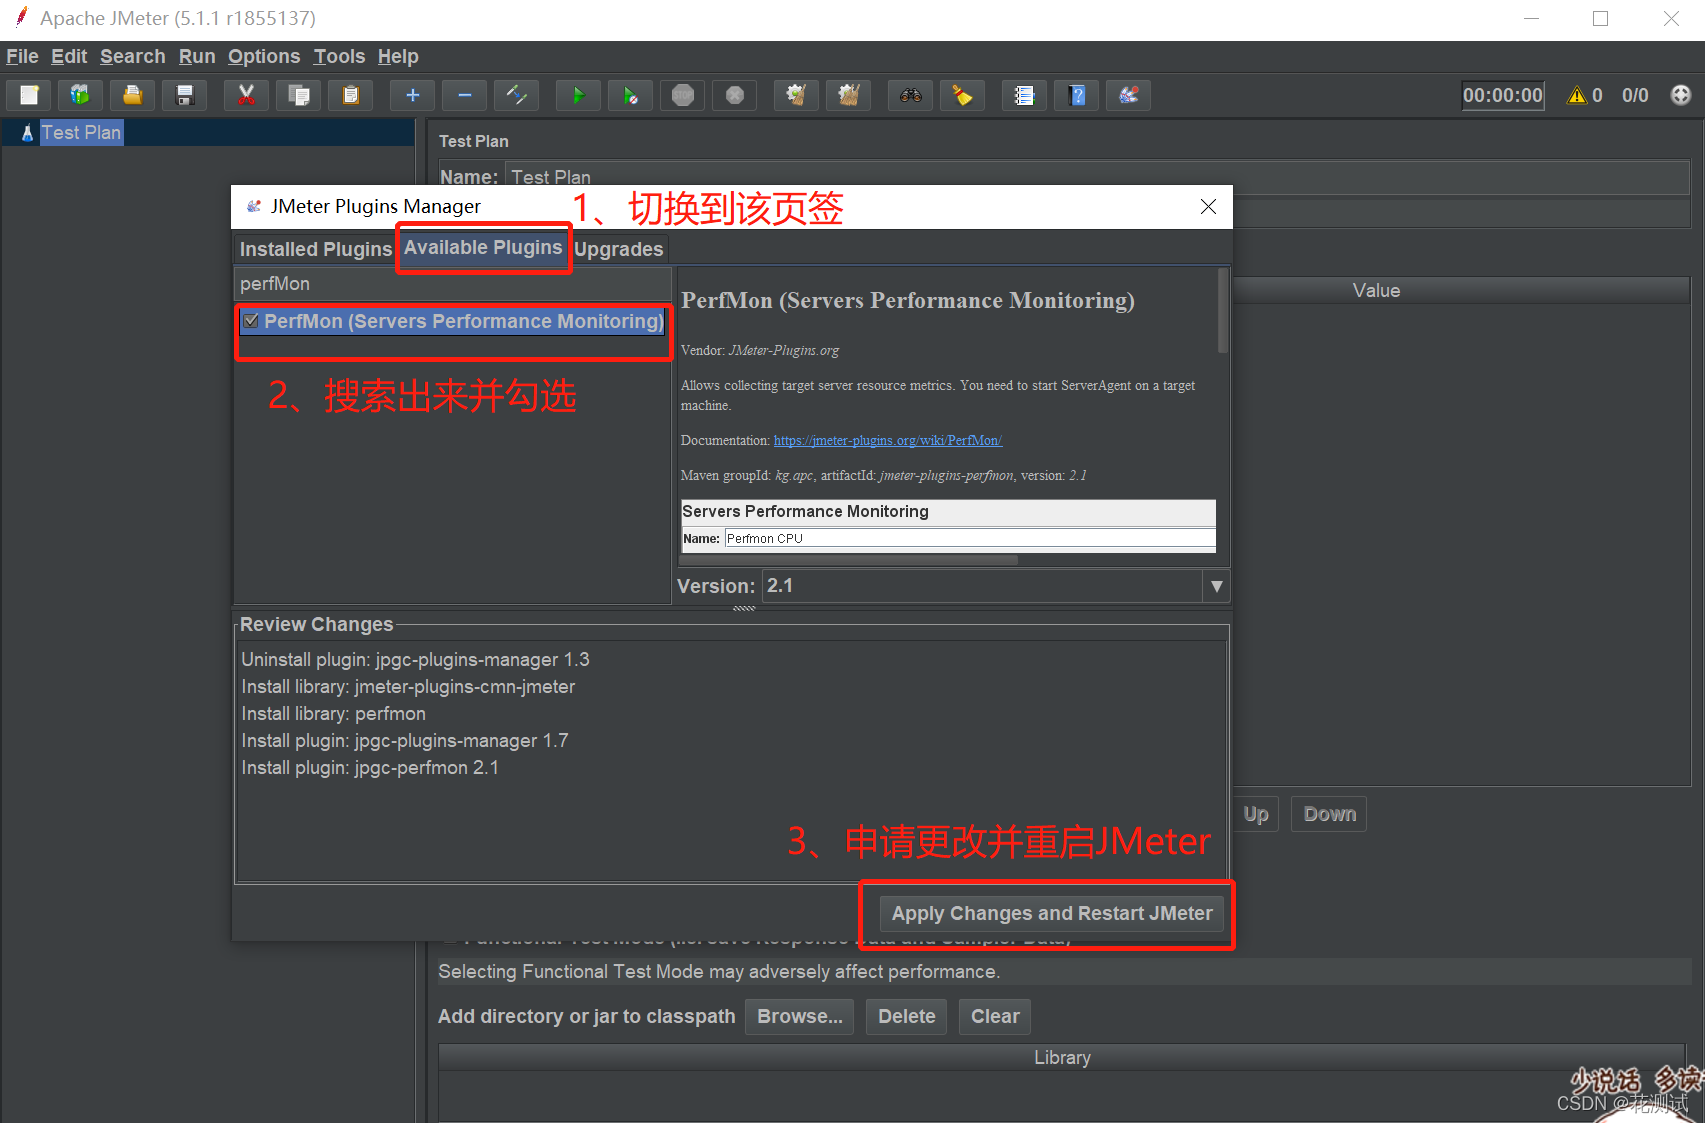
1) Plugins Manager can be opened in the option of JMeter, as shown in the figure below:
2) Search for "PerfMon" on the Available Plugins tab, and check the plugin to install it, as shown in the figure below:
3. Install the PerfMon Server Agent plug-in
JMeterPlugins-Standard and JMeterPlugins-Extras are client-side, and ServerAgent is server-side.
1) Client plugin
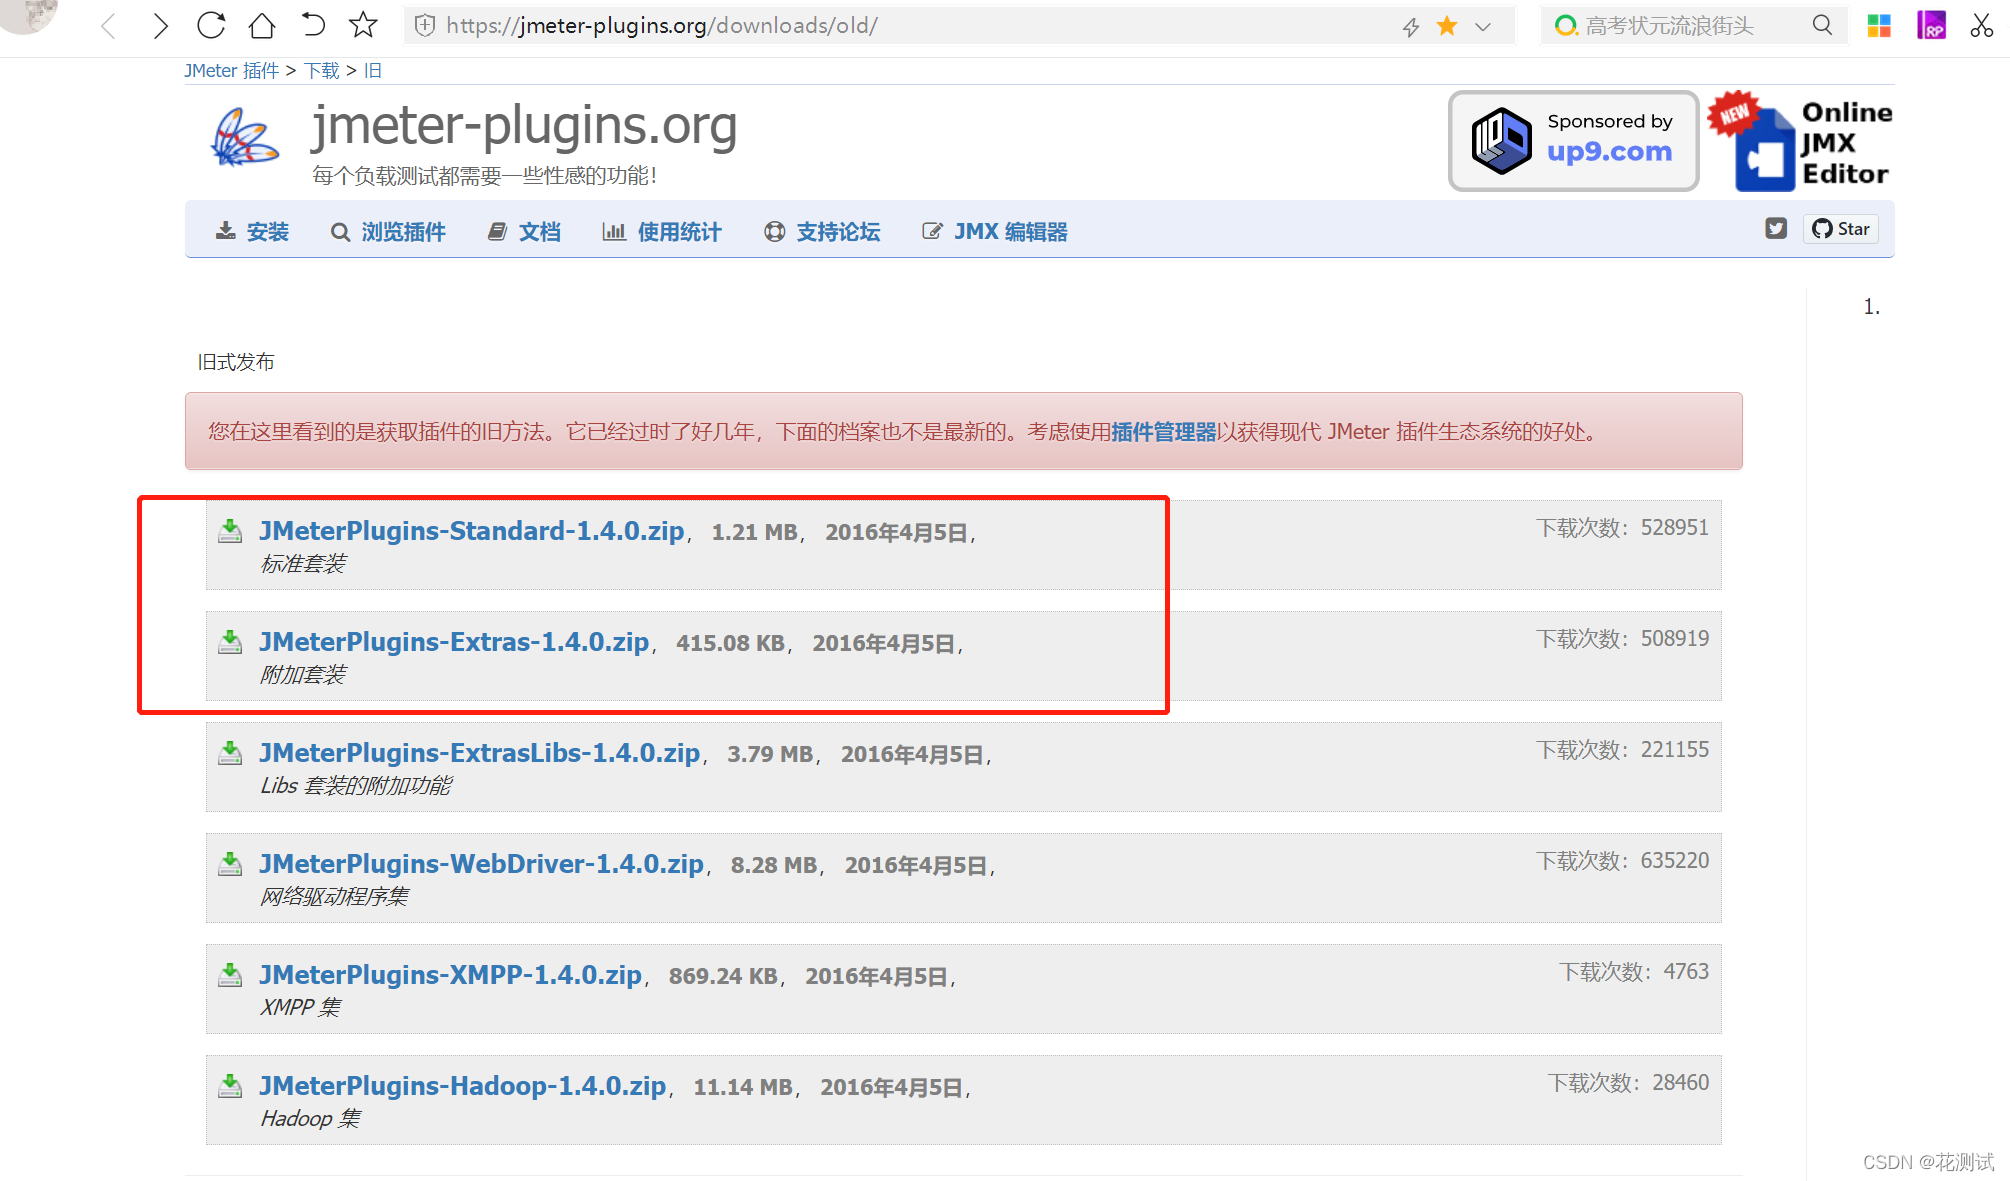
Download JMeterPlugins-Standard package, JMeterPlugins-Extras package (download address: https://jmeter-plugins.org/downloads/old/);
JMeterPlugins-Standard-Standard in lib\ext directory in JMeterPlugins-Standard-1.4.0.zip The .jar file is placed in the apache-jmeter-5.1.1\lib\ext folder under the jmeter installation path; the
JMeterPlugins-Extras.jar file under the lib\ext directory in JMeterPlugins-Extras-1.4.0.zip is also placed Go to the apache-jmeter-5.1.1\lib\ext folder under the jmeter installation path.
2) Server plugin
Download the ServerAgent-2.2.3.zip file (download address: https://github.com/undera/perfmon-agent)

3) Unzip ServerAgent-2.2.3.zip on the server
Windows system starts startAgent.bat; UNIX system starts startAgent.sh;
Note: If the 4444 interface cannot be directly accessed, the port number needs to be modified (the specific operation will not be described in detail here).
4. jmeter client monitoring test
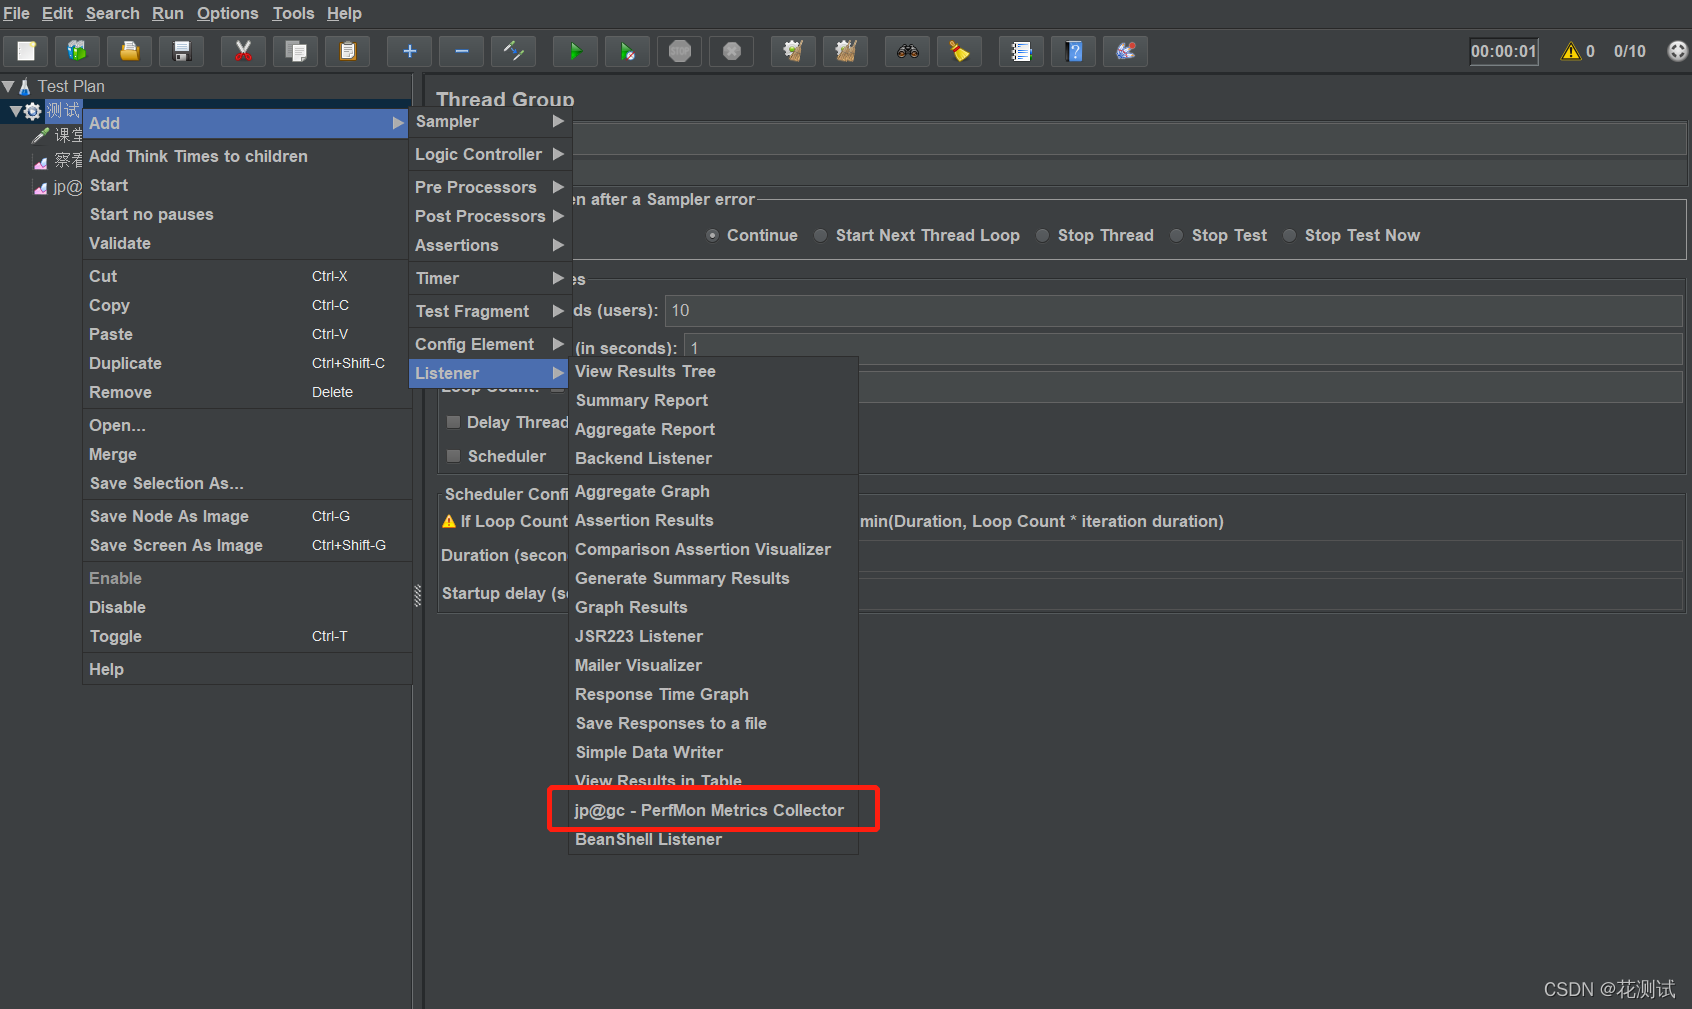
1) Add a listener
Add --> Listener --> jp@gc - PerfMon Metrics Collector
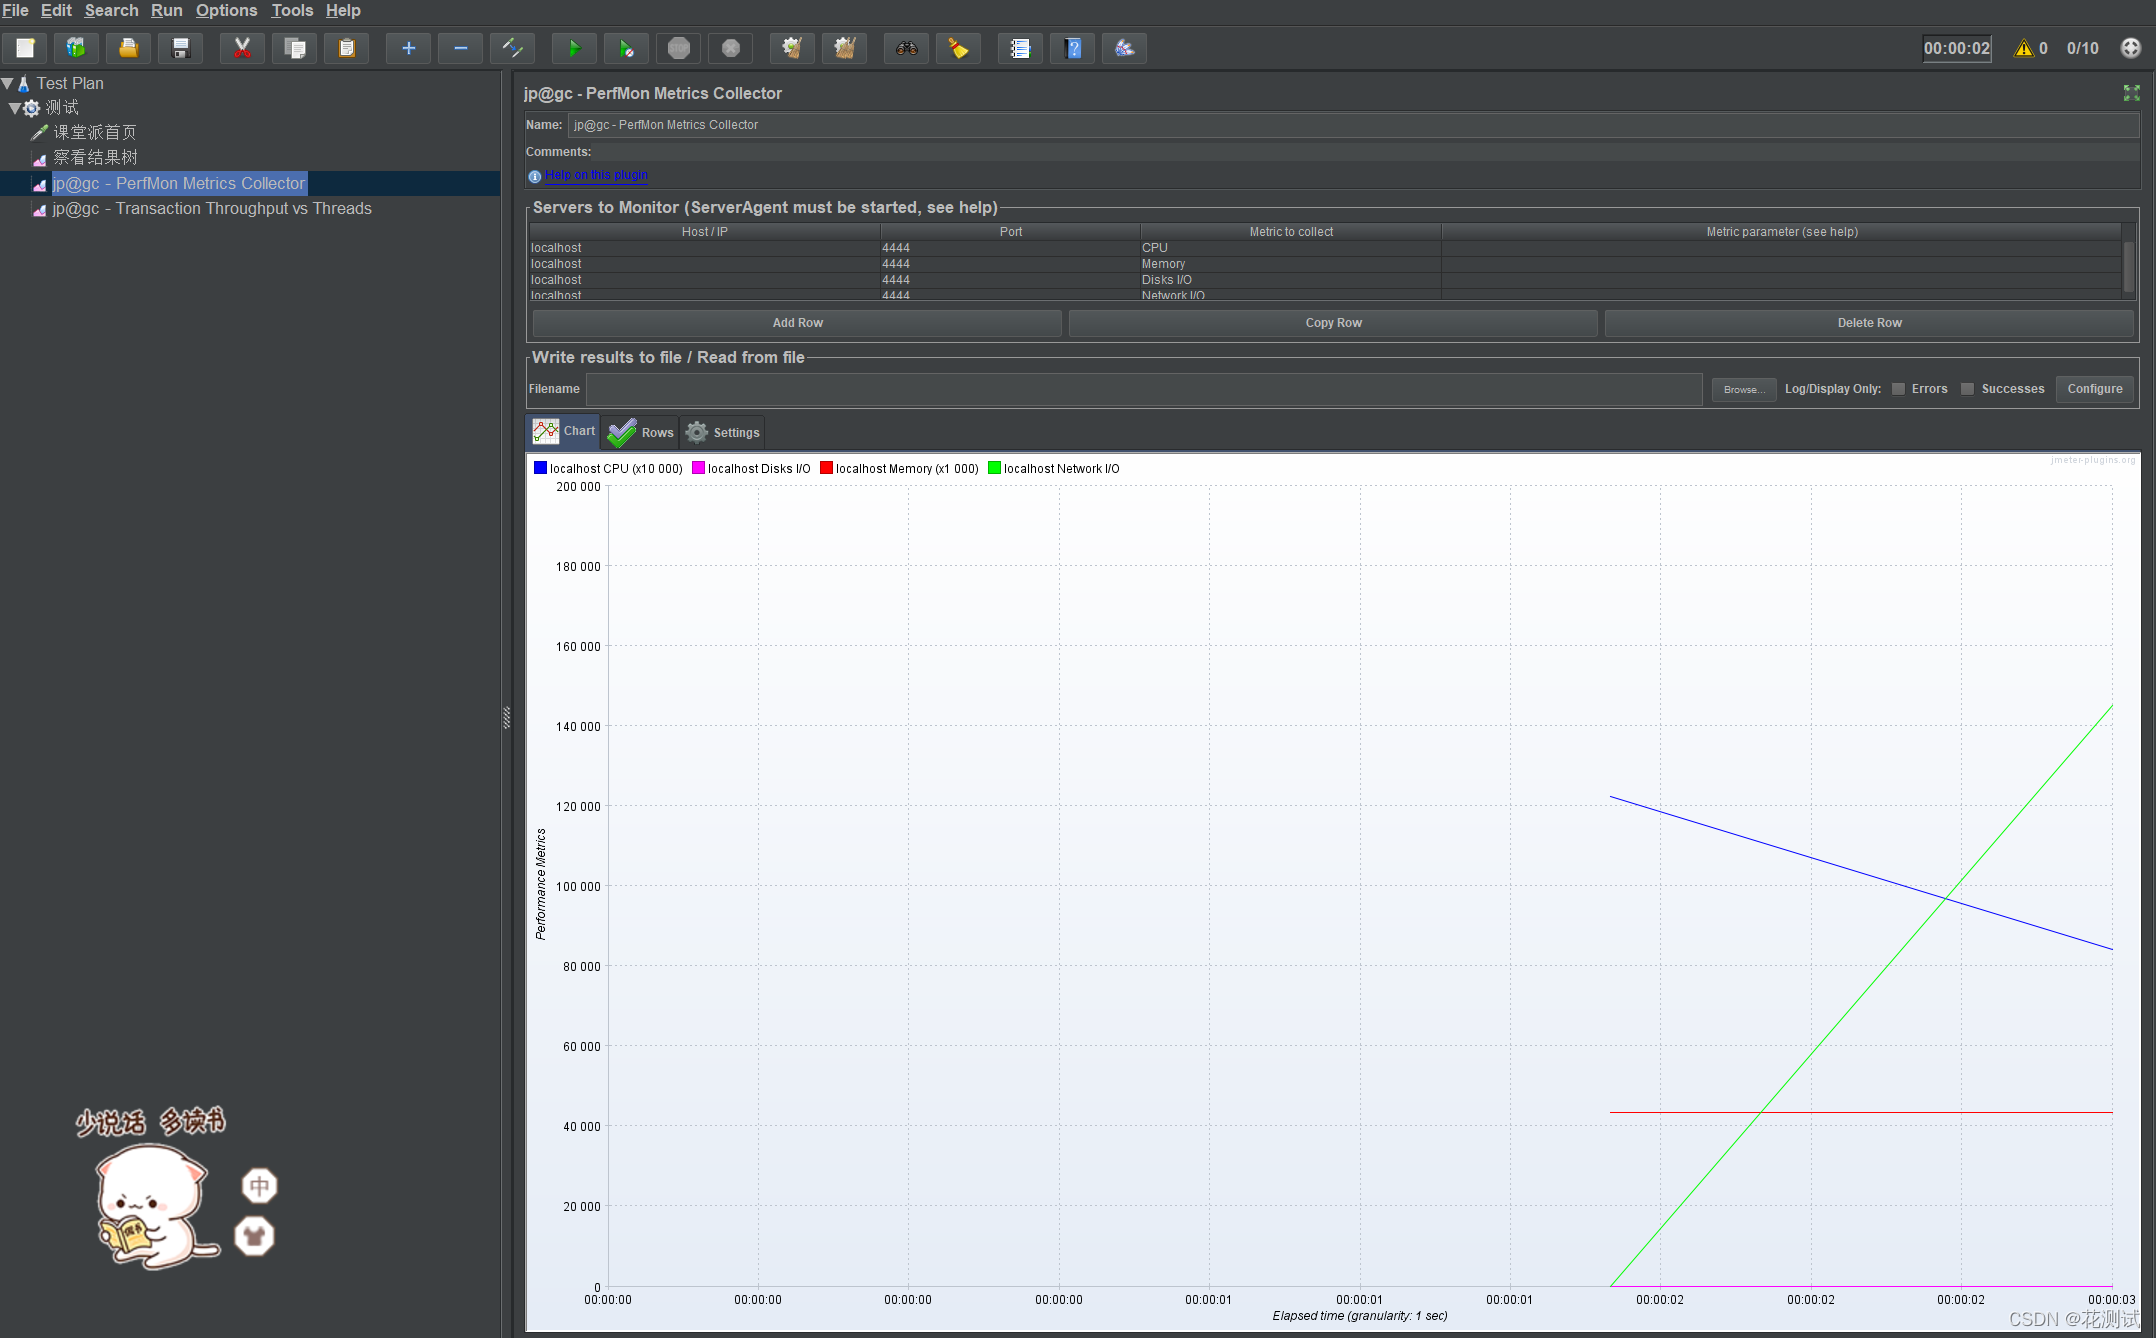
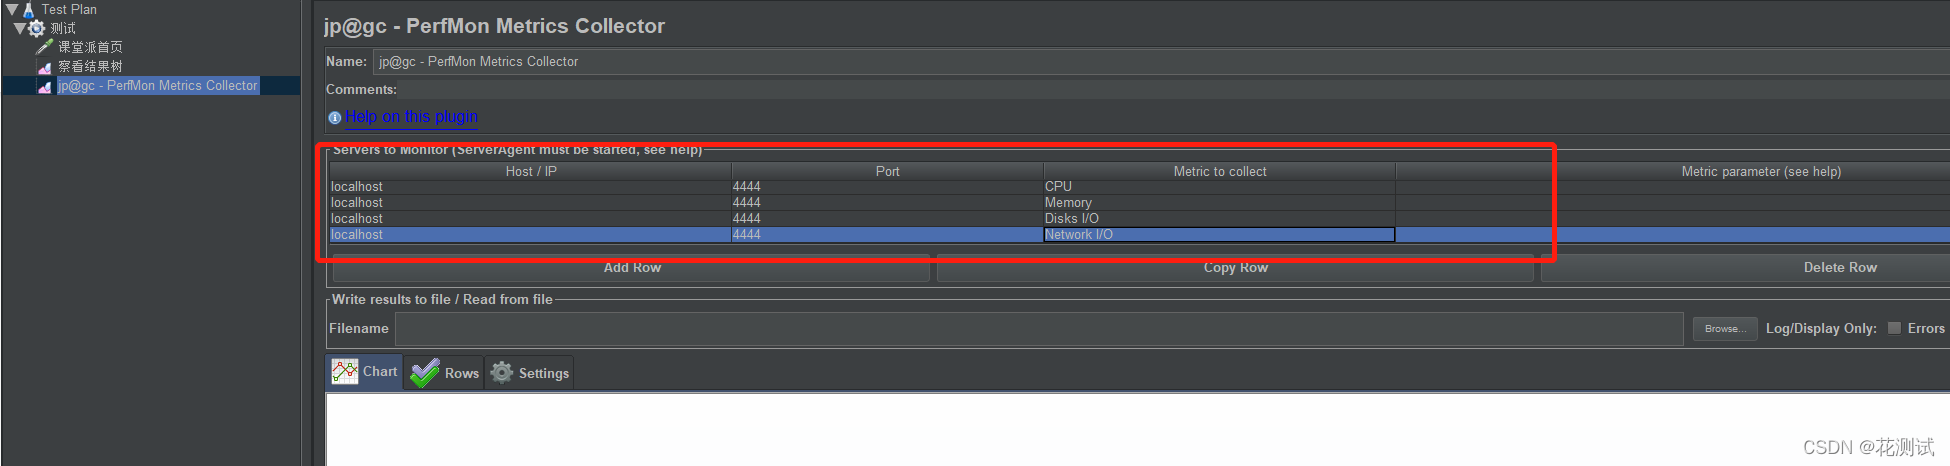
2) Configure the data to be monitored
Click Add Row, a row will be added, and then click the "Metric to collect" column to select the indicators to be monitored: CPU, Memory, Disks I/O, Network I/O, etc.
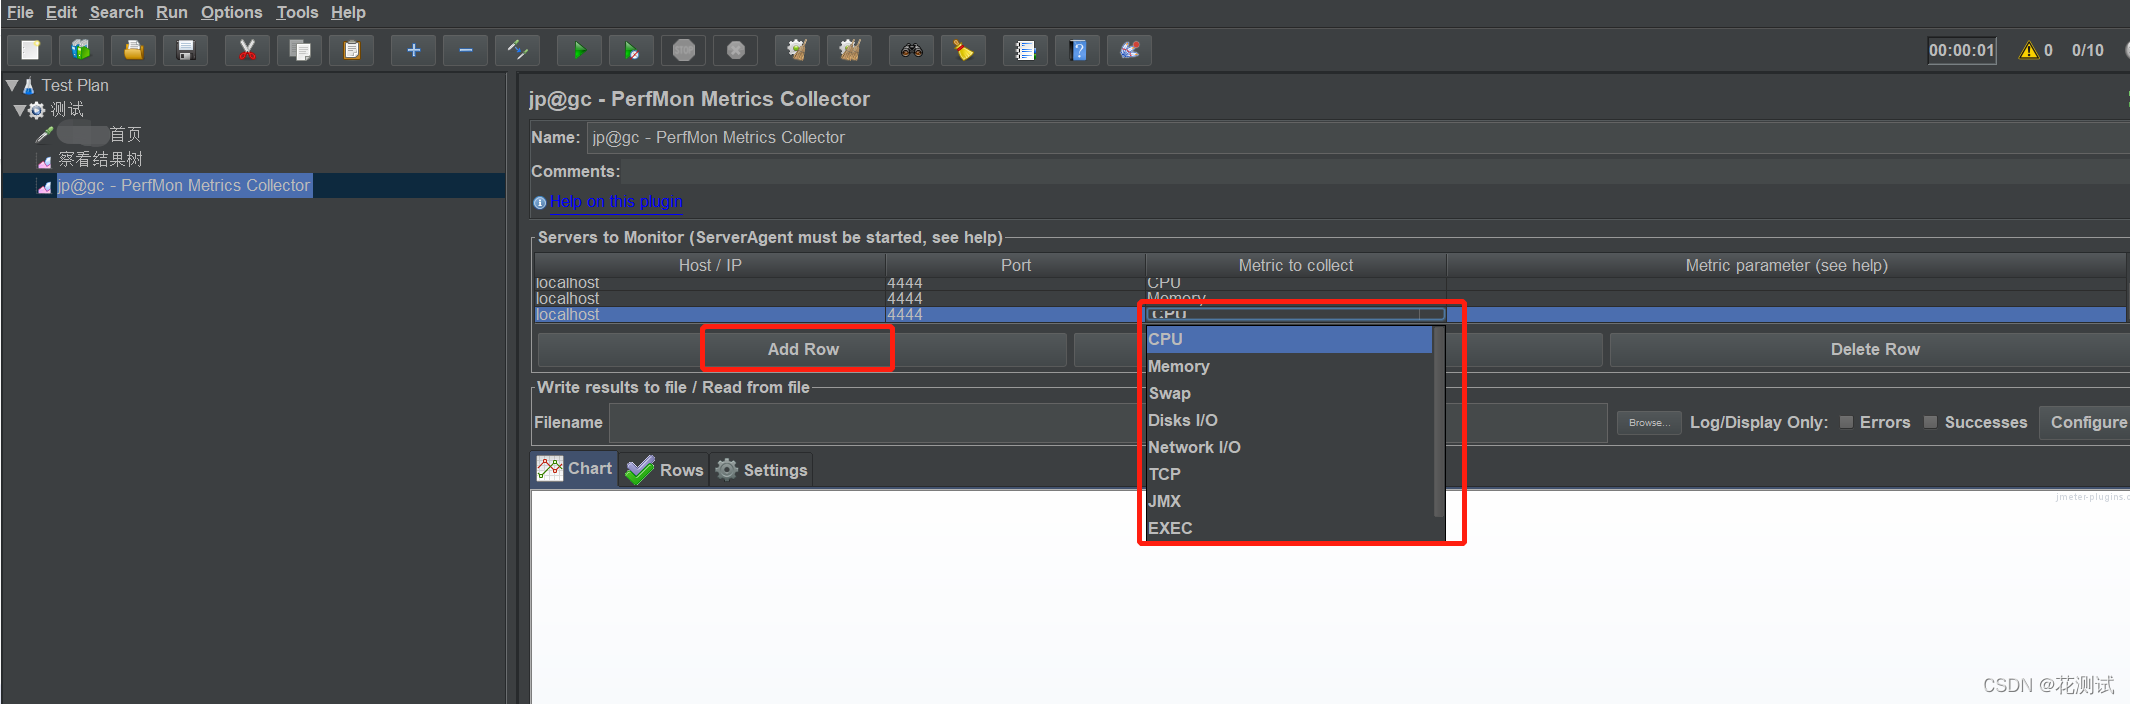
ps: Host/IP is the IP of the server where ServerAgent-2.2.3 is located, and the default port is 4444 (if the port number of ServerAgent is not modified), no need to modify it. After configuration, it is as shown below
3) View the performance indicators corresponding to the test results
Perform the simplest single-interface pressure test, assuming that the number of threads is set to 10, and then start, and the corresponding performance indicators can be seen after the end. (Please prepare the interface information by yourself)
As shown in the figure below: CPU, Memory, Disks I/O, Network I/O