network
netstat: Used to display the local network connection, running port, routing table and other information
-n: Refuse to display aliases, and convert all numbers that can be displayed into numbers.
-l: List only the service status that is listening
-p: Display establishment The program name of the corresponding connection
-t: display tcp-related options
-u: display udp-related options
-i: automatically match the interface information -c: execute the netstat command at regular
intervals Not in the listening state netstat -i 1: print once per second, check the size of the network transmission and whether there is an error

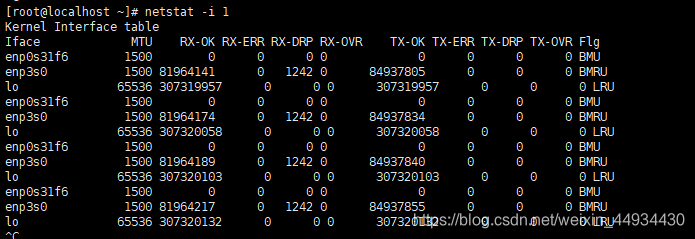
Iface: Network interface name
MTU: Maximum transmission unit, unit byte
RX-OK: When receiving, the correct number of packets (received bytes)
RX-ERR: When receiving, the number of incorrect packets
RX-DRP: Receive RX-OVR: number of packets lost
due to overspeed when receiving RX-OVR: number of packets lost due to overspeed
when receiving TX-OK: correct number of packets (bytes sent) when sending
TX-ERR: error when sending
TX-DRP: the number of discarded packets when sending TX
-OVR: the number of packets lost due to overspeed when
sending
Loopback device
M receives all packets
N avoids tracking
O on this interface, disable ARP
P this is a point-to-point connection
R interface is running
U interface is "active"
disk
iostat
monitors the disk, the output mainly displays the statistical information of disk read and write operations, and also gives the usage of cpu.
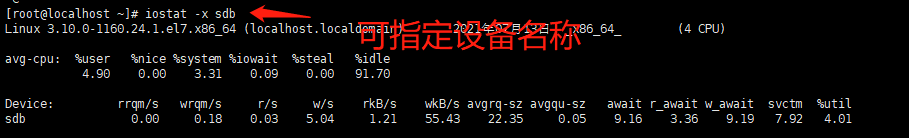
-x device output specifies the name of the disk device to be counted, and the default is all disk devices
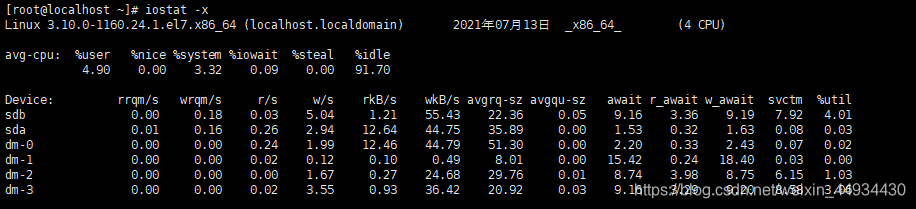
device: device name
rrqm/s: the number of merged read requests per second, the file system merges requests to read the same block
wrqm/: the number of write requests to the device per second
r/s: the number of reads per second
w/s : Number of writes per second
rkB/s: Amount of data read per second
wkB/s: Amount of data written per second
avgrq-sz: Average number of io operations per second (in units of sectors)
avgqu-sz: Average io queue Length
await: average waiting time for each io, including waiting time and processing time, in ms, general system io response time should be less than 5ms r_await: read
waiting
w_await: write waiting
svctm: average processing time for each io, unit ms
% util: the percentage of time spent in 1 second for io operations. Indicates how busy the system is