rectpulsis a function in MATLAB that creates a rectangular pulse signal. The syntax of this function is as follows:
y = rectpuls(t, width)
where tis the time axis and widthis the pulse width. yis the output rectangular pulse signal.
tRefers to the time axis, which is a vector containing a series of time points, used to describe the time domain (time domain) characteristics of the signal. In this example, an equally spaced vector from to linspace(-5, 5, 1000)is created with a total of 1000 points, that is, 1000 time points on the time axis.-55
widthis the width of the rectangular pulse, ie the duration of the pulse. In this example, widthit is set to 2, which means the duration of the pulse is 2 time units. Therefore, rectpuls(t, 2)a rectangular pulse signal with a width of 2 is created, which t=0reaches its maximum value at time and is 0 at other time points.
Here is an example of using rectpulsthe function to create a rectangular pulse signal:
t = linspace(-5, 5, 1000);
y = rectpuls(t, 2);
plot(t, y);
ylim([0,1.25]);
xlabel('Time');
ylabel('Amplitude');
title('Rectangular Pulse');

hold;
plot(1,0,'o');text(1,0,'(1,0)');
plot(-1,0,'o');text(-1,0,'(-1,0)');
text(-0.5,1.1,'width = 2');
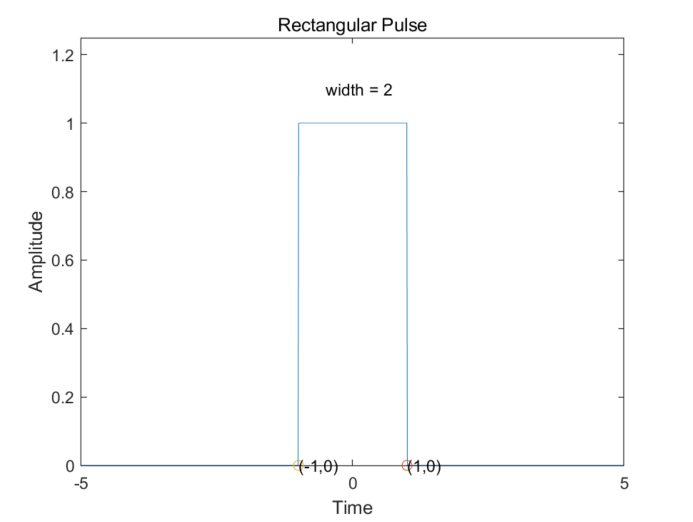
In this example, linspace(-5, 5, 1000)a timeline with 1000 points is created. rectpuls(t, 2)A rectangular pulse signal with a width of 2 is created. Finally, plot(t, y)this rectangular pulse signal is plotted.
In summary, rectpulsthe two input parameters of the function tand widthtogether describe a rectangular pulse signal with a width in the time domain and from widthto on the time axis .-width/2width/2