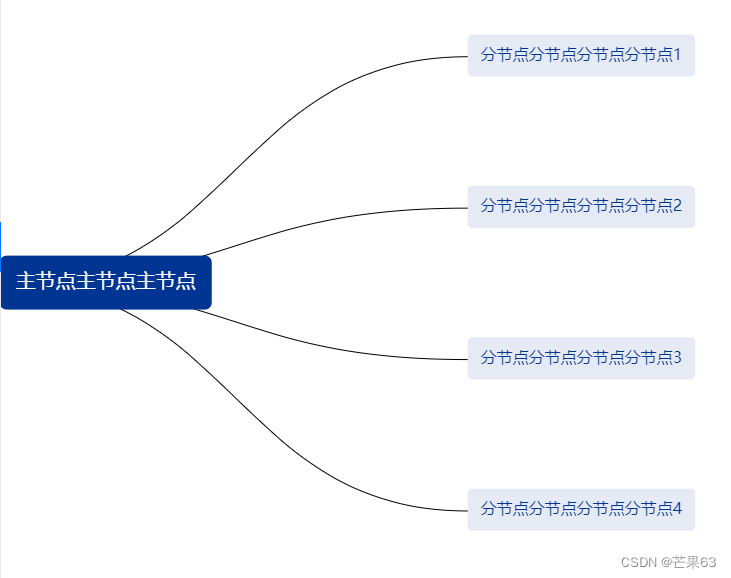
Project scenario:
It is required to realize the style shown in the above picture, using echarts
Data Format:
var data = [{
    name: "主节点主节点主节点",
    children: [{
        name: "分节点分节点分节点分节点1",
    }, {
        name: "分节点分节点分节点分节点2",
    }, {
        name: "分节点分节点分节点分节点3",
    }, {
        name: "分节点分节点分节点分节点4",
    }]
}];
Implementation code
myChart.showLoading();


var data = [{
    name: "主节点主节点主节点",
    children: [{
        name: "分节点分节点分节点分节点1",
    }, {
        name: "分节点分节点分节点分节点2",
    }, {
        name: "分节点分节点分节点分节点3",
    }, {
        name: "分节点分节点分节点分节点4",
    }]
}];

myChart.hideLoading();
myChart.setOption(option = {
     backgroundColor: '#fff',
        series: [
            {
                type: 'tree',
                // name: '',
                data: data,
                itemStyle: {
                    normal: {
                        lineStyle: {
                            color: '#000',
                            width: 1,
                            type: 'solid' // 'curve'|'broken'|'solid'|'dotted'|'dashed'
                        },

                    },
                },
                top: '0%',
                bottom:'10%',
                right: '50%',
                left:'0',
                symbolSize: 1,
                initialTreeDepth: 2,
                edgeShape:'curve', //曲线curve和折线polyline两种,
                emphasis:{disabled:true},
                label: {
                    normal: {
                        position: 'center',
                        verticalAlign: 'middle',
                        align: 'left',
                        backgroundColor: '#003594',
                        color: '#fff',
                        padding: 3,
                        borderRadius:[8],
                        formatter: [
                            '{box|{b}}'
                        ].join('\n'),
                        rich: {
                            box: {
                                height: 28,
                                color: '#fff',
                                padding: [10, 13],
                                align: 'center',
                                fontSize:20,
                            }
                        }
                    }
                },
                leaves: {
                    label: {
                        normal: {
                            position: 'center',
                            verticalAlign: 'middle',
                            align: 'left',
                            backgroundColor: '#E5EAF4',
                            borderRadius:[5],
                            formatter: [
                                '{box|{b}}'
                            ].join('\n'),
                            rich: {
                                box: {
                                    height: 20,
                                    color: '#003594',
                                    padding: [8, 10],
                                    align: 'center',
                                    fontSize:16,
                                }
                            }
                        }
                    }
                },
                expandAndCollapse: false,
                animation:false,
            },
        ]
});
that's all.
Follow-up test question one:
The number of data returned is inconsistent, and the height cannot be fixed, otherwise the vertical data will be stacked together. As shown in the picture:


Solution:
We found a method to render the height dynamically without setting a fixed height. We can multiply the length of the returned data by the height of our single data to set a reference value. If the reference value exceeds the reference value, use the value of length × single high-speed as the dynamic height; the implementation code is as follows:
    var myChart = echarts.init(document.getElementById(id));
    let option = {}    //此处为图表配置
    myChart.setOption(option, true);
    //基准值为350,也相当于css设置的最小高度;
    var autoHeight = chart_jsonData[0].children.length * 60 > 350 ?
    chart_jsonData[0].children.length * 60 : 350;
    myChart.getDom().style.height = autoHeight + "px";
    myChart.getDom().childNodes[0].style.height = autoHeight + "px";
    myChart.getDom().childNodes[0].childNodes[0].setAttribute("height",autoHeight);
    myChart.getDom().childNodes[0].childNodes[0].style.height = autoHeight + "px";
    //图表可以根据宽度变化自适应
    myChart.resize();
    window.onresize = myChart.resize;