foreword
Front-end performance is a crucial point to test a front-end siege lion technology. Perhaps many new-generation migrant workers have mastered or understood some methods of front-end optimization, but it is difficult to flex their muscles in actual project work. At this point, it is important to understand the optimization method, and it is also important to understand the performance monitoring. As the saying goes, if you go to the doctor indiscriminately when you are sick, you don’t know where there is a performance problem, so how to perform targeted optimization? Below, Abin will summarize some practical methods for front-end performance monitoring.
1. Google Console
1. network waterfall road waterfall
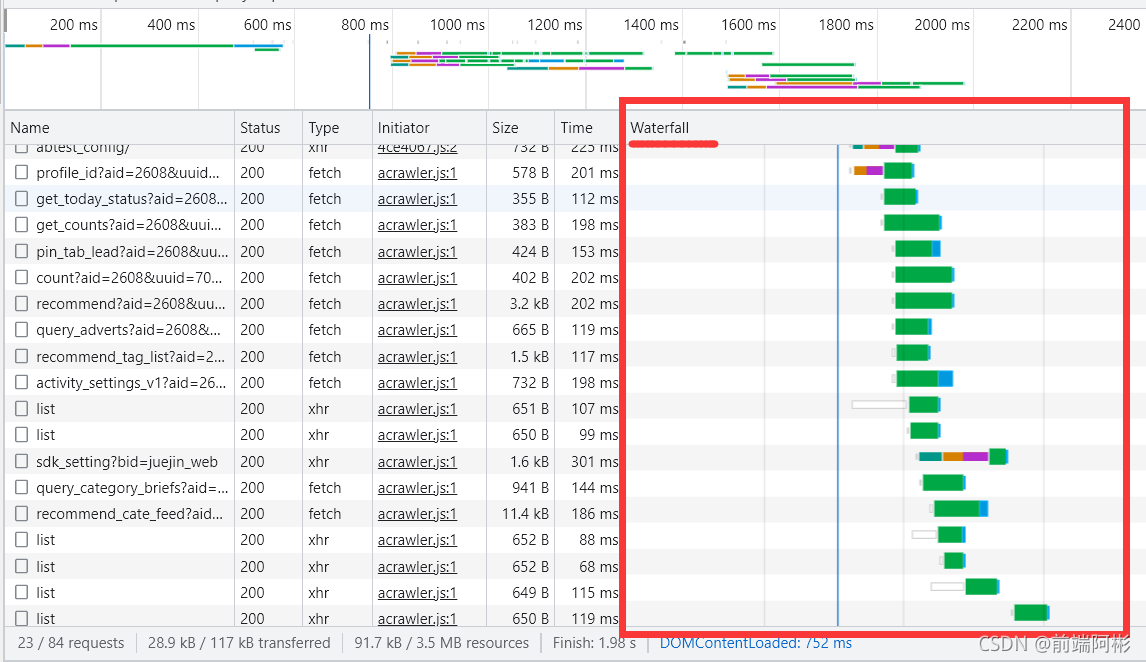
Everyone on the earth knows that the network is the place to view webpage loading resources and request information. Careful viewers will find that there is a place called waterfall here. As the name suggests, it is called waterfall flow. First, we can intuitively see the duration of each request. After clicking each color block, we can see which part of the request time is spent. When you understand the meaning of each color and each indicator, you can analyze some network request problems in your web page.
Color
There are several colors in the waterfall: light gray, dark gray, orange, green, blue
Light gray: querying
Dark gray: stagnant, proxy forwarding, request sending
Orange: initial connection
Green: waiting
Blue: content downloading
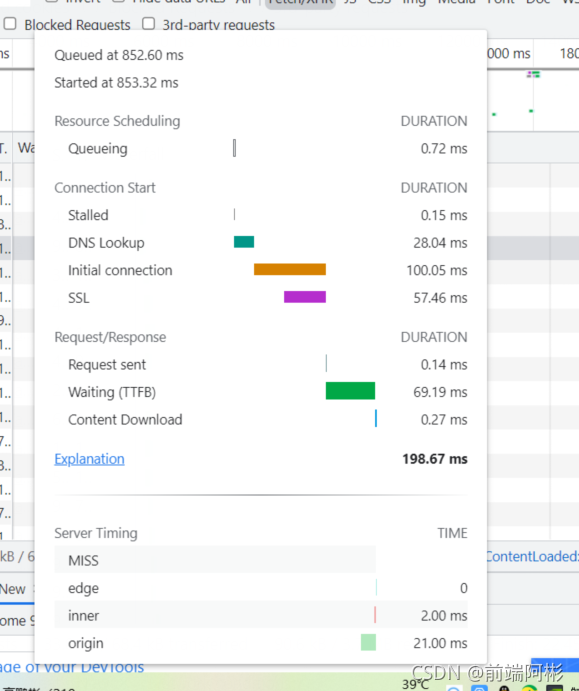
Various indicators
-
Queueing (light gray)
The time when the browser puts resources into the queue, for example: encountering a higher priority request or request concurrency exceeding 6. -
Stalled (dark gray)
Stall time due to put time. -
Proxy negotiation
negotiates time with the proxy server. -
DNS Lookup (dark green)
DNS resolution time, the browser needs to convert the domain name to IP. -
Initial Connection (orange)
The time it takes to establish an HTTP connection before the browser sends a request. -
SSL (purple)
If the website uses HTTPS, this is when the browser establishes a secure connection with the server. -
Request sent
The time when the request was sent. -
Waiting (TTFB) (green)
The time to wait for the server to return data, this time is subject to the processing performance of the server. -
Content Download (blue)
The time it takes for the browser to download resources, which is subject to file size and bandwidth.
Analyzing
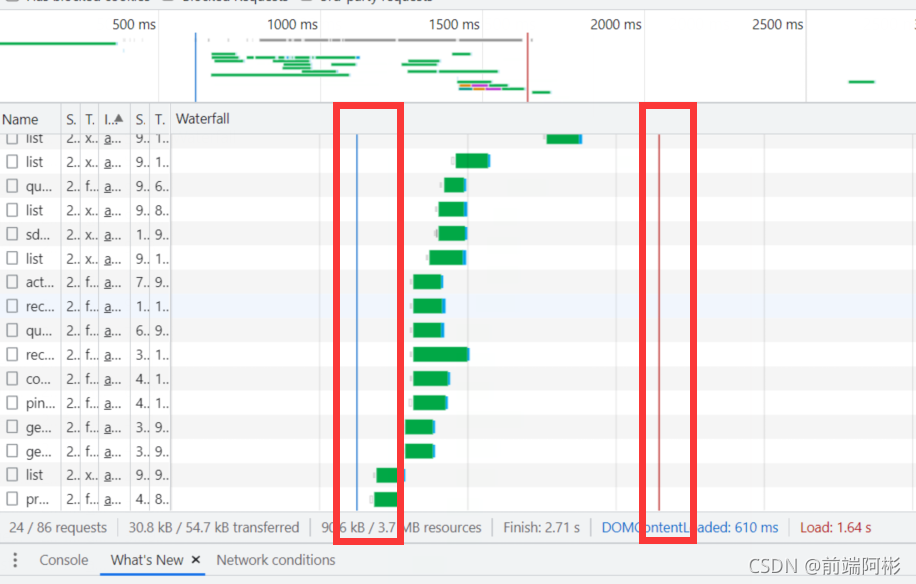
the waterfall flow in chrome, we can see two lines: blue and red. The blue line indicates the completion of DOM loading, and the red line indicates the time when all declared resources on the page are loaded.
Through the splitting of resource loading time by waterfall flow, we can observe which resources take a long time to load or cause congestion, so as to optimize them. We can consider optimization from the following aspects:
- Reduced loading time for all resources. That is, reduce the width of the waterfall chart product. The narrower the waterfall, the faster the website
- Reducing the number of requests means reducing the height of the waterfall chart. The shorter the waterfall chart, the better
- Optimize the order of resources and reduce the opening time of the first screen. Move the green "Start Rendering" line to the left. The further the line is moved to the left, the better.
- Reasonably converge and diverge the domain names of the website. Too many domain names will cause more HTTP connections to fail to be reused. Too few domain names will cause the browser to wait beyond the limit.
- Reduce the number of HTTP requests, such as rational use of client cache, and now there are some front-end tools that can merge JS/CSS resources, etc.
2. performance
In Google Chrome debug mode, switch to the performance tab. Click the refresh icon (or Ctrl+Shift+E shortcut) to start the analysis.
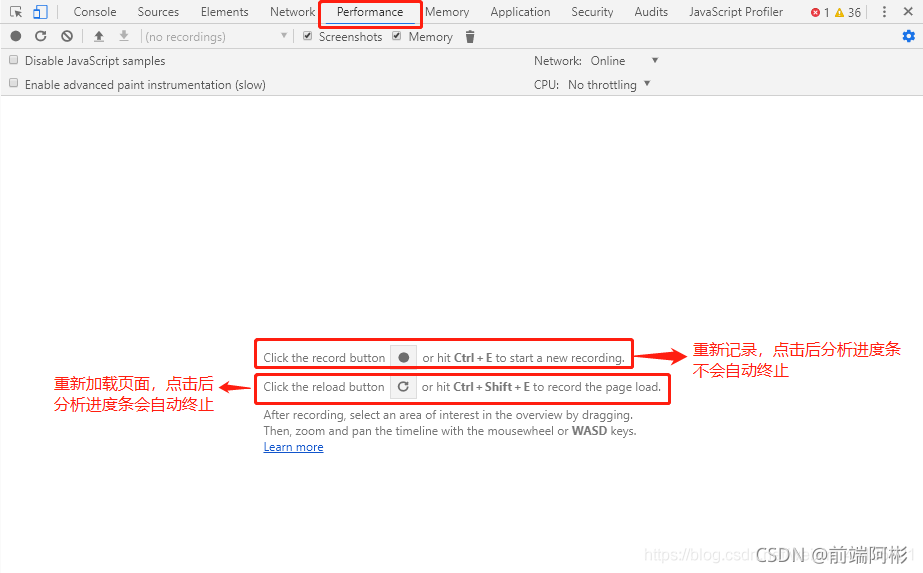
After stopping, the performance analysis graph appears.
Points to note:
1. You need to check the screenshot option, and then the screenshot below will appear (usually it is checked by default).
2. The time axis of the entire analysis graph is the time of the analysis progress bar in the previous steps, and the time axis of the area that appears by default is the loading time of the first screen.

As shown in the figure:
(1) The part framed in red above (also the entire time axis) is the analysis time of the previous analysis progress bar.
(2) The above green box is the loading time of the first screen.
(3) The first screen loading time scale is consistent with the total time of the tab Summary.
(4) As shown in the figure below, the time axis area can be adjusted through the left and right borders. Time axis area 2 is an enlarged version of time axis area 1, which is convenient for viewing the performance of various indicators in the time axis interval.
For more detailed explanations, you can read this article to explain the performance tab of Google Chrome
3. Lighthouse (Easy to use and recommended!!!)
Lighthouse is an open source automation tool for improving the quality of web applications.
It detects and scores the Performance, Accessibility, Best Practices, and SEO of the webpage, and gives corresponding optimization suggestions , which is convenient for webmasters to optimize the loading speed of webpages, search engine rankings, etc.
Performance - 性能检测,如网页的加载速度、响应时间等
Accessibility - 铺助检测,如网页的可访问性问题,HTML代码标签之类的优化等
Best Practices - 实践性检测,如网页安全性,如是否开启HTTPS、网页存在的漏洞等
SEO - 搜索引擎优化检测,如网页title是否符合搜索引擎的优化标准等
Operation method
Open the address of the webpage to be detected,
right-click to check and open the Lighthouse tab, click the "Generate report" button in the opened window to generate a detection report
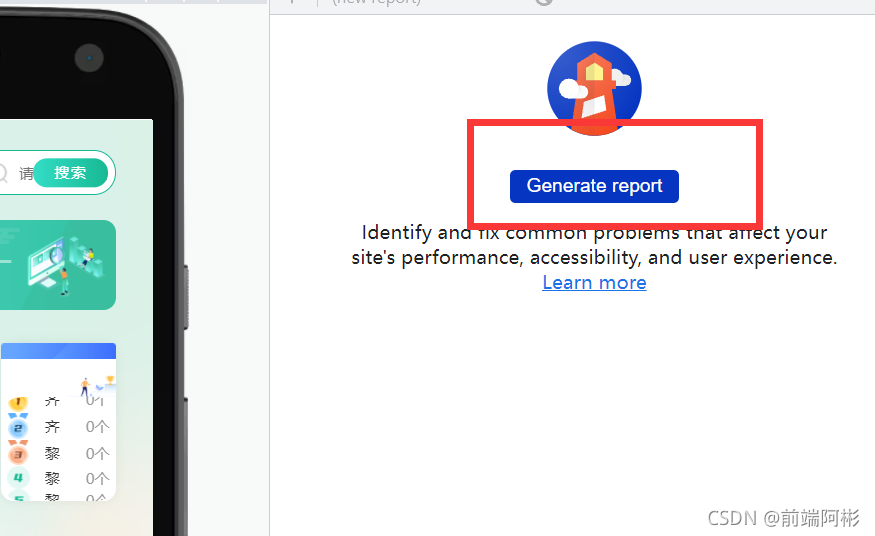
After a while, the detection results of the webpage and optimization suggestions will be given
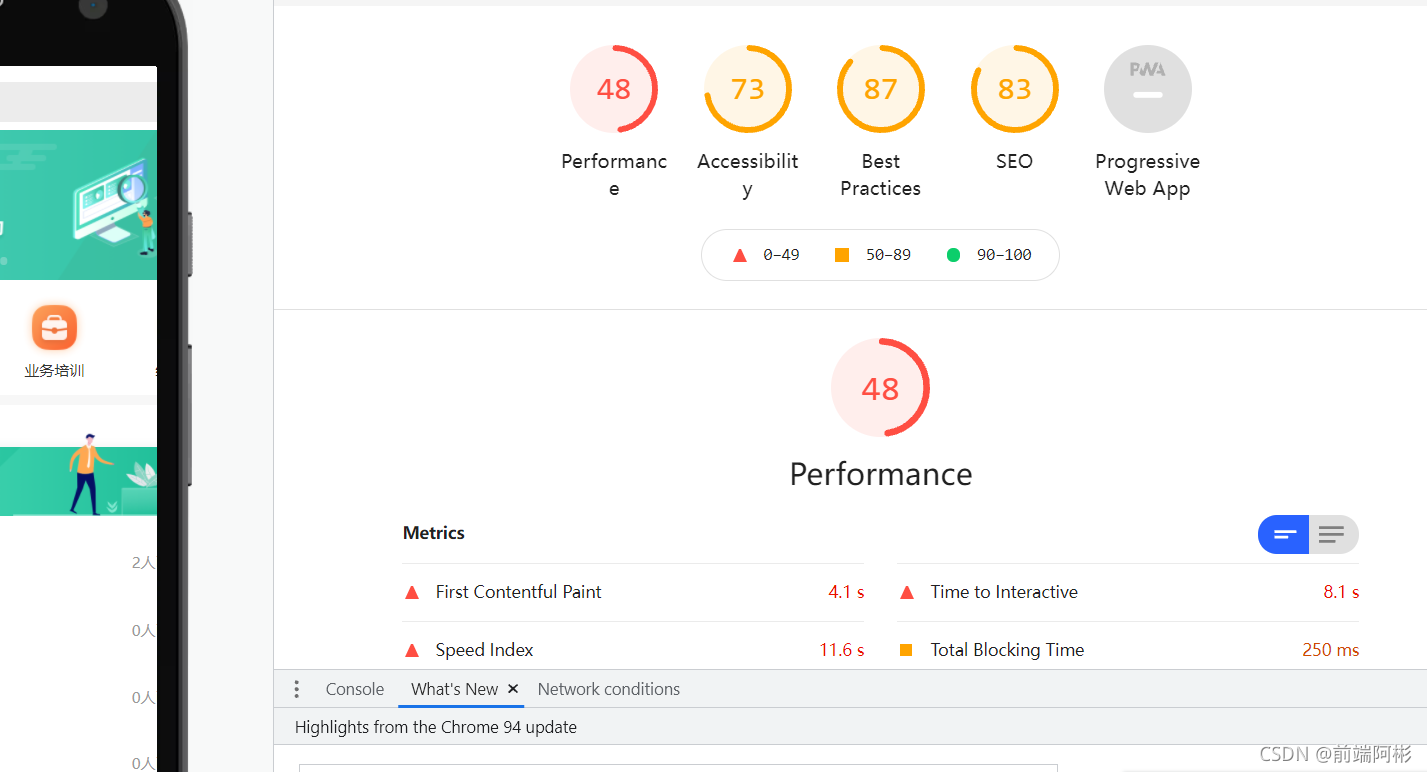
The above results show that the page performance (such as loading speed) score is low, and relevant optimization tips are given.
4. Google Plugin PageSpeed Insights
- Download address: Portal
- Installation method: Open the extension program of Google Chrome, and drag the downloaded crx file into it.
- How to use:
Right-click directly on the page, then select inspect element, and find the PageSpeed tab.
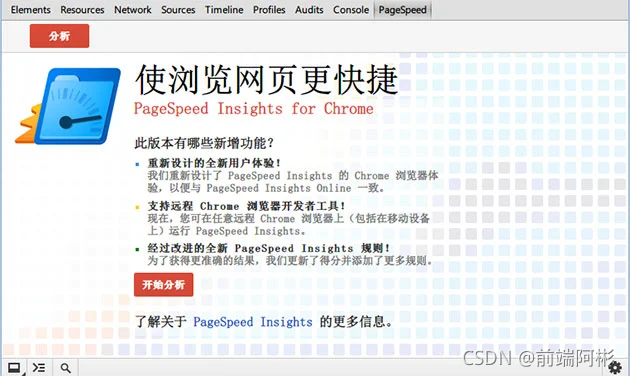
Click to start the analysis, and wait a moment to see the analysis results~
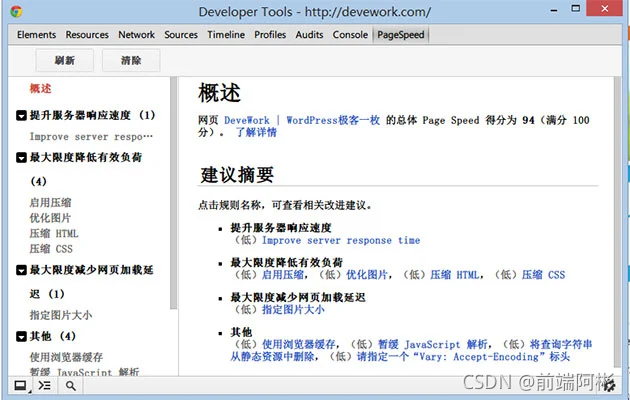
Analysis
PageSpeed's analysis is based on a list of best practices divided into five categories:
- Optimizing caching - completely avoiding the use of the network for your application's data and logic
- Reduce response time - reduce the number of chained request-response cycles
- Reduce request size - reduce upload size
- Reduce payload size - reduce the size of responses, downloads and cached pages
- Optimize Browser Rendering - Improve the browser's page layout
2. Use the console to perform performance testing and calculate code running time
1.console.time() compounding console.timeEnd()
console.time() cooperates with console.timeEnd() to output the running time of the code in between to the console.
Note that the same parameter is passed in, which is equivalent to the unique name of the timer.
console.time('计时器');
for (var i = 0; i < 1000; i++) {


      for (var j = 0; j < 1000; j++) {

    }
}
console.timeEnd('计时器');
The above code calculates the time required for the code block between console.time('timer'); and console.timeEnd('timer');
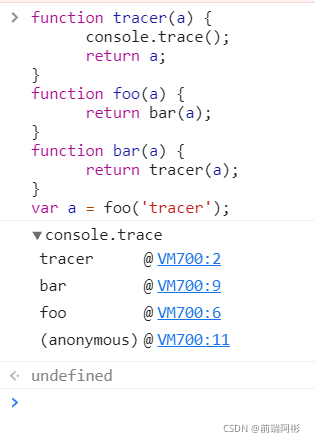
2. console.trace()
console.trace() is used to trace the calling process of the function.
In large-scale projects, especially framework development, the call trace of a function can be very complicated. The console.trace() method can clearly output the called process of the function to the console.
3. console.profile();
During development, we often need to evaluate the performance of a piece of code or a function. It is possible to manually print the time in the function, but it is not flexible enough and has errors. With the help of the console and the console.profile() method, we can easily monitor the running performance.
Although console.time() can calculate the running time of the code, console.time() is not applicable when analyzing JavaScript programs with complex logic and trying to find performance bottlenecks from them. In-depth analysis of the running of JavaScript programs with complex logic means inserting a large number of console.time() statements, which is undoubtedly unacceptable. For complex logic JavaScript program tuning, the correct way is to use console.profile().
Use : Insert console.profile() where you need to start the profile, and insert console.profileEnd() where you end the profile. Take the following code as an example:
However, console.profile() has compatibility issues . For details, you can check the compatibility check
function doTask(){


    doSubTaskA(1000);
    doSubTaskA(100000);
    doSubTaskB(10000);
    doSubTaskC(1000,10000);
}

function doSubTaskA(count){


    for(var i=0;i<count;i++){

    }
}

function doSubTaskB(count){


    for(var i=0;i<count;i++){

    }
}

function doSubTaskC(countX,countY){


    for(var i=0;i<countX;i++){


        for(var j=0;j<countY;j++){

    }
    }
}
console.profile();
doTask();
console.profileEnd();
4. new date() or Performance.now
This method is relatively stupid, but it can also be used.
new date() :
let t1 = new Date()
for (let i = 0; i <= 1000000; i++) {


     //测试计算机跑完100W次所需要时间
}
console.log('耗时',new Date() - t1);
//输出:耗时 2
Perfomance.now:
let array = [0,1,2,3]
const t0 = performance.now();
for (let i = 0; i < array.length; i++)
{


  // some code
}
const t1 = performance.now();
console.log(t1 - t0, 'milliseconds');
These two methods subtract the timestamp at the beginning from the timestamp after the function is executed, and are very similar in use. But there is a difference.
The Performance API provides access to the DOMHighResTimeStamp through its function performance.now(), which returns the time since page load in milliseconds with up to 5µs precision in fractions.
The performance API provides much more functionality than just returning a timestamp. It can measure navigation time, user time or resource time and more .
But if we just want to test the performance of a single function, then the timestamp is enough.
3. Calculate the white screen time (FP)
First Contentful Paint: It refers to the time from when the browser responds to the user inputting the network address to when the first content is rendered.
First screen time = the end time of the first screen content rendering - the time when the request starts
The white screen time is calculated from the time when the user starts requesting the page to the end of displaying the content. The intermediate process includes DNS query, establishing a TCP connection, sending the first HTTP request, returning the HTML document, and completing the parsing of the head of the HTML document.
Therefore, factors that affect the white screen time: network, server performance, and front-end page structure design.
It is generally considered that the time when the browser starts rendering or finishes parsing is the time when the white screen ends. So we can record a time point before all static resources and embedded scripts/styles in the head of the html document, and record another time point at the bottom of the head, and the difference between the two is used as the white screen time.
<!DOCTYPE html>
<html lang="en">
<head>
  <meta charset="UTF-8">
  <meta name="viewport" content="width=device-width, initial-scale=1.0">
  <title>白屏时间计算-常规方法</title>
  <script>
    window.pageStartTime = Date.now()
  </script>
  <link rel="stylesheet" href="https://b-gold-cdn.xitu.io/ionicons/2.0.1/css/ionicons.min.css">
  <link rel="stylesheet" href="https://b-gold-cdn.xitu.io/asset/fw-icon/1.0.9/iconfont.css">
  <script>
    window.firstPaint = Date.now()
    console.log(`白屏时间:${

      window.firstPaint - window.pageStartTime}`)
  </script>
</head>
<body>
  <div>这是常规计算白屏时间的示例页面</div>
</body>
</html>
White screen time = window.firstPaint - window.pageStartTime
This method has a disadvantage: the time information before parsing the HTML document cannot be obtained.
Fourth, calculate the first screen time (FCP)
The first screen time needs to know two time points: the start request time point and the end time point of the first screen content rendering. The start request time is the same as the white screen time, and the following is how to get the end time of the first screen content rendering.
The end time of the first screen should be when the first screen of the page is drawn, but currently there is no clear API to directly get this time point, so we can only outsmart it. For example, we need to know where the bottom of the first screen content is in the HTML document, then the bottom of the first screen content is also called the first screen line.
Common methods for calculating the first screen time:
1. First screen module labeling method
Marks the end position of above-the-fold content in the HTML document. It is only applicable to situations where there is no need to pull data and resources such as images are not considered to be loaded.
<!DOCTYPE html>
<html lang="en">
<head>
  <meta charset="UTF-8">
  <title>首屏</title>
  <script type="text/javascript">
    window.pageStartTime = Date.now();
  </script>
  <link rel="stylesheet" href="common.css">
  <link rel="stylesheet" href="page.css">
</head>
<body>
  <!-- 首屏可见模块1 -->
  <div class="module-1"></div>
  <!-- 首屏可见模块2 -->
  <div class="module-2"></div>
  <script type="text/javascript">
    window.firstScreen = Date.now();
  </script>
  <!-- 首屏不可见模块3 -->
  <div class="module-3"></div>
    <!-- 首屏不可见模块4 -->
  <div class="module-4"></div>
</body>
</html>
First screen time = firstScreen- performance.timing.navigationStart
2. Statistics on the loading time of the slowest image on the first screen
Usually the slowest loading of the first screen content is the image resource, so we will take the time of the slowest loading image in the first screen as the time of the first screen.
First screen time = time point of loading the slowest image - performance.timing.navigationStart
3. Custom module content calculation method
Because it is more complicated to count the time to complete loading of the first screen image. Therefore, in our business, we usually simplify the first screen time by customizing the module content. As follows:
Ignore the loading of resources such as pictures, only consider the main DOM of the page
and only consider the main modules of the first screen, not all content above the first screen in a strict sense.