1. JVM memory structure
1. The memory structure of the JVM is roughly divided into
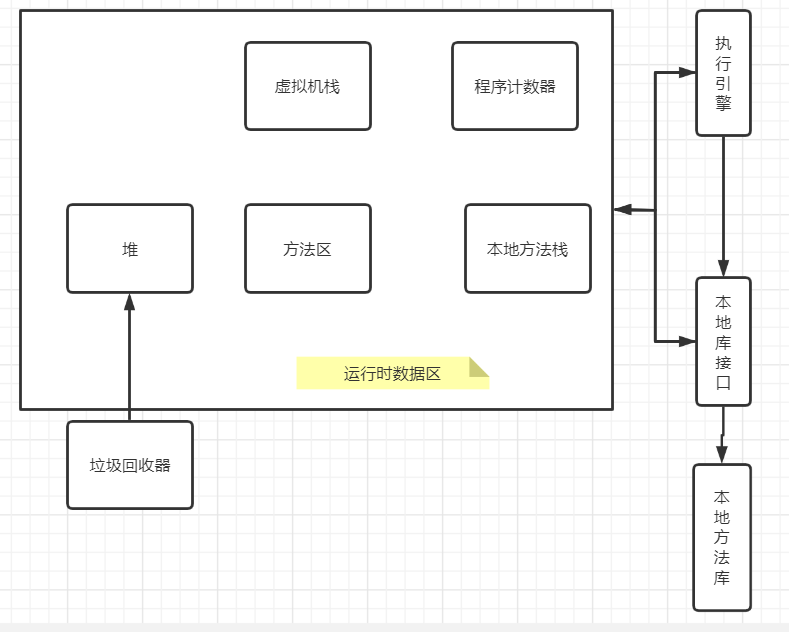
Heap
Thread sharing. All object instances and arrays are allocated on the heap. The object that the collector mainly manages.
Method Area
Also called static area, shared by threads. Store class information, constants, static variables, and code compiled by the just-in-time compiler.
Method Area (Method Area), like the Java heap, is a memory area shared by each thread. It is used to store data such as class information, constants, static variables, and code compiled by the instant compiler that have been loaded by the virtual machine. Although the Java virtual machine specification describes the method area as a logical part of the heap, it has an alias called Non-Heap (non-heap), which should be distinguished from the Java heap.
Method stack (JVM Stack)
Thread private. Store local variable tables, operation stacks, dynamic links, method exits, and object pointers.
Each thread will have a private stack. The method call in each thread will create a stack frame in this stack. Various basic data types (boolean, byte, char, short, int, float, long, double) and object references (reference type, which are not equivalent to the object itself) known during compilation are stored in the method stack. The memory space required for the local variable table is allocated during compilation. When entering a method, it is completely determined how much local variable space the method needs to allocate in the frame, and the size of the local variable table will not be changed during the running of the method.
Native Method Stack
Thread private. Serving the Native method used by the virtual machine. For example, when Java uses interface services written in c or c++, the code runs in this area. Native Method Stacks (Native Method Stacks) are very similar to virtual machine stacks. The difference is that the virtual machine stack serves the virtual machine to execute Java methods (that is, bytecodes), while the native method stack serves the Native methods used by the virtual machine.
Program Counter Register
Thread private. Some articles are also translated into PC Register (PC Register), the same thing. It can be seen as a line number indicator of the bytecode executed by the current thread. Points to the next instruction to be executed.
Can be thought of as an indicator of the line number of the bytecode being executed by the current thread. In the conceptual model of the virtual machine, the job of the bytecode interpreter is to change the value of this counter to select the next bytecode instruction to be executed. Basic functions such as branching, looping, jumping, exception handling, and thread recovery all depend on this counter. The program counter in the JVM is also the only area in the Java Virtual Machine Specification that does not specify any OutOfMemoryError conditions. A JVM thread can only execute the code of one method at any time, and the method can be a Java method or a native method.
focus
The focus is on the various parts of the Java memory runtime, the three areas of the program counter, virtual machine stack, and local method stack live and die with threads. The stack frames in the stack are in and out of the stack in an orderly manner as the method enters and exits. There is no need to think too much about memory recovery in these areas, because when the method or thread ends, the memory will naturally be recovered. However, the Java heap and the method area are different - the memory required by multiple implementation classes in an interface may be different, and the memory required by multiple branches in a method may be different. The allocation of this part of memory is dynamic, and we can only know which objects will be created during the running of the program. This part of memory is the focus of our attention.
2. jvm main memory and working memory
Main memory mainly includes local method area and heap. Each thread has a working memory, and the working memory mainly includes two parts, one is the private stack belonging to the thread and the register for copying some variables of the main memory (including the program counter PC and the cache area where the cup works).
- All variables are stored in main memory (part of virtual machine memory), shared by all threads.
- Each thread has its own working memory, which is a copy of certain variables in the main memory. All operations on variables by threads must be performed in the working memory, and variables in the main memory cannot be directly read and written.
- Threads cannot directly access the variables in each other's working memory, and the transfer of variables between threads needs to be completed through the main memory.
Java's multi-thread concurrency issues will eventually be reflected in the Java memory model. The so-called thread safety is nothing more than controlling the orderly access or modification of a resource by multiple threads. To sum up java's memory model, there are two main problems to be solved: visibility and order.
Multiple threads cannot pass data communication to each other, and the communication between them can only be carried out through shared variables. The Java Memory Model (JMM) stipulates that the jvm has main memory, and the main memory is shared by multiple threads. When an object is new, it is also allocated in the main memory. Each thread has its own working memory, which stores a copy of some objects in the main memory. Of course, the size of the thread's working memory is limited. When a thread operates an object, the execution sequence is as follows:
- Copy variables from main memory to current working memory (read and load)
- Execute code, change shared variable value (use and assign)
- Refresh main memory related content with working memory data (store and write)
2.1 The volatile keyword
Any variable modified by volatile is not copied to the working memory, and any modification is written in the main memory in time. Therefore, all threads can see the modification of variables modified by Valatile immediately, but volatile cannot guarantee that the modification of variables is in order.
2.2 synchronized keyword
Java uses the synchronized keyword as one of the means to ensure the orderliness of execution in a multi-threaded concurrent environment. When a piece of code modifies a shared variable, this piece of code becomes a mutex or a critical section. In order to ensure the correctness of the shared variable, synchronized marks the critical section.
A thread executes the critical section code process as follows:
- get sync lock
- clear working memory
- Copy variable copy from main memory to working memory
- Calculate these variables
- Write variables from working memory back to main memory
- release lock
It can be seen that synchronized not only guarantees the concurrency and order of multi-threads, but also ensures the memory visibility of multi-threads.
2. The memory analysis process of program execution
Sample code:
public class Person {

       String name;

       int age;

       public void show(){

              System.out.println("姓名:"+name+",年龄:"+age);

       }

}

public class TestPerson {

       public static void main(String[ ] args) {

              // 创建p1对象

              Person p1 = new Person();

              p1.age = 24;

              p1.name = "张三";

              p1.show();

              // 创建p2对象

              Person p2 = new Person();

              p2.age = 35;

              p2.name = "李四";

              p2.show();

       }

}
Memory analysis of the above code execution process (understand with the help of the above figure):
1. Set the stack frame from the main() method, because the main method is the entry point of the program, and the value of args is null
2. Create a p1 object, and the value of the p1 variable is null because it is a reference type
3. New Person() executes the construction method, and a new stack frame Person() needs to be opened in the virtual machine stack
4. At this time, an object will be added in the heap. The default value of name in the object is null, and the default value of age is 0.
5. There is a Person class in the method area, and the specific information of the show() method will be stored in the Person class
6. If the show() in the method area has an address, the show in the heap points to the show() in the method area; assuming that the address of the object in the heap is 0x1024, since Person p1 = new Person() object is assigned to p1, the address of p1 is 0x1024, and p1 in the main() stack frame points to the object in the heap
7. After executing Person p1 = new Person(), the Person() stack frame is popped
8. p1.age = 24 for assignment operation, the name in the address is no longer null, and the value becomes 24
9. p1.name = "Zhang San" for assignment operation, "Zhang San" is not a basic data type, String is equivalent to a class (class) in java and belongs to the reference data type, in the string constant pool in the method area, give the address to name
10. The p1.show() call will create a stack frame called p1.show() in the virtual machine stack. This stack frame has a default parameter this, and the address is 0x1024. This corresponds to the method currently called
11. Execute p1.show(), print the name and age, and pop the stack frame of p1.show()
12. Similarly, after creating the p2 object, the execution process of the code is the same as that of p1, and repeat steps 2-10
13. Finally, the main stack frame is popped out, and the virtual machine stack is recycled; the heap is recycled by the garbage processor, and the method area is also cleared in memory