learning target:
1. Tablet layout adapts to the screen
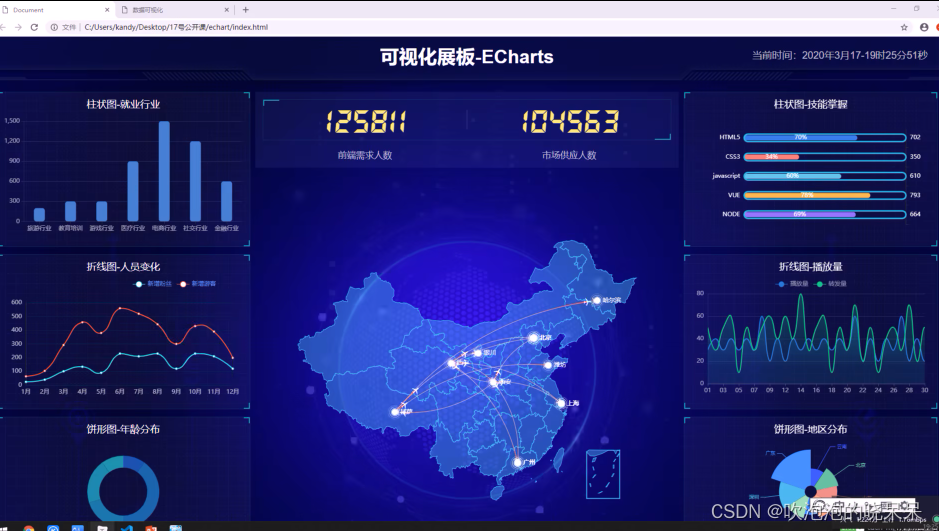
2. Use echarts to realize the display of histogram
Horizontal and vertical line pie map
Column chart layout common how to use echarts
release adaptation
Smart large screen adaptation based on flexible.js+rem
data visualization:
Main purpose: to convey and communicate information clearly and effectively by means of graphics and drawings
Data visualization can transform data from cold numbers into graphics, revealing the laws and principles in the data
Flex layout and top and bottom box layout
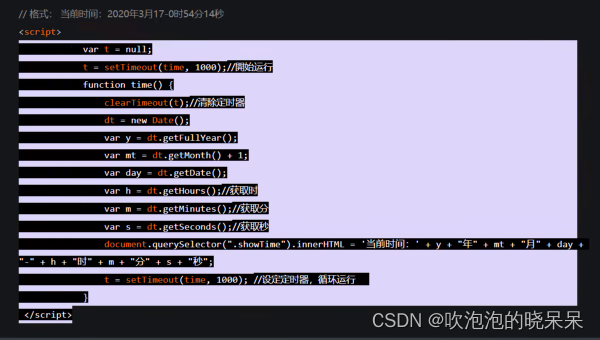
write the code
introduce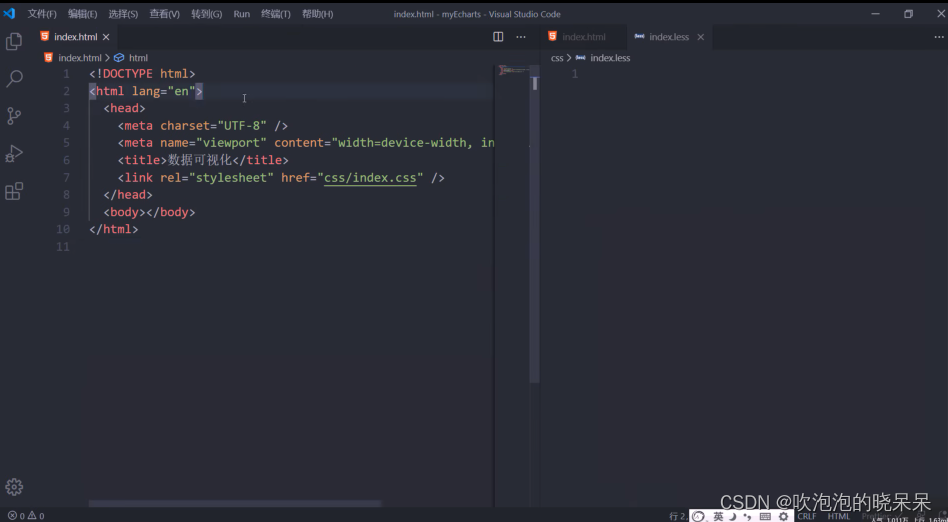
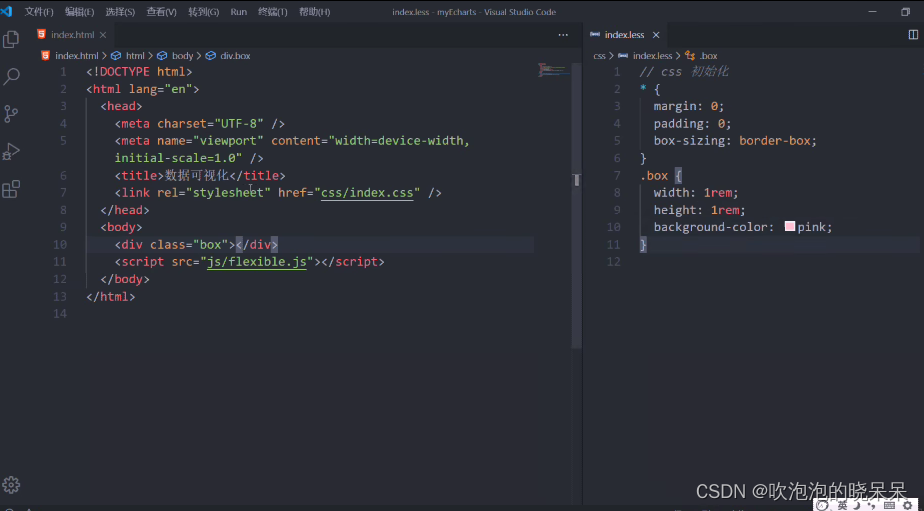
//css initialization
*{

    margin:0;
    padding:0
box-sizing:box

}
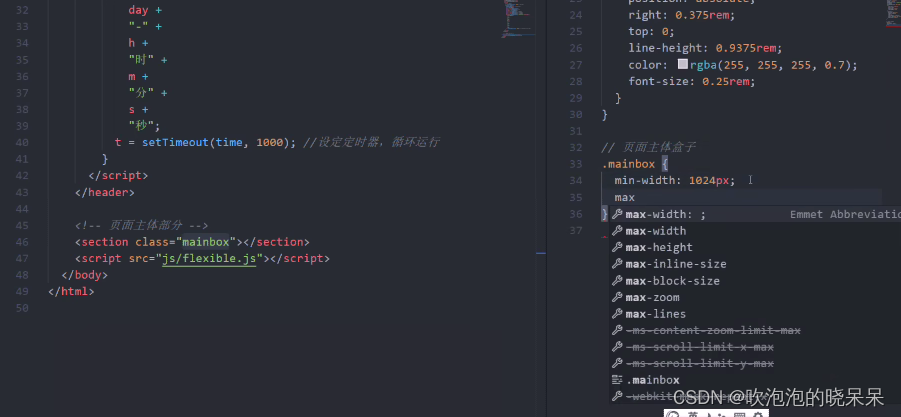
There is also a powerful editing plugin in the process:
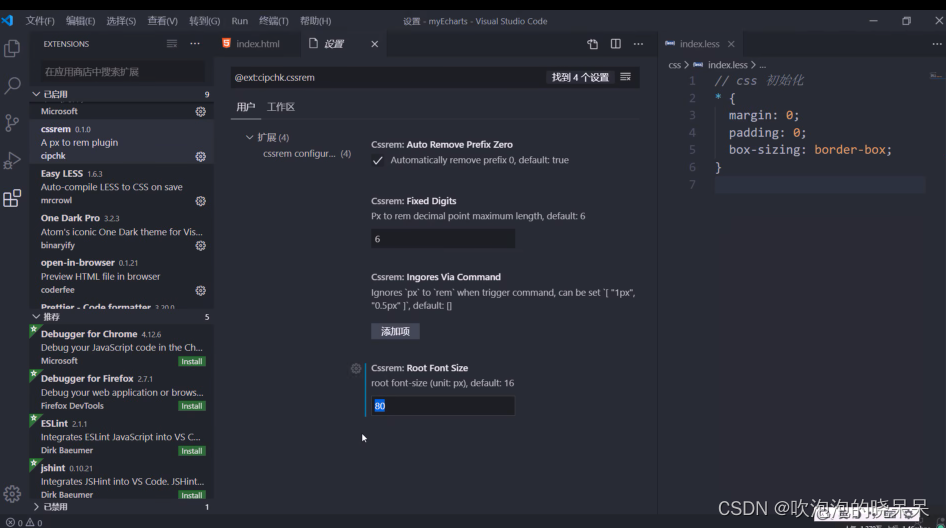 Help us automatically generate rem, we can change it to 80 for our subsequent use
1rem=80px

Be careful not to forget to restart your vscode after installing the plugin
Divide your own modules into blocks up and down
Title above, box below partition
Basic Settings:

header layout:
head:


Realize the effect:

Page Body: Setting Styles