Echarts (Data Visualization)
Starter case:
<%@ page language="java" import="java.util.*" pageEncoding="UTF-8"%>
<%
String path = request.getContextPath();
String basePath = request.getScheme()+"://"+request.getServerName()+":"+request.getServerPort()+path+"/";
%>

<!DOCTYPE HTML PUBLIC "-//W3C//DTD HTML 4.01 Transitional//EN">
<html>
  <head>
    <base href="<%=basePath%>">

    <title>My JSP 'layout.jsp' starting page</title>

	<meta http-equiv="pragma" content="no-cache">
	<meta http-equiv="cache-control" content="no-cache">
	<meta http-equiv="expires" content="0">
	<meta http-equiv="keywords" content="keyword1,keyword2,keyword3">
	<meta http-equiv="description" content="This is my page">
	<!--
	<link rel="stylesheet" type="text/css" href="styles.css">
	-->
	<script type="text/javascript" src="${pageContext.request.contextPath }/js/jquery-1.8.3.js"></script>
	<script type="text/javascript" src="${pageContext.request.contextPath }/js/echarts/echarts.js"></script>
  	<style type="text/css">
  		.divClass{
  			width: 800px;
  			height:600px;
  			border: 1px solid black;
  			float: left;
  			margin-right: 5px
  		}

  	</style>
  </head>

  <body>
<!-- =============================================== ====Loading data via JavaScript============================================ ============ -->

	<div id="charts" class="divClass"></div>
	<script type="text/javascript">
		$(function(){
  				var myChart = echarts.init(document.getElementById("charts"));
  	  			//generate chart data
  	  			var option = {
  	  			    title : {
  	  		        text: 'A site's user access source',
  	  		        x:'center'
  	  		    },
  	  		    tooltip : {
  	  		        trigger: 'item',
  	  		        formatter: "{a} <br/>{b} : {c} ({d}%)"
  	  		    },
  	  		    legend: {
  	  		        orient: 'vertical',
  	  		        left: 'left',
  	  		        data: ['Direct access','email marketing','affiliate advertising','video advertising','search engine']
  	  		    },
  	  		    series : [
  	  		        {
  	  		            name: 'Access source',
  	  		            type: 'pie',
  	  		            radius : '55%',
  	  		            center: ['50%', '60%'],
  	  		            data:[
  	  		                {value:335, name:'Direct access'},
  	  		                {value:310, name:'email marketing'},
  	  		                {value:234, name:'Affiliate Ads'},
  	  		                {value:135, name:'Video ad'},
  	  		                {value:1548, name:'Search Engine'}
  	  		            ],
  	  		            itemStyle: {
  	  		                emphasis: {
  	  		                    shadowBlur: 10,
  	  		                    shadowOffsetX: 0,
  	  		                    shadowColor: 'rgba(0, 0, 0, 0.5)'
  	  		                }
  	  		            }
  	  		        }
  	  		    ]
  	  		};
  	  		myChart.setOption(option);

  			});

	</script>


<!-- ========================================================================================================================= -->


<!-- =============================================== ====Load data through json file========================================== ============= -->

	<div id="charts1" class="divClass"></div>
	<script type="text/javascript">
		$(function(){

			/********************************json data format************** ************************

			{
			"data":[
			                {"value":335, "name":"直接访问"},
			                {"value":310, "name":"Email Marketing"},
			                {"value":234, "name":"Affiliate Ads"},
			                {"value":135, "name":"Video Ads"},
			                {"value":1548, "name":"Search Engine"}
			       ],
			"name":["Direct Access","Email Marketing","Affiliate Advertising","Video Advertising","Search Engine"]
			}

			********************************************************************************/
  			$.get('${pageContext.request.contextPath }/json/echart_data.json',function(data){
  				var myChart = echarts.init(document.getElementById("charts1"));
  	  			//generate chart data
	  	  		myChart.setOption({
						// title property
					    title : {
					        text: 'A site's user access source',
					        x:'center'
					    },
					    //tip box properties
					    tooltip : {
					        trigger: 'item',
					        formatter: "{a} <br/>{b} : {c} ({d}%)"
					    },
					   	// legend properties
					    legend: {
					        orient: 'vertical',
					        left: 'left',
					        data: data.name
					    },
					    //data
					    series : [
					        {
					            name: 'Access source',
					            type: 'pie',
					            radius : '55%',
					            center: ['50%', '60%'],
					            date: date.date

					        }
					    ],itemStyle: {
  	  		                emphasis: {
  	  		                    shadowBlur: 10,
  	  		                    shadowOffsetX: 0,
  	  		                    shadowColor: 'rgba(0, 0, 0, 0.5)'
  	  		                }
  	  		            }
					});

	  			});


  		});
	</script>


<!-- ========================================================================================================================= -->

  </body>
</html>
page effect:
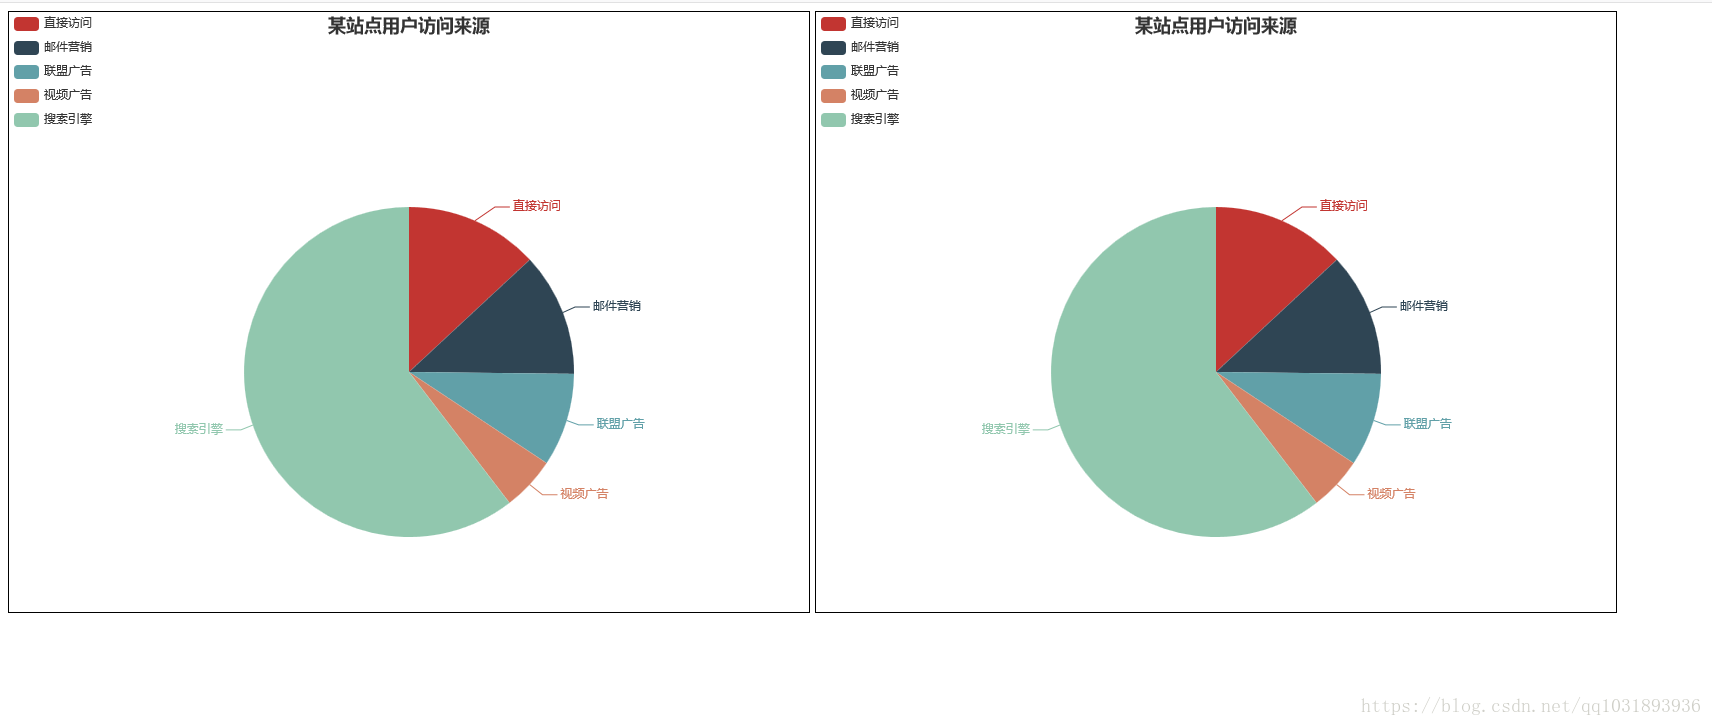
The json file format is not critical. As long as the required data is in the json string, there is a way to get it and generate a chart.
The SSH framework queries the data in the database to generate the chart:
The method of loading data in Action:
public String chart(){
/*
* 1. Call service#industryCount()
* 2. Save the returned result set and forward it to the page
*/
List<Object[]> list = customerService.getIndustryCount();
ActionContext.getContext().put("list", list);
HttpServletResponse response = ServletActionContext.getResponse();
response.setContentType("text/json;charset=UTF-8");
//Convert PageBean to JSON string and return it to the page
//Convert query result to json string
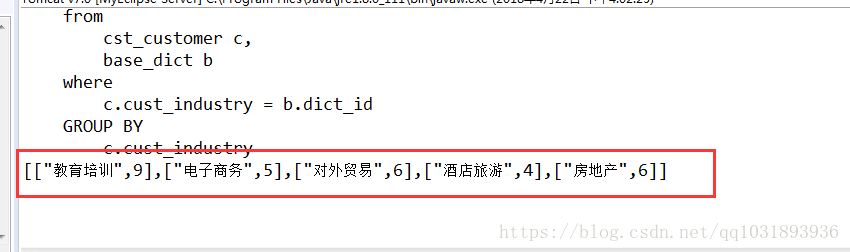
String json = JSONArray.fromObject(list).toString();
System.out.println(json);
//return json data
try {
response.getWriter().print(json);
} catch (IOException e) {
e.printStackTrace ();
}
return null;
}
Generated json string format:
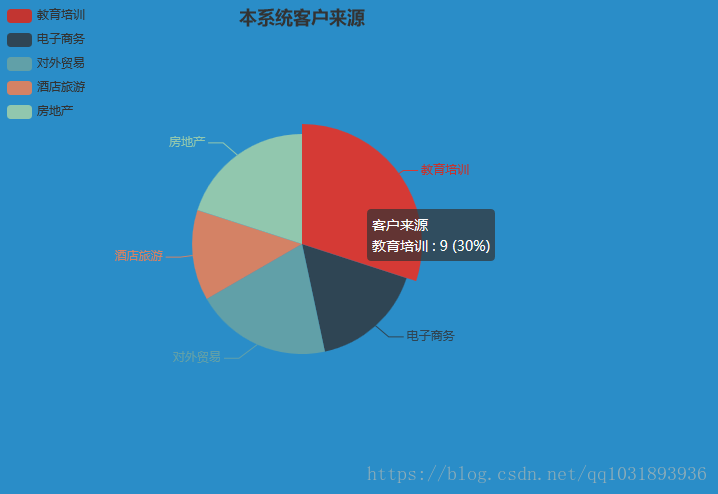
page:
<%@ page language="java" contentType="text/html; charset=UTF-8"
    pageEncoding="UTF-8"%>
<%@ taglib uri="http://java.sun.com/jsp/jstl/core" prefix="c" %>
<%@ taglib  prefix="s" uri="/struts-tags" %>
<!DOCTYPE html PUBLIC "-//W3C//DTD HTML 4.01 Transitional//EN" "http://www.w3.org/TR/html4/loose.dtd">
<html>
<head>
<TITLE>Statistics List</TITLE>
<meta http-equiv="Content-Type" content="text/html; charset=UTF-8">
<LINK href="${pageContext.request.contextPath }/css/Style.css" type=text/css rel=stylesheet>
<LINK href="${pageContext.request.contextPath }/css/Manage.css" type=text/css
	rel=stylesheet>
<script type="text/javascript" src="${pageContext.request.contextPath }/js/jquery-1.8.3.min.js"></script>
<script type="text/javascript" src="${pageContext.request.contextPath }/js/echarts.js"></script>
	<script type="text/javascript">
		$(function(){
  			$.get('CustomerAction_chart',function(data){
  				var myChart = echarts.init(document.getElementById("chart"));
  	  			//generate chart data
	  	  		myChart.setOption({
						// title property
					    title : {
					        text: 'Customer source of this system',
					        x:'center'
					    },
					    //tip box properties
					    tooltip : {
					        trigger: 'item',
					        formatter: "{a} <br/>{b} : {c} ({d}%)"
					    },
					   	// legend properties
					    legend: {
					        orient: 'vertical',
					        left: 'left',
					        data: (function(){
					        	var res = [];
					        	for(var i=0;i<data.length;i++){
					        		res.push(data[i][0]);
					        	}
					        	return res;
					        })()
					    },
					    //data
					    series : [
					        {
					            name: 'Customer source',
					            type: 'pie',
					            radius : '55%',
					            center: ['50%', '60%'],
					            data:function(){
					            	var res = [];
					            	for(var i=0;i<data.length;i++){
					            		res.push({
					            			name:data[i][0],
					            			value:data[i][1]
					            		});
					            	}
					            	return res;
					            }()

					        }
					    ],itemStyle: {
  	  		                emphasis: {
  	  		                    shadowBlur: 10,
  	  		                    shadowOffsetX: 0,
  	  		                    shadowColor: 'rgba(0, 0, 0, 0.5)'
  	  		                }
  	  		            }
					});

	  			});


  		});
	</script>


<META content="MSHTML 6.00.2900.3492" name=GENERATOR>
</HEAD>
<BODY>
	<div id="chart" style="width:600px;height: 400px;background: wihte"></div>
</BODY>
</HTML>