Source: Journal of Electronics and Information Technology
Authors: Sun Lei, Yang Yu, Mao Xiuqing, Wang Xiaoqin, Li Jiaxin
Summary
The traditional Generative Adversarial Network (GAN) ignores the representation and structural information of the original features when the feature map is large, and the pixels of the generated image lack long-range correlation, resulting in low quality generated images. In order to further improve the quality of generated images, this paper proposes a spatial feature-based generative adversarial network data generation method (SF-GAN). This method first adds the spatial pyramid network to the generator and the discriminator to better capture important description information such as the edge of the image; then the generator and the discriminator are enhanced to model the long-distance correlation between pixels . Using small-scale data sets such as CelebA, SVHN, and CIFAR-10 to conduct experiments, it is proved that the proposed method is compared with the gradient penalty generation confrontation network (WGAN) through qualitative and quantitative evaluation of Inception score (IS) and Freche distance (FID). -GP), Self-Attention Generative Adversarial Network (SAGAN) can make the generated images have higher quality. And it is proved by experiments that the data generated by this method can further improve the training effect of the classification model.
Key words
Generative Adversarial Network / Spatial Pyramid Network / Feature Enhancement / Feature Map
1 Introduction
With the continuous development of artificial intelligence technology, more and more downstream tasks have emerged, such as classification [1], face recognition [2], target detection [3,4], etc., and most of these tasks rely on a large amount of data. Including image, voice, text and other data. However, in the real world, it is difficult to obtain data in special fields such as medical care, security, aviation, and EEG, and the cost is extremely high. The lack of data will have a great negative impact on the training of the model. Therefore, it is necessary to generate fake data that is closer to the real data through data generation technology, so as to improve the training effect of the model. In the field of computer vision, image generation technology has always been a hot research topic. Traditional generative models include Restricted Boltzmann Machines (RBM) [5], Deep Belief Network (DBN) [6], Auto-Encoding Variational (AEV) [7], etc., such methods are computationally complex and have limited generation effects.
In 2014, Goodfellow et al. [8] proposed a generative model based on game theory, that is, Generative Adversarial Network (GAN), which uses generators and discriminators for confrontation training, and updates the weights of the network through backpropagation. It is easy to calculate and the effect is remarkable, which greatly promotes the development of the field of image generation, but the training process is extremely unstable. Convolutional Neural Network (CNN) [9] has been widely used in the field of deep learning. The classic Deep Convolution Generative Adversarial Networks (DCGAN) [10] combines the traditional GAN's multi-layer perceptron Replacing it with CNN, introducing CNN into the generator and discriminator, this model further improves the learning ability of GAN and improves the quality of generated images, but there is a phenomenon that the training is unstable and prone to mode collapse. The Wasserstein Generative Adversarial Network (WGAN) proposed by Arjovsky et al. [11] in 2017 replaces the Jensen-Shannon divergence (JS) [12] distance with the Wasserstein distance, which can A better measure of the divergence between the two distributions alleviates the problem of GAN training instability to a certain extent, but this algorithm does not really limit the discriminator to the 1-Lipschitz function (1-Lipschitz function )[13] does not strictly give the calculation method of Wasserstein distance. The gradient penalty generation confrontation network proposed by Gulrajani et al. [14] (improved training of Wasserstein GANs, WGAN-GP) belongs to the enhanced version of WGAN. It uses the gradient penalty to realize the approximate 1-Lipschitz function restriction on the discriminator, which makes the GAN training more stable, converges faster, and can generate higher quality samples, but it Only the x of the area where the modulus of the gradient is greater than 1 is penalized, and it does not fundamentally solve the problem of the 1-Lipschitz function limitation of the discriminator. Zhang et al. [15] proposed a self-attention generation confrontation network (Self-Attention GAN, SAGAN) that combines the attention mechanism with GAN. This improved model can handle long-range and multi-level dependencies well, and generate finer , more coordinated images, but still has the problem of weak ability to model long-distance correlation between pixels. Literature [16] proposes a spatial pyramid attention network to explore the role of attention modules in image recognition, which enhances the performance of the basic network by adding spatial pyramid modules horizontally. Ding Bin et al. [17] proposed a sea clutter data enhancement method based on deep generative adversarial networks, by improving the traditional GAN framework to train the generator and discriminator. Cao Zhiyi et al. [18] proposed an improved GAN model for face restoration algorithm, but the disadvantage is that it needs to be based on a large number of training samples.
Although various GAN models have been derived today, there are still problems such as unclear and low-quality images generated. Moreover, some GAN models mostly need to be based on a large number of training samples, and in some special fields, the acquisition of data sets is relatively confidential and difficult, so how to generate higher-quality images on the basis of small samples is the research focus of this paper. The main contributions of this paper are:
-
(1) A spatial feature-based generative adversarial network data generation method is proposed, which generates image data on the basis of small samples, and does not introduce large time overhead while generating higher-quality images.
-
(2) Introduce the gradient penalty loss function into confrontation training, which makes the training process more stable and converges faster.
-
(3) A large number of comparative experiments were carried out on CelebA, SVHN and CIFAR-10 data sets, and the classical Inception Score (Inception Score, IS) and Frechet Inception Distance (Frechet Inception Distance, FID) quantitative evaluation were used to verify the proposed the effectiveness of the method. And a classification experiment was designed to further verify that the image data generated in this paper can improve the training effect of the existing deep model.
2. Related work
2.1 Generating Adversarial Networks
GAN is composed of a generator and a discriminator. The generator tries to capture the real distribution in the learning data set. The discriminator improves the ability to distinguish the authenticity of images in the continuous confrontation with the generator. The two are a process of continuous game confrontation. The schematic diagram of GAN is shown in Figure 1.
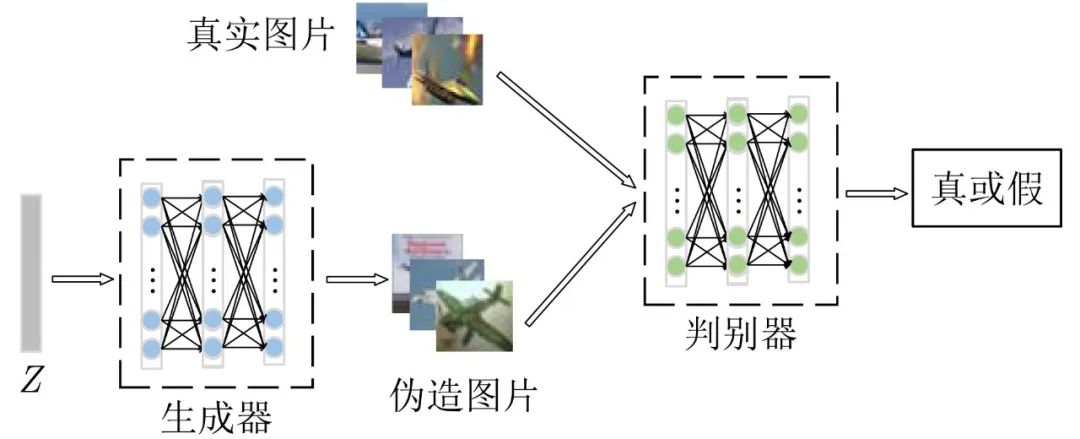
Figure 1 Schematic diagram of GAN structure
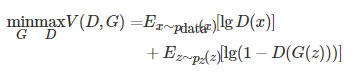
Figure 1 is a schematic diagram of the basic structure of GAN, where the generator is marked as G, and the discriminator is marked as D. The input of G is the random variable Z from the latent space, and the generated samples are output. The training goal is to improve the relationship between the generated samples and the real samples. The similarity makes it impossible to be discriminated by D. The input of D is real samples and generated samples, and the final output of the discriminant result is true or false, and its training goal is to distinguish real samples from generated samples. The objective function of the original GAN is
(1)
Among them, pdata(x) represents the distribution of real samples, pz(z) represents the distribution of generated samples, and D(x) is the probability of real images, which is a real number from 0 to 1. The training goal is to minimize the distance between pz(z) and pdata(x), and maximize the accuracy of D discriminant samples. It can be seen from formula (1) that in the process of training the discriminator, it is expected to maximize the objective function so that the probability of D(x) output approaches 1, and the output probability value of D(G(z)) approaches 0; when the generator During training, it is expected to minimize the objective function, that is, the output probability of D(G(z)) approaches 1, so that the image generated by the generator cannot be judged as true or false by the discriminator. When the confrontation training is carried out to the end, ideally, the output probability value of the discriminator for the generated image and the real image is close to 0.5. At this time, the discriminator will not be able to judge the authenticity of the image generated by the generator, and the generator will be able to do a good job. Fit the true distribution of the dataset to generate images that look like real ones.
2.2 Deep Convolutional Generative Adversarial Networks
DCGAN introduces CNN into the generator and discriminator. With the help of CNN's stronger fitting and expressive capabilities, it greatly improves the ability to generate images. Its idea mainly uses the basic theory of the original GAN model. Compared with the original GAN, the improvement of DCGAN includes the following aspects:
-
(1) All pooling layers are canceled, and transposed convolution [19] is used in the generator for upsampling;
-
(2) In addition to the output layer of the generator and the input layer of the discriminator, batch normalization (Batch Normalization, BN) [20] is used on other layers of the network;
-
(3) Except for the last layer in the generator, the Rectified Linear Unit (ReLU) [21] is used as the activation function, and the last layer uses the hyperbolic tangent (Tanh) [22] activation function; the discriminant In addition to the last layer, Leaky ReLU [23] is used as the activation function, and the last layer uses the Sigmoid activation function.
DCGAN is widely used in image generation. It greatly improves the training stability of GAN and the quality of generated results, but it only improves the structure of GAN and does not fundamentally solve the problem of GAN training stability. It is still necessary to balance the training times of the generator and the discriminator during the training process.
Figure 2 is a schematic diagram of the DCGAN generator. The generator receives a 100×1 noise vector represented by Z, and through a series of transposed convolution operations, the noise is finally mapped to a 64×64×3 image.

Figure 2 Schematic diagram of DCGAN generator structure
3. Generative Adversarial Network Based on Spatial Features
The SF-GAN proposed in this paper enables the network to quickly locate the key generation area of the image during the training process, suppress the interference of noise on the model training, improve the training efficiency of the network model, enhance the performance of the network model, and then use the gradient penalty loss function to stabilize The training process improves the clarity and fineness of the generated images. Figure 3 is the model frame diagram of SF-GAN.
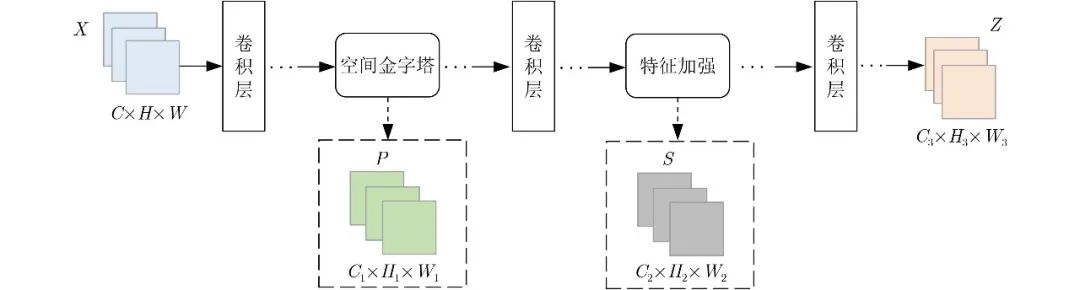
Figure 3 Model framework of SF-GAN
As shown in Figure 3, X is the initial feature map, X∈RC×H×W, Z is the output feature map,
, where P represents the output feature map of the spatial pyramid, and S represents the output feature map after feature enhancement. In Figure 3, the activation function, normalization layer, and other layers are all replaced by ellipsis. After a series of convolution, normalization and other operations on the initial feature map, the feature map P is obtained through the spatial pyramid module, and P is then subjected to a series of convolution and other operations, and then the features are enhanced to obtain the feature map S, and finally the feature The enhanced feature map S continues to perform convolution and other operations to output the final result Z.
Add two modules in the generator and the discriminator, starting from simple feature dependencies, and gradually learn complex dependencies. Figure 4 shows the network training flow chart of SF-GAN. SM represents the spatial pyramid module, and FM represents the feature enhancement module. Through the training of the generator and the discriminator, the parameters are updated by backpropagation, and the generator generates more and more The more realistic the image.

Figure 4 SF-GAN network training flow chart
3.1 Space Pyramid
The existing channel attention network only considers the dependence of the channel and ignores the structural information. The structural information reflects the overall frame of the image, including important description information such as the edge of the image. In order to enhance the feature expression ability of CNN, the traditional deep residual network (deep Residual learning for image recognition, ResNet) [24] introduces more parameters and greater time overhead. Add the pyramid network to the generator and discriminator to achieve better performance with fewer network layers. FIG. 5 is a schematic diagram of a space pyramid structure.

Figure 5 Space Pyramid Structure
Attention-based CNNs apply global average pooling to each feature map. Global average pooling behaves like a structural regularizer and prevents overfitting. However, applying global average pooling to each feature map overemphasizes the effect of regularization and ignores the representation and structural information of the original features, especially when the feature maps are large. For example, aggregating a 112 × 112 feature map to an average would result in severe loss of feature representation ability, thus affecting feature learning. The spatial pyramid structure includes 3 different sizes of adaptive average pooling, which integrates structural regularization and structural information into the attention path, and a multi-layer perceptron learns weighted feature maps from the output of the spatial pyramid structure.
Adaptively and averagely map the input features to 3 scales: 4×4, 2×2 and 1×1. 4×4 average pooling is to obtain more feature representation and structural information; 1×1 average pooling is the traditional global average pooling with strong structural regularization; the 2×2 average pooling objective is a trade-off between structural information and structural regularization. Reshape these 3 outputs into 3 1D vectors and combine them together by concatenation to generate 1D feature vectors. The spatial pyramid structure can not only preserve the feature representation, but also inherit the advantages of global average pooling.
Assuming that CNN contains L layers, xl represents the output of the l∈[1,L] layer, P(⋅,⋅) represents adaptive average pooling, Ffc(⋅) represents the fully connected layer, C(⋅) represents the connection operation, σ(⋅) represents the sigmoid activation function, R(⋅) represents the Resize function, xl∈RC×W×H is the intermediate feature map, then the output formula of the spatial pyramid structure is

(2)
Then after passing through a multi-layer perceptron, the output is

(3)
The 1D attention map V extracted from the spatial pyramid structure is concatenated from the outputs of 3 pooling layers, however, it cannot be used to learn channel dependencies, and its non-linear expression affects the effectiveness of the attention mechanism. To address this, an excitation block is used to nonlinearly model V and generate a 1D attention map, and then a sigmoid activation function is used to normalize the output to the (0,1) range. The formula is

(4)
in,
, W1 and W2 are the weight matrices of the two fully connected layers.
3.2 Feature Enhancement
Due to the limitation of the size of the convolution kernel, the generator of GAN can only capture the relationship of local regions. Aiming at the problem that the geometric features of the image generated by the original GAN are not obvious and the details of the local area are not rich, feature enhancement is applied to both the generator and the discriminator to strengthen the overall geometric features of the generated image and strengthen the relationship between domain features and long-distance features. Spend.
Transform the image features of the previous hidden layer x∈RC×N into two feature space functions f,g, where C is the number of channels and N is the width times the height. f(x) , g(x) , h(x) are all 1×1 convolutions, usually a convolution process includes an activation function, so more nonlinearity is introduced without changing the size of the input, The expressive power of the neural network is enhanced.

, is the learned weight matrix
(5)
As shown in formula (5), the output of f(xi) is transposed and multiplied by the output of g(xj), and then normalized by softmax to obtain a feature map. As shown in formula (6)

(6)
Among them, βj,i represents the degree of influence of the model on the i-th position when synthesizing the j-th region, which essentially quantifies the importance of pixel j relative to i in the image. Multiply the obtained feature map with h(xi) pixel by pixel to obtain the feature map oj with enhanced features, where xi is the i-th extracted image feature map. As shown in formula (7)

(7)
In addition, the output o is further multiplied by the scale parameter γ and added back to the input feature map x, and the final output is given by Equation (8)
(8)
In order to take into account the correlation between domain information and long-distance features, a transition parameter γ is introduced, with an initial value of 0, so that the model gradually assigns weights to other long-distance feature details from domain informatics, thereby achieving feature enhancement.
4. Experimental process and analysis
4.1 Experimental Environment and Dataset
In order to verify the effectiveness of the method in this paper, experiments are carried out on CelebA, SVHN and CIFAR-10 datasets, the operating environment is the PyTorch open source framework, the operating system is Windows 10 64-bit, and the processor is Intel(R) Core(TM) i7-10700K [email protected] GHz, the graphics card model is NVIDIA GeForce RTX 2080 SUPER, and the video memory is 8 GB. The CelebA dataset was collected and published by Liu et al. [25] of the Chinese University of Hong Kong. The dataset contains 202,599 face images of 10,177 public members. The size of each image is 178×218, and the face image Contains multiple perspectives and backgrounds, and the data set marks the gender, expression, hair color and other characteristics of the face; the Street View House Number (SVHN) data set comes from Google's real-world street view house number There are a total of 100,000 32×32 color images, including 10 categories from 0 to 9, including 73,257 training set samples and 26,032 training set samples; the CIFAR-10 data set was collected and organized by Krizhevsky[26]. The data set contains color images of 10 categories such as cars, frogs, horses, and boats. The training set consists of 5,000 images for each category, with a total of 50,000 images. The test set has 1,000 images for each category, with a total of 10,000 images. Both are 32 pixels by 32 pixels.
4.2 Evaluation indicators
IS is an initial score algorithm for evaluating the semantics of generated images proposed by Salimans et al. [27]. It originated from Google's Inception Nets. This image evaluation index can measure the clarity of a single generated image and the diversity of generated images. When Inception Score evaluates the sharpness of the generated image, it inputs the generated image sample x into Inception Nets and outputs a 1000-dimensional y vector. Each dimension in the y vector represents the probability that the input image sample x belongs to a certain category. If the input If the image sample x has a high resolution, then the input image sample x has a high probability of belonging to a certain category, and the probability of belonging to other categories will be very low. The higher the IS value, the higher the clarity and richness of the generated image samples of the GAN, and the higher the quality of the generated image samples.
FID [28] is a measure of the distance between the feature vectors of real images and generated images. The feature vector here is obtained by Inception v3 Network. The last two layers of the network structure are fully connected layers to obtain 1×1×1000 classification vectors. FID uses the output of the penultimate second fully connected layer 1×1× A 2048-dimensional image feature vector is used for distance metrics. It can better capture the similarity between the generated image and the real image, which meets the human discrimination criterion, and a lower FID value means that the generated image has better image quality and diversity.
4.3 Experimental design
In order to verify the effectiveness of the method proposed in this paper, experimental comparisons are carried out on the CelebA, CIFAR-10, and SVHN data sets. For the CelebA data set, the size of the generated picture is 64×64; for the CIFAR-10 and SVHNN data sets, the size of the generated picture is 32×32, and 500 images are randomly selected from each category of the original data set, and the total is 5000 images, because it is unsupervised generation, so put 500 images of each class into the model for generation. The types and quantities of data sets for all comparison models are the same, the batch size is set to 64, and the total steps of the generator iterations are each set to 200,000 times. During the training process, the generated samples and pre-trained samples are saved every 100 iterations. Weights. In this experiment, the Adam[29] optimizer is used, where β1=0.0, β2=0.9, the learning rate decay is set to 0.95, and the two-time-scale update rule (Two Time-scale Update Rule, TTUR) is used. The learning rate of the generator Set to 0.0001, and the learning rate of the discriminator is set to 0.0004, so that the generator and the discriminator have different learning rates, the generator uses a smaller update range to deceive the discriminator, and will not choose fast, imprecise And unrealistic ways to win the game. The learning rate decay is set to 0.95. The adversarial training loss function uses a gradient penalty function. This loss function can stabilize the training of GAN and make it easier to converge. During training, the discriminator is trained 5 times and the generator is trained once, where the gradient penalty coefficient λ=10.
In order to further verify that the image data generated in this paper can improve the training effect of the existing deep model, classification experiments are used for verification. In the small-scale data set classification experiment, in order to exclude the influence of classifier performance and only consider the effect of generated data, a classification network is designed based on the classic LeNet. For the SVHN and CIFAR-10 datasets, 500 images are randomly sampled from each category, for a total of 5000 images in 10 categories. The training set of each class before expansion: test set = 350:150, the total training set before expansion is 3500, and the total test set is 1500. The training set of each class that was originally classified is expanded by 10 times to 3500, the total training set is 35000, and the total test set is still 1500. Comparing the accuracy rate on the test set before and after data augmentation using real pictures and different GAN methods, the higher the accuracy rate, the better the quality of the generated image, which can effectively improve the performance of the classification model.
4.4 Analysis of experimental results
The baseline model selected in this paper is DCGAN. In order to verify the effectiveness of MA-GAN data enhancement, it is qualitatively and quantitatively compared with WGAN-GP and SAGAN, which also uses the attention mechanism. The common feature of these models is that they are based on DCGAN is a baseline method with a simple structure, relatively few parameters, and only occupies a small GPU memory, which can better verify the effectiveness of the proposed method.
4.4.1 Experimental results of CelebA
As shown in Figure 6, the image effect generated when each model iterates 200 times, for the CelebA dataset, when the generator iterates 200 times, WGAN-GP, SAGAN and SF-GAN all roughly have the outline of the face, but In WGAN-GP and SAGAN, there are more black plaques and appear irregular. Compared with SF-GAN, the artifacts are in a regular state.
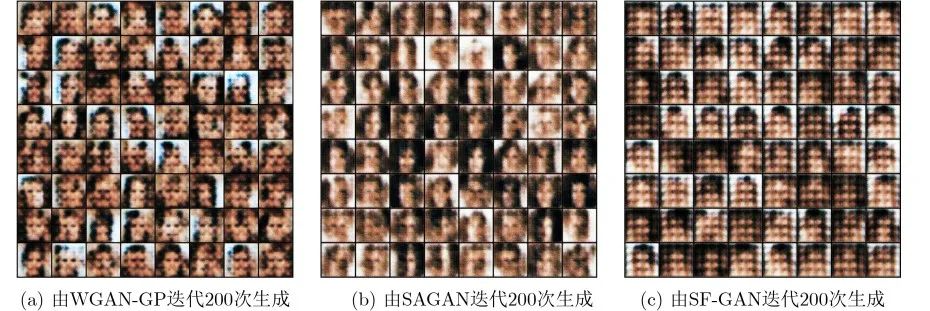
Figure 6 Comparison of samples generated by different models
It can be seen from Figure 7 that the image generated by WGAN-GP has the phenomenon of face pattern collapse (as shown in the red box in Figure 7(a)), and the face image generated by SAGAN has more abnormal structural images (Figure 7 (b) shown in the red box), the reason is that although SAGAN captures the pixel correlation on a single feature map through the self-attention mechanism, it cannot capture the connection between each feature channel, so it fails to capture the image. Geometric features and structures. Compared with SAGAN, SF-GAN and WGAN-GP generate smoother and more natural pictures, and the facial organs are more coordinated.
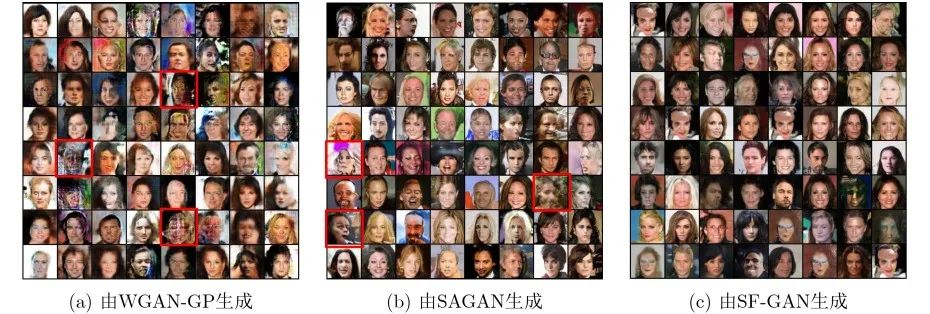
Figure 7. Generation effects of different models on the CelebA dataset
The "↑" symbol of the index IS in Table 1 indicates that the larger the IS, the better the model effect, and the "↓" symbol of the index FID indicates that the smaller the FID, the better the model effect. It can be seen from Table 1 that compared with SAGAN, the IS score of SF-GAN increased by 10.28%, and the FID decreased by 1.18%. Compared with WGAN-GP, the IS score increased by 12.75%, and the FID decreased by 14.93%. It shows the effectiveness of the proposed method and its excellent performance on image generation.

Table 1 Comparison results of different models on the CelebA dataset
4.4.2 SVHN experimental results
Figure 8 shows the generation effects of different models on class "8". Both WGAN-GP and SAGAN cannot generate image samples normally (as indicated by the red boxes in Figure 8(a) and Figure 8(b). Shown) The numbers generated by SF-GAN are clearer, the edges are cleaner, the colors are brighter, and the details are more natural.

Figure 8. Generation effects of different models on the number 8
It can be seen from Table 2 that among the 10 classes of numbers 0 to 9, the IS scores of each class of the image generated by SF-GAN are the highest. In class "5", SF-GAN increased the IS scores of WGAN-GP and SAGAN models by 11.81% and 12.43% respectively; in class "7", SF-GAN improved the IS scores of WGAN-GP models by 20.35%, an increase of 13.95% compared to SAGAN.

Table 2 IS comparison results of different models on the SVHN dataset
It can be seen from Table 3 that among the 10 categories of numbers 0 to 9, the FID scores of each category of the image generated by SF-GAN are the lowest, which means that the performance of the model is the best. Among them, in class "8", SF-GAN compared to WGAN-GP, SAGAN model FID scores decreased by 27.63%, 27.511% respectively; in class "9", SF-GAN compared to WGAN-GP, SAGAN model FID scores Respectively reduced by 35.55%, 23.10%.

Table 3. FID comparison results of different models on the SVHN dataset
4.4.3 CIFAR-10 Experimental Results
As shown in Figure 9, the generation effect of different models on CIFAR-10 is shown. From Figure 9(a), it can be seen that the image effect generated by WGAN-GP is relatively chaotic, and the discrimination between objects and backgrounds is low; from Figure 9(b), it can be seen that SAGAN The visual effect of the color of the generated image is better than that of WGAN-GP, and has a better level of light and shade, but it is still lacking in the characteristics of the object; Figure 9(c) is the generated image of SF-GAN, compared with other models , the generated image has better color expressiveness, better feature discrimination of objects, more natural transition between image subject and background, and more details, which further shows that SF-GAN has a strong ability to extract deep features and generate The image quality is also better.

Fig. 9 Generation effect of different models on CIFAR-10
It can be seen from Table 4 that the IS of SF-GAN is the highest among the 10 classes of CIFAR-10. Among them, in the class "aircraft", SF-GAN compared with WGAN-GP, the SAGAN model IS scores increased by 9.42%, 8.89% respectively; in the class "dog", SF-GAN compared with WGAN-GP, SAGAN model IS scores They increased by 24.51% and 18.54% respectively.
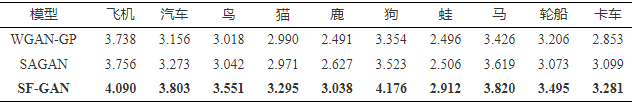
Table 4 IS comparison results of different models on the CIFAR-10 dataset
It can be seen from Table 5 that in the 9 classes of "aircraft", "bird", "cat", "deer", "dog", "frog", "horse", "ship", and "truck", SF-GAN Compared with other comparison models, the FID is the lowest. In the class "Car", the FID of the SF-GAN model is lower than that of SAGAN and higher than that of WGAN-GP. Among them, in the class "bird", SF-GAN compared to WGAN-GP, SAGAN model FID scores decreased by 21.92%, 17.63% respectively; in the class "ship", SF-GAN compared to WGAN-GP, SAGAN model FID scores Respectively reduced by 9.33%, 23.29%.

Table 5. FID comparison results of different models on the CIFAR-10 dataset
4.4.4 Classification recognition performance analysis
It can be seen from Figure 10 that when 2000 iteration steps are performed, in addition to the real picture enhancement, the loss of the training set after the enhancement of the three different GAN methods approaches 0. After the real picture is enhanced, the training loss is not as fast as the loss of the GAN data enhancement method.
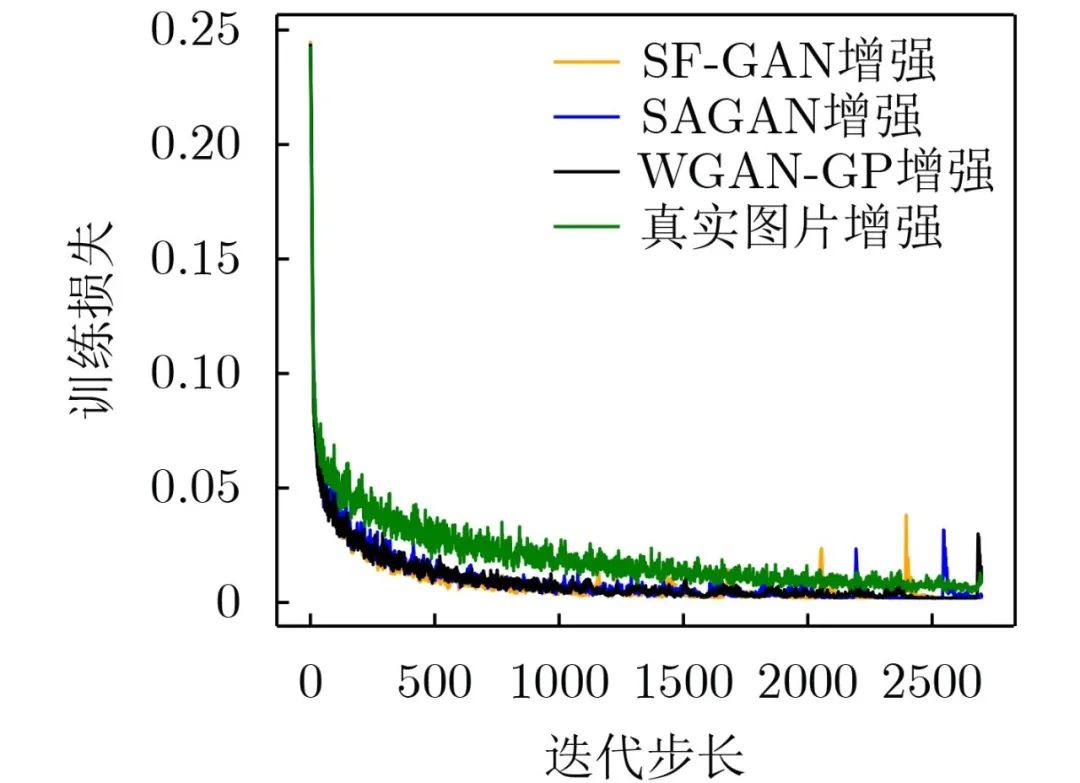
Figure 10 Changes in training set loss after SVHN enhancement
It can be seen from Figure 11(a) that for the classification accuracy of each class in the training set, the classification accuracy of each class fluctuates the most after WGAN-GP enhancement, followed by real image enhancement; using SF-GAN The enhanced classification accuracy is comparable for each class. It can be seen from Figure 11(b) that for the classification accuracy of each class in the test set, the fluctuation of the classification accuracy of each class after SF-GAN enhancement is the smallest and the accuracy is also higher.
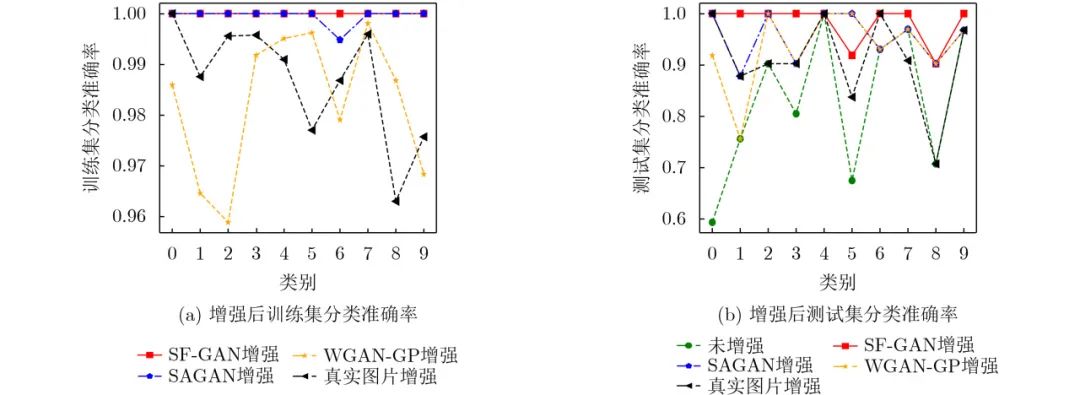
Figure 11 SVHN enhanced training set and test set classification accuracy
It can be seen from Figure 12 that the loss of SF-GAN enhancement and MA-GAN enhancement decreases the fastest and when the iteration step size is 2500 times, the training loss after the enhancement of the two methods approaches 0, indicating that the training process is more stable and converges faster .
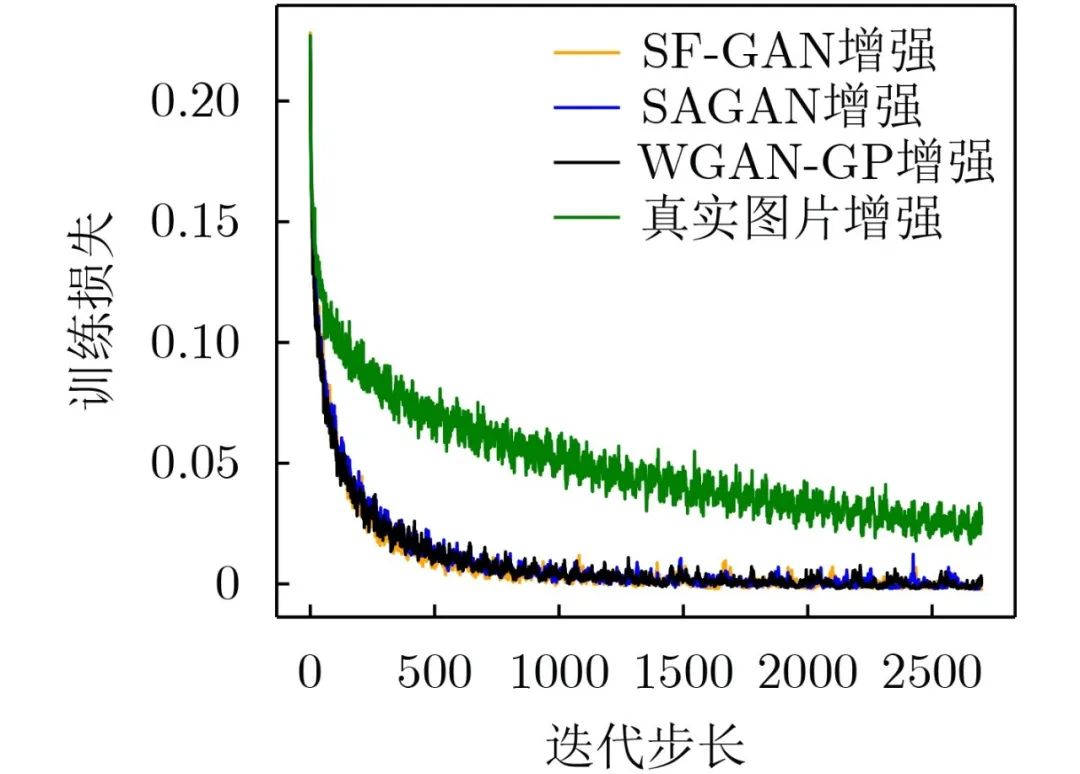
Figure 12 Changes in training set loss after CIFAR-10 enhancement
It can be seen from Figure 13(a) that for the classification accuracy of each class in the training set, using real image enhancement has larger fluctuations than other methods, WGAN-GP enhancement has larger fluctuations than other GAN methods, and SF-GAN The fluctuation after enhancement is the smallest; as can be seen from Figure 13(b), for the classification accuracy of each class in the test set, the classification accuracy of each class after SF-GAN enhancement is higher and the fluctuation is smaller.

Figure 13 CIFAR-10 enhanced training set and test set classification accuracy
It can be seen from Table 6 that after SF-GAN is enhanced, the average accuracy rate on the test set is the highest, which is 12.16% higher than the unenhanced accuracy rate, and 6.41% higher than the WGAN-GP method enhanced accuracy rate.
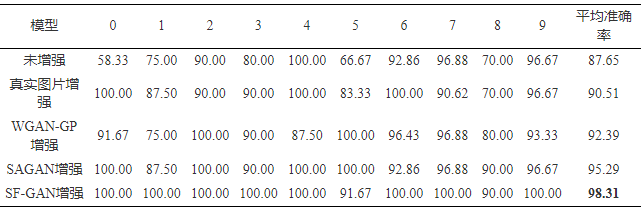
Table 6. Classification accuracy (%) of SVHN test set enhanced by different methods
It can be seen from Table 7 that compared with real pictures, SF-GAN, SAGAN, and WGAN-GP have the highest average accuracy rate after enhancement, which is 64.53% higher than that without enhancement. Compared with WGAN-GP method after enhancement The accuracy rate increased by 12.31%. The proposed method improves the quality and fidelity of the generated image to a certain extent and speeds up the network convergence speed. The accuracy of the classifier is better than other comparison methods, which proves that the image data generated in this paper can further improve the performance of the deep model.

Table 7. Classification accuracy (%) of CIFAR-10 test set enhanced by different methods
5. Conclusion
Aiming at the problem that GAN ignores the representation and structural information of the original features when the feature map is large, resulting in low quality of the generated image, this paper proposes a spatial feature-based generative confrontation network data generation method (SF-GAN). The proposed method has good generation effect on CelebA, SVHN, CIFAR-10 and other data sets. It is verified that the performance of SF-GAN is better than WGAN-GP, SAGAN and other classic methods in the standard IS and FID metrics, and through classification The experiment further verifies that the image data generated in this paper can improve the training effect of the existing deep model. It shows that the method proposed in this paper can obtain the feature information in the image more comprehensively than other methods, and the generated image structure distribution is also closer to the real distribution. . In future work, efforts will be made to generate higher resolution images with fewer datasets.
Disclaimer: The articles and pictures reproduced on the official account are for non-commercial educational and scientific research purposes for your reference and discussion, and do not mean to support their views or confirm the authenticity of their content. The copyright belongs to the original author. If the reprinted manuscript involves copyright and other issues, please contact us immediately to delete it.
"Artificial Intelligence Technology and Consulting" released