Commonly used commands for monitoring performance in Linux are:
sar : You can view the average information of the CPU, and you can also view the information of the specified CPU. Compared with mpstat, sar can view CPU history information
mpstat : You can view the average information of all CPUs, and you can also view the information of a specified CPU. Compared with sar, mpstat monitors the real-time status of CPU performance
vmstat : Monitor the overall CPU, memory, and IO usage of the server, instead of just seeing the CPU usage and memory usage of each process (the usage scenarios are different)
iostat : Mainly used to monitor the io load of system equipment
1、sar
sar (System Activity Reporter system activity report) is one of the most comprehensive system performance analysis tools on Linux at present. It can report system activities from many aspects, including: file read and write, system call usage, disk I /O, CPU efficiency, memory usage, process activity and IPC-related activities, etc., the sar command is installed by the sysstat installation package.
The details of the parameters used by the sar command can be viewed using sar --help
Common parameters
-o : Save the monitored information to a file in binary form
-f : read the report from the specified file
-P: report the status of each CPU
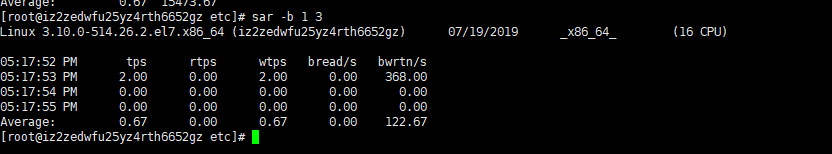
-b: Display statistics for I/O and transfer rates
-R:: show memory status
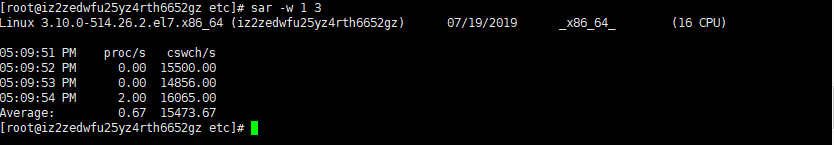
-w:: show swap partition status
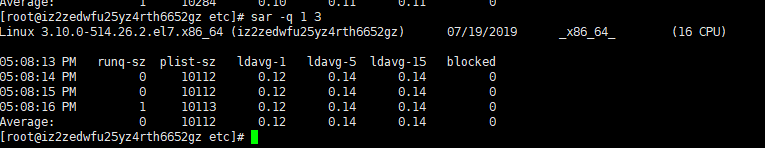
-q: view the average load
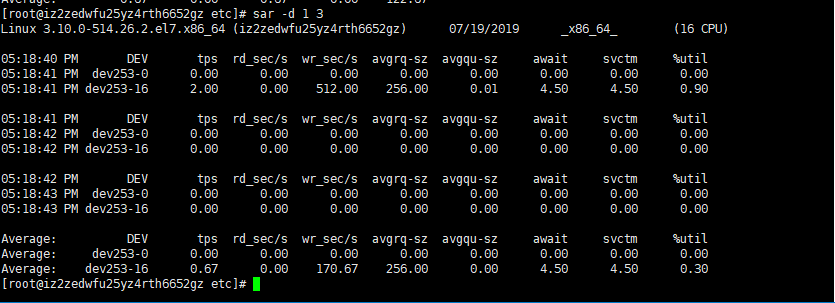
-d: disk usage statistics
sar //No parameter interface situation
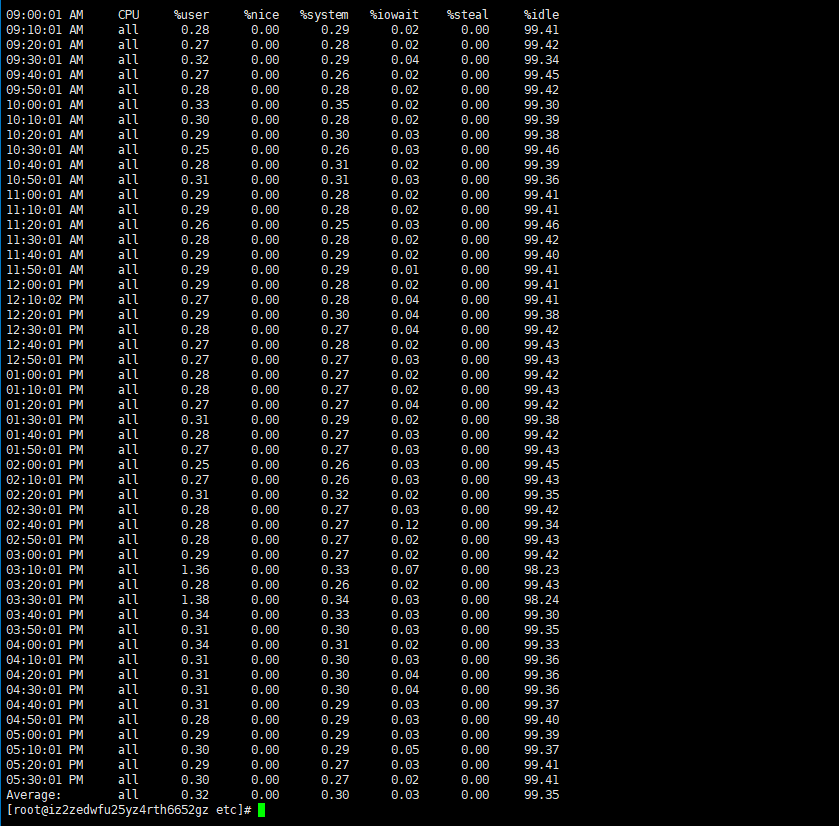
The meaning of the fields
%user In the internal time period, the CPU time (%) of the user state, excluding the process with a negative nice value (usr/total)*100 %nice
In the internal time period, the CPU time (%) of the process with a negative nice value (nice/total)*100
%system In the internal time period, the kernel time (%) (system/total)*100
%iowait In the internal time period, the hard disk IO waiting time (%) (iowait/total)*100
%steal
%idle In the internal time period, the CPU is idle for any reason except waiting for disk IO operations Idle time (%) (idle/total)*100
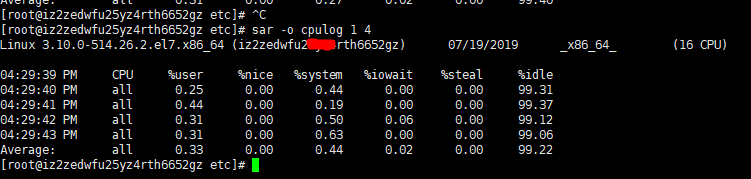
sar -o cpulog 1 4 //Sampling CPU information every 1 second, 4 consecutive times, and storing the sampled information in the file cpulog in the current directory in binary form, if you delete 4, the following command will always be 1 Sample once per second
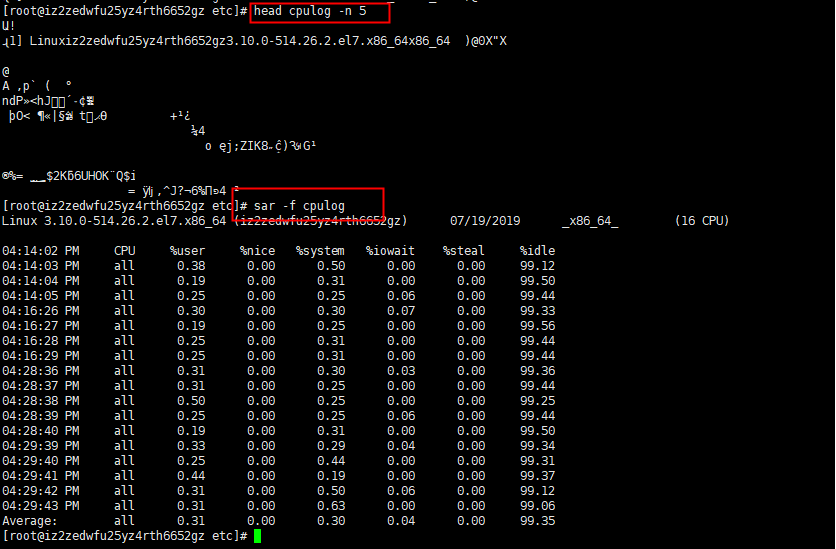
sar -f cpulog //Use the above command to save the file, use cat, head and other commands to view the file is full of garbled characters, you need to use sar -f {filename} to view
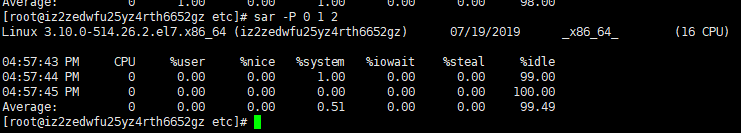
View all CPU information 0 indicates the CPU core number, if it is ALL, returns the information of all core numbers 1 indicates the refresh frequency 2 indicates the number of refreshes # sar -P 0 1 2
sar -q View the length of the queue (the number of processes waiting to run) and the status of the load
sar -r to view memory usage

sar -w View the statistics of the system swap partition
sar -b view I/O transfer rate information
sar -d disk usage statistics
2、mpstat
mpstat is the abbreviation of Multiprocessor Statistics. It is a real-time monitoring tool that reports some statistical information of the cpu. These information are stored in the /proc/stat file. In a multi-CPU system, it can not only view the average status information of all CPUs, but also It is possible to view specific cpu information. The biggest feature of mpstat is: you can view the statistics of each computing core in the multi-core cpu
# mpstat 1 5 //Sampling CPU information 5 times in a row, each time at 1 second interval
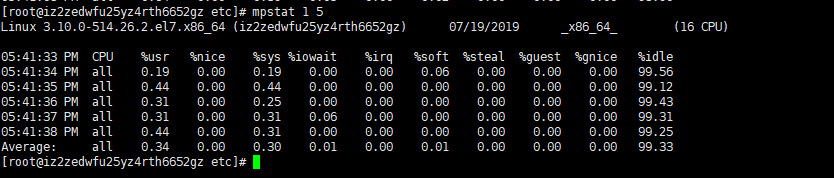
The meaning of the fields
%user In the internal time period, the CPU time (%) of the user state, excluding the process with a negative nice value (usr/total)*100 %nice
In the internal time period, the CPU time (%) of the process with a negative nice value (nice/total)*100
%sys In the internal time period, the kernel time (%) (system/total)*100
%iowait In the internal time period, the hard disk IO waiting time (%) (iowait/total)*100
% irq In the internal time period, hard interrupt time (%) (irq/total)*100
%soft In the internal time period, soft interrupt time (%) (softirq/total)*100
%idle In the internal time period, CPU Idle time for any reason other than waiting for disk IO operations Idle time (%) (idle/total)*100
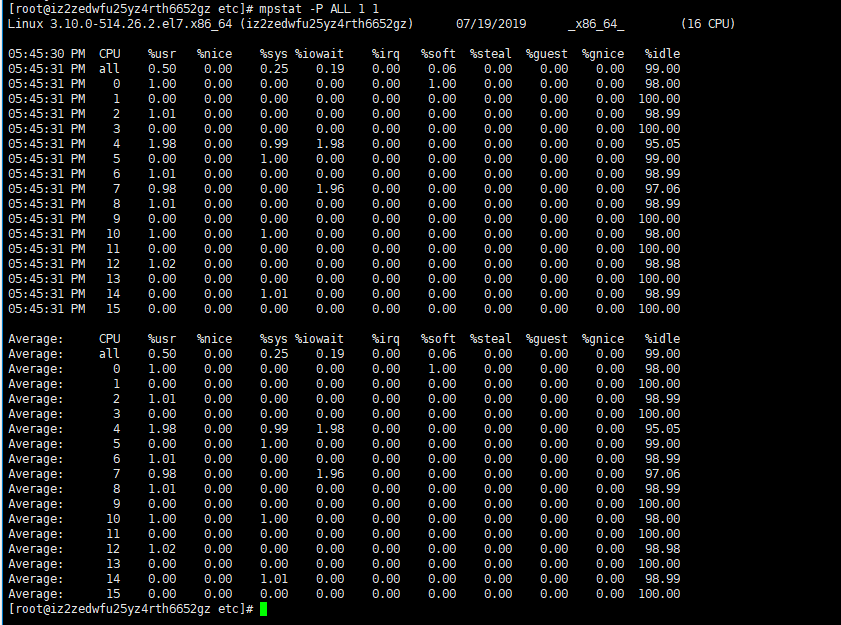
# View all CPU individual information
mpstat -P ALL 1 1
3、vmstat
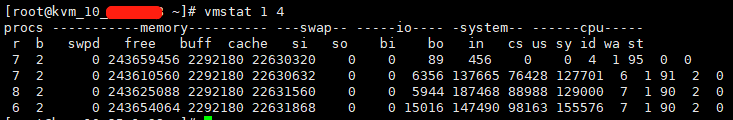
vmstat can display the status value of the server at a specified time interval, including the server's CPU usage, memory usage, virtual memory swap, IO read and write status.
#Consecutive 4 times, each interval of 1 second sampling information
vmstat 1 4
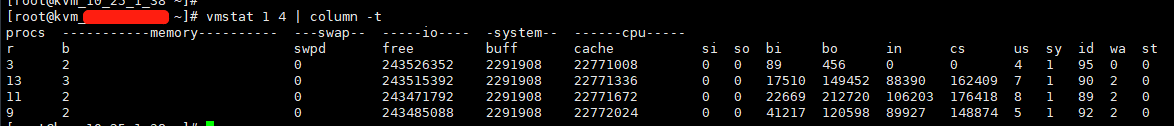
If you think it is too messy, use the following command
vmstat 1 4 | column -t
1. Procs (process)
r: Indicates the run queue (that is, how many processes are actually allocated to the CPU).
- If the number of CPUs is greater than or exceeded for a long time, there are many processes waiting for the CPU, and the CPU needs to be increased;
- If it is greater than 4 times the number of available CPUs in the system, the system will face a shortage of CPUs or a CPU speed that is too low;
- r and b cannot be higher than 5 times, if r is often greater than 4 times, and id is often less than 40, it means that the CPU load is heavy.
b: The column indicates the number of processes waiting for resources, such as waiting for I/O, or memory exchange.
2. Memory
swpd: The size of the virtual memory used (indicated by k).
- If it is greater than 0, it means that your machine has insufficient physical memory.
- If the value of swpd is not 0, or is relatively large, such as exceeding 100m, as long as the values of si and so are 0 for a long time, the system performance is still normal
free: the size of free physical memory
buff: cache for reading and writing to block devices (system cache)
Cache: generally used as a file system cache
- If the cache is large, it means that more files are used in the cache. If the bi in the IO is relatively small at this time, it means that the file system efficiency is better.
3.Swap
si: The size of the virtual memory read from the disk per second. If this value is greater than 0, it means that the physical memory is not enough or the memory is leaked. It is necessary to find the memory-consuming process and solve it.
so: the size of virtual memory written to disk per second, if this value is greater than 0, the same as above
- si and so description: When the demand for memory is greater than the amount of RAM, the server starts the virtual memory mechanism. Through virtual memory, the RAM segment can be moved to the special disk segment of SWAP DISK, so that page export and page import of virtual memory will occur. Phenomenon, the page export does not explain the RAM bottleneck. The virtual memory system often performs page export for the memory segment, but the page import operation indicates that the server needs more memory. The page import needs to copy the memory segment from the SWAP DISK back to the RAM. , causing the server to slow down. It also has to be seen with the CPU usage.
- If the memory usage is relatively high, but the CPU usage is very low, it can be considered that there are many applications that occupy the memory and have not released it.
- If this happens in ORACLE:
1. The easiest way is to increase the RAM. 2. Change the size of SGA to reduce the demand for RAM. 3. Reduce RAM requirements (e.g. reduce PGA)
4.IO (the block size of the current Linux version is 1kb)
bi: The number of blocks received by the block device per second. The block device here refers to all disks and other block devices on the system. The default block size is 1024byte
bo: The number of blocks sent by the block device per second. For example, when we read a file, bo must be greater than 0. bi and bo are generally close to 0, otherwise the IO is too frequent and needs to be adjusted.
- Here we set the reference value of bi+bo to 1000. If it exceeds 1000 and the value of wa is large, we should consider balancing the disk load, which can be analyzed in combination with iostat output.
5.system (system)
in: Indicates the number of device interrupts per second observed in a certain time interval.
The cs: column indicates the number of context switches generated per second, VMSTAT\u547d\u4ee4 If cs is much higher than disk I/O and network packet rates, it should be investigated further.
6. CPU (expressed as a percentage)
us: Shows the percentage of CPU time spent in user mode.
- When the value of us is relatively high, it means that the user process consumes more CPU time, but if it is greater than 50% for a long time, you need to consider optimizing the user program.
sy: Shows the percentage of cpu time spent by the kernel process.
- Here, the reference value of us + sy is 80%. If us+sy is greater than 80%, there may be insufficient CPU.
id: The percentage of time the CPU is idle
- CPU measurements in vmstat are percentages. When the value of us+sy is close to 100, it means that the CPU is working close to full load. But it should be noted that the full load of the CPU does not mean anything. UNIX always tries to keep the CPU as busy as possible to maximize the throughput of the task. The only thing that can determine the CPU bottleneck is the value of r (run queue).
- If the idle time (cpu id) is continuously 0 and the system time (cpu sy) is twice the user time (cpu us) the system is facing a shortage of CPU resources.
wa: Shows the percentage of CPU time occupied by IO waiting.
- The reference value of wa here is 30%. If wa exceeds 30%, it means that the IO wait is serious. This may be caused by a large number of random accesses to the disk, or it may be caused by the bandwidth bottleneck of the disk or disk access controller (mainly block operations).
st: Percentage of CPU time stolen from a virtual machine
4、iostat
iostat is mainly used to monitor the io load of system equipment. When sostat runs for the first time, it will display various statistical information since the system starts. Users can obtain the required statistical information by specifying the number and time of statistics
# iostat 1 1
# iostat -m 1 1 //-m statistics in MB
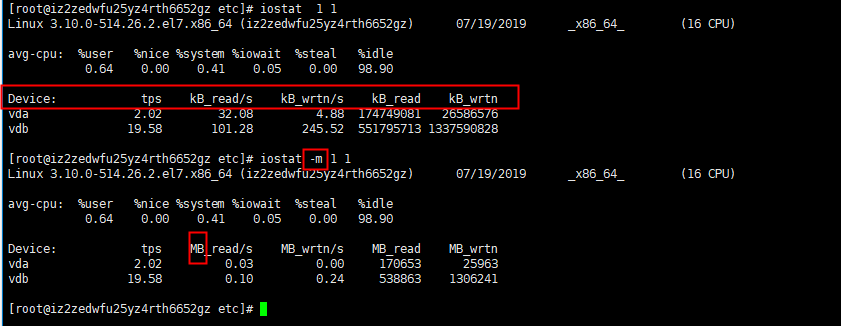
Meaning of the output information
Device: drive character
tps: The number of transfers per second of the device (Indicate the number of transfers per second that were issued to the device.). "A transfer" means "an I/O request". Multiple logical requests may be combined into "one I/O request". The size of a "one transfer" request is unknown.
kB_read/s: the amount of data read from the device (drive expressed) per second;
kB_wrtn/s: the amount of data written to the device (drive expressed) per second;
kB_read: the total amount of data read; kB_wrtn: written The total amount of data; these units are Kilobytes.
Source code and other data acquisition methods


Friends who want to get source code and other tutorial materials, please like + comment + bookmark , triple!
After three times in a row , I will send you private messages one by one in the comment area~