1. Introduction to Monitoring
1. Purpose of monitoring
Monitoring needs to be considered from the perspective of the company's business, not the use of a certain monitoring technology.
Uninterrupted real-time monitoring of the system
In fact, it is an uninterrupted real-time monitoring of the system
Real-time feedback on the current status of the system
To monitor a certain hardware or system, it is necessary to be able to see the status of the current system in real time, whether it is normal, abnormal, or faulty.
Ensure service reliability and security
The monitoring directory is to ensure the normal operation of the system, service and business
Ensure business continuity and stability
If the monitoring is done relatively well, even if a fault occurs, the fault alarm can be received at the first time, and the problem can be processed and resolved in the first time, so as to ensure the continuous operation of business documents
2. Monitoring method
Understand the monitoring object
Learn how the CPU works
Performance Benchmarks
What properties of this thing are monitored? Such as CPU price-earnings ratio, load, user state, kernel too much, context switching
Alarm Threshold Definition
How can it be regarded as a fault, such as how high is the CPU load? How much is the kernel mode and user mode running respectively?
Troubleshooting processWhat should we do if we received a fault alarm?
3. Monitoring core
problem found
When a fault alarm occurs in the system, we will receive a fault alarm message.
positioning problemFault emails generally contain the failure of a certain host and the specific failure content. We need to analyze the alarm content. Or if a certain development triggers a related policy prohibited by the firewall, etc., we need to analyze the specific cause of the failure.
Solve the problemOf course, after we understand the cause of the fault, we need to solve the fault through the priority of fault resolution.
summary questionAfter we have solved the major failure, we need to summarize the cause of the failure and its prevention to avoid recurrence in the future.
Two, zabbix overview
1. The main features of zabbix
Simple installation and configuration, low learning cost
Support multiple languages (including Chinese)
free open source
Automatically discover servers and network devices
Distributed monitoring and WEB centralized management functions
Can monitor without agent
User security authentication and soft authorization
Set or view monitoring results through the WEB interface
Email and other notification functions, etc.
2. What is Zabbix
Zabbix is an enterprise-level open source solution based on a web interface to improve distributed system monitoring and network monitoring functions
Zabbix can monitor various network parameters, ensure the safe operation of the server system, and provide a flexible notification mechanism to allow system administrators to quickly locate/solve various problems.
Zabbix consists of two parts, Zabbix server and optional Zabbix agent . Collect data through C/S mode, and then display and configure it on the web side through B/S mode.
zabbix server can improve the monitoring of remote server/network status, data collection and other functions through SNMP, Zabbix agent, ping, port monitoring and other methods, and it can run on the linux platform.
The zabbix agent needs to be installed on the monitored target server. It mainly completes the collection of hardware information or operating system-related memory, CPU and other information, as well as middleware information.
3. zabbix monitoring object
Zabbix supports monitoring various system platforms, including mainstream operating systems such as linux and windows , and can also monitor routing and switching devices with the help of SNMP or SSH protocols.
If zabbix is deployed on a server, it can monitor its CPU, memory, network and other hardware parameters, as well as specific services or applications, service operation and performance .
① Hardware monitoring (zabbix IPMI interface)
Monitoring through the IPMI interface, we can monitor the physical characteristics of the monitored object through the standard IPMI hardware interface, such as voltage, temperature, fan status, power status, etc.
② System monitoring (zabbix agent interface)
Monitoring through a dedicated agent program, and the common master/agent model type, if the monitoring object supports the corresponding agent, this method is recommended.
③ java monitoring (zabbix JMX interface)
Monitoring through JMX, JMX (java management extensions, that is, java management extensions), when monitoring JMX virtual machines, this method is a very good choice.
④ Network device monitoring (Zabbix SNMP Interface)
Communicate with the monitored object through the SNMP protocol. The full name of the SNMP protocol is simple network management protocol, which is translated into a simple network management protocol. Generally speaking, we cannot install agents on hardware such as routers and switches, but these hardware supports SNMP protocol.
⑤ Application service monitoring Zabbix Agent UserParameter
⑥ MySQL database monitoring: percona-monitoring-plulgins
⑦ URL monitoring: Zabbix Web monitoring
4. Zabbix architecture
4.1 server-client architecture
① It is the simplest structure of zabbix
② There is no processing between the monitoring machine and the monitored machine
③ Data exchange is performed directly between zabbix-server and zabbix-agent.
④ Applicable to the monitoring environment where the network is relatively simple, try to be in the local area network, and the equipment is relatively small.

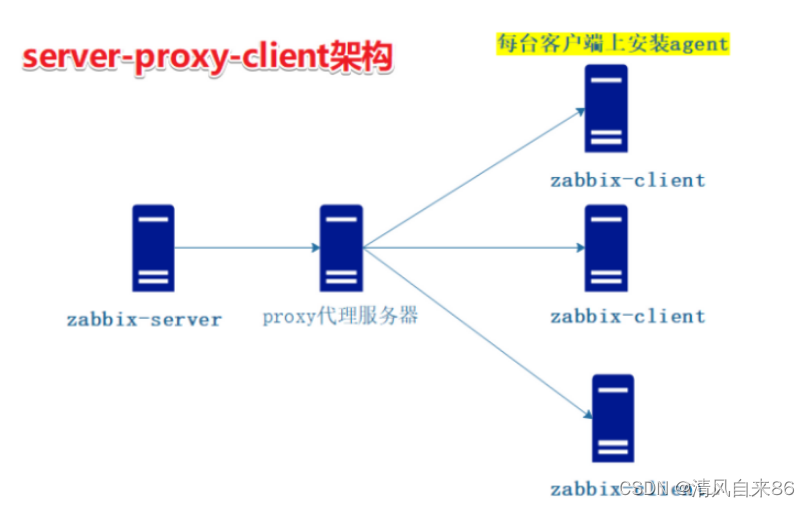
.2 server-proxy-client architecture
① Among them, proxy is a bridge for communication between server and client
② The proxy itself does not have a front end, and does not store data itself, but temporarily stores the data sent by agentd, and then hands it over to the server.
③ This architecture is often compared with the master-node-client architecture. It is generally applicable to the monitoring of medium-sized network architectures across computer rooms and networks.
4.3 master-node-client architecture
1. This architecture is the most complex monitoring architecture of zabbix, and it is used in large-scale environments with many cross-computer rooms and cross-network devices . Each one will be synchronized with the server side. It is equivalent to a server side
2. Node can be connected to proxy or directly to clinet
3. The node has its own configuration file and database. What it needs to do is to synchronize the configuration information and monitoring data to the master. The failure or loss of the master will not affect the normal work of the node node, but it will affect the integrity of the zabbix-server as a whole sex.

4.4 Monitoring content supported by zabbix
1. Hardware
Power status, cpu temperature, machine temperature, fan.
2. Software
HTTP interface, RPC interface request volume, time-consuming, abnormal volume, etc.
Number of threads on the JVM, number of dead threads, number of active threads, GC time-consuming, etc.
(GC means garbage collection. Memory handling is a place where programmers are prone to problems. Forgotten or wrong memory recovery will lead to instability or even crash of the program or system. The GC function provided by Java can automatically monitor whether the object exceeds the scope and thus To achieve the purpose of automatically reclaiming memory.)
3. Data
Database connection, QPS, TPS
Number of parallel sessions, number of caches, lock status, etc.
Active, discarded, waiting for connections, errors, etc. of Nginx
The number of threads, request volume, time-consuming, memory consumption, etc. on Tomcat
Cache, memory consumption, memory fragmentation, message queue and other data
5, zabbix common terms
host
The device to be monitored can be specified by ip or host name (must be resolvable).
host groupThe logical container of the host, including hosts and templates, the host is usually used when assigning monitoring permissions to users or user groups.
Monitoring item (item)A specific specified related data, such as memory size, CPU usage, or even the running status of the service, etc., the monitoring item data comes from the monitored object, and each monitoring item is identified by a key value.
triggerAn expression used to evaluate whether the monitored value is within a reasonable range. When the received value exceeds the trigger's specification, it is considered a fault. If it meets again after exceeding, it is considered normal.
eventA specific time triggered by the trigger, or an event defined by zabbix with a custom upper limit registered host.
actionRefers to the specific measures that zabbix takes to deal with the specific time triggered by the trigger according to the configuration, such as executing a script, or sending an email to the administrator mailbox, etc.
alarm escalation (escalation)Custom schemes for sending alerts or executing remote commands.
mediaMeans of sending notifications (alarms), such as: telephone, WeChat, email, SMS, corporate WeChat, DingTalk, etc.
notifications (notification)Informational remote commands sent to the user about events through the specified medium
Refers to the commands written in advance by the operation and maintenance personnel, which can be executed by the monitored host after an event is triggered.
templateA combination of preset entries for quickly monitored hosts, usually including monitoring items, triggers, applications, etc. Templates can be directly connected to a host
application (application)A collection of monitored
web scenarios (web scenario)One or more HTTP request
frontends used to detect the availability of the web site (frontend)zabbix web interface
6. How Zabbix works
The Zabbix agent is installed on the monitored host. The zabbix agent is responsible for collecting various local data of the client on a regular basis and sending it to the Zabbix server. After receiving the data, the zabbix server stores the data in the database.
Based on Zabbix Web, users can see the data and display images on the front end.
When Zabbix monitors a specific project, the project will set a trigger threshold. When the monitored indicator exceeds the threshold set by the trigger, some necessary actions will be taken. The actions include: sending information (email, WeChat, SMS, phone calls, DingTalk), send commands (shell commands, rebbot, restart, install, etc.)
When an alarm is issued, it can be automatically processed according to the alarm mechanism (such as using a shell script to start the nginx service, etc.), and if it cannot be processed automatically, the corresponding operation and maintenance personnel will be notified to handle it.
Principle summary
The zbbix_server server can obtain the data of the zabbix_agent client in an active or passive manner. After the zabbix_server gets the data, it analyzes it and stores it in its own database. Then zabbix sends the data to the web_server, and then the user accesses the UI interface of the web_server through the client.
7. Five common programs for Zabbix monitoring deployment
Zabbix monitoring is deployed in the system, including five common programs: zabbix_server, zabbix_agent, zabbix_proxy, zabbix_get, zabbix_sender, etc.
① zabbix_server
The zabbix server daemon process, in which the data of zabbix_agent, zabbix_get, zabbix_sender, and azbbix_proxy are finally handed over to zabbix_server.
② zabbix_agentThe client daemon process is responsible for collecting client data, for example: collecting CPU load, memory, hard disk, middleware usage
③ zabbix_proxyThe zabbix distributed agent daemon process, usually larger than 500 hosts, requires the deployment of a distributed monitoring architecture.
④ zabbix_getThe data receiving tool uses commands alone, and usually executes commands to obtain remote client information on the server or proxy side.
⑤ zabbix_sebderZabbix data sending tool, the user sends data to the server or proxy end, usually the user takes a long time to check