1. Initial Pandas
Pandas is one of the three major pieces of data analysis. It is the core analysis library of Python. It provides fast, flexible, and clear data structures. It can handle various types of data structures simply, intuitively, and quickly.
The data structures supported by pandas are as follows:
- SQL or Excel-like data
- Ordered or unordered time series data.
- matrix data with row and column labels
- Any other form of observational, statistical data set.
pandas provides the main data structures Series (one-dimensional array structure) and DataFrame (two-dimensional array structure), which can handle finance, statistics, social science, engineering and other fields.
2. Anaconda, the standard environment for data analysis
Anaconda is a Python development environment suitable for data analysis. It is an open source Python distribution that includes more than 180 scientific packages and their dependencies such as conda (package management/environment management), Python, etc.
Detailed explanation of Anaconda installation on Windows
3. Pandas quick start
Pandas easily imports Excel data
Student Transcript:
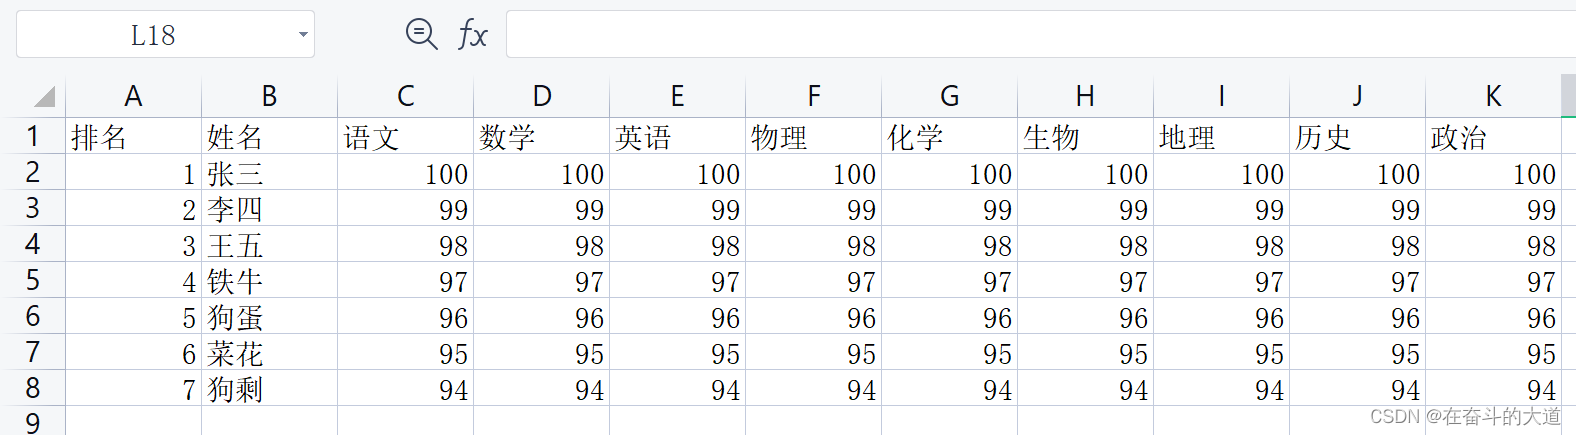
Python function code:
import pandas as pd #导入pandas 模块

# 读取excel 文件内容
df = pd.read_excel("excel/data.xlsx")
# 输出前5条记录
print(df.head())
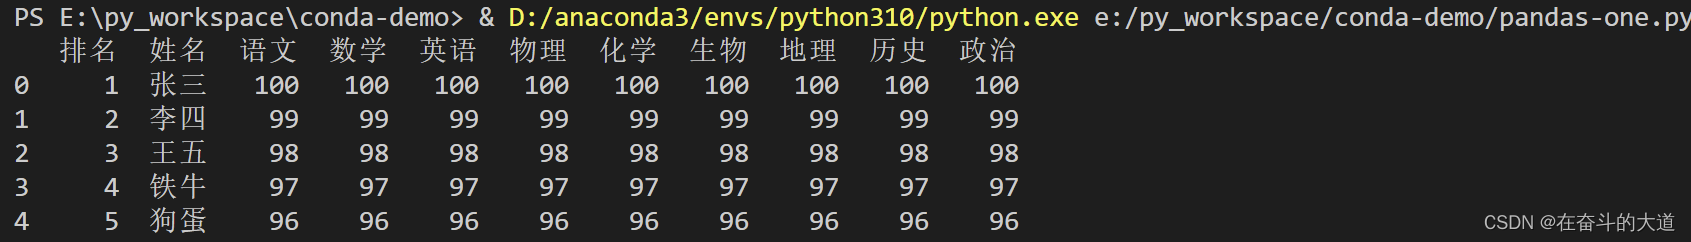
Show results:
PS E:\py_workspace\conda-demo> & D:/anaconda3/envs/python310/python.exe e:/py_workspace/conda-demo/pandas-one.py
   排名  姓名   语文   数学   英语   物理   化学   生物   地理   历史   政治
0   1  张三  100  100  100  100  100  100  100  100  100
1   2  李四   99   99   99   99   99   99   99   99   99
2   3  王五   98   98   98   98   98   98   98   98   98
3   4  铁牛   97   97   97   97   97   97   97   97   97
4   5  狗蛋   96   96   96   96   96   96   96   96   96
Problem: Pandas outputs the results, and the columns are not aligned.
Align the column names by setting display.unicode.east_asian_width to true.
import pandas as pd #导入pandas 模块

#解决输出列名不对齐的问题
pd.set_option("display.unicode.east_asian_width", True)
# 读取excel 文件内容
df = pd.read_excel("excel/data.xlsx")
# 输出前5条记录
print(df.head())
Modify the default output maximum number of rows and columns by setting display.max_rows and display.max_columns
Quick Start with Pandas Series
Series is a data structure in the Pandas library, similar to a one-dimensional array, consisting of a set of data values (value) and a set of labels, where there is a one-to-one correspondence between labels and data values.
Series can save any data type, such as integers, strings, floating-point numbers, Python objects, etc., and its labels default to integers, starting from 0 and increasing sequentially. The structure diagram of Series is as follows:

Through different color labels, we can more intuitively view the location of the data and the corresponding index location.
Series object creation
Create a Series object, mainly using the Series class of Pandas.
Basic syntax:
import pandas as pd

s = pd.Series(data, index, dtype, name, copy, fastpath)
Parameter Description:
| parameter name | describe |
| data | The input data can be a list, constant, ndarray array, etc. |
| index | Index values must be unique, and defaults to np.arrange(n) if no index is passed. |
| dtype | dtype indicates the data type, if not provided, it will be automatically judged. |
| name | Series object name |
| copy | Indicates to copy the data, the default is False. |
| fastpath | Validate the Series object name, defaults to False. |
1) Create an empty Series object
An empty Series object can be created using the following method, as follows:
import pandas as pd
# 创建一个空Series 对象
s = pd.Series()

print(s)
output result:
e:\py_workspace\conda-demo\pandas-series-one.py:3: FutureWarning: The default dtype for empty Series will be 'object' instead of 'float64' in a future version. Specify a dtype explicitly to silence this warning.
  s = pd.Series()
Series([], dtype: float64)
2) ndarray creates a Series object.
ndarray is an array type in NumPy. When data is ndarry, the passed index must have the same length as the array. If no parameter is passed to the index parameter, by default, the index value will be generated using range(n), where n represents the length of the array, as follows:
[0,1,2,3…. range(len(array))-1]
Using the default index, create a Series object:
# 创建一个ndarray 数组类型的Series 对象
data = np.array([100, 99, 98, 97])
snp = pd.Series(data)
print(snp)
output result:
0    100
1     99
2     98
3     97
dtype: int32
3) Manually set the Series object index
Creating a Series object will automatically generate an index. The index is allocated from 0 by default, and its index ranges from 0 to 0. len(data)-1。This setting method is called "implicit index".
Below by manually setting the index, also known as "explicit index"
# 创建一个ndarray 数组类型的Series 对象, 并且手动设置索引
sindex = pd.Series(data, index=['a', 'b', 'c', 'd'])
print(sindex)
Output result:
a    100
b     99
c     98
d     97
dtype: int32
4) dict creates a Series object
You can take dict as input data. If no index is passed in, the index will be constructed according to the keys of the dictionary; on the contrary, when the index is passed, the index label needs to be one-to-one corresponding to the value in the dictionary.
# 创建一个dict 字典类型的Series 对象
dt ={ "a" : 100, "b" : 120, "c" : 150}
sdt = pd.Series(dt)
print(sdt)
Output result:
a    100
b    120
c    150
dtype: int64
Knowledge expansion: If the data attribute type of the Series object is dict (dictionary) and the index (index) is passed, what effect will it have?
# 创建一个dict 字典类型的Series 对象, 并且设置index
sdtindex = pd.Series(dt, index=["a", "1", "2"])
print(sdtindex)
output result:
a    100.0
1      NaN
2      NaN
dtype: float64
Conclusion: Fill with NaN (not a number) when the passed index value cannot find its corresponding value.
5) Create a Series object with a scalar
If data is a scalar value, an index must be provided.
# 创建标量的Series 对象,并且必须设置index
sscalar = pd.Series(10, index=[1, 2, 3, 4])
print(sscalar)
output result:
1    10
2    10
3    10
4    10
dtype: int64
The scalar value is repeated by the number of index, and there is a one-to-one correspondence with it.
Accessing Series data
In the previous chapter, we summarized the various ways to create Series objects. This chapter mainly explains: How to access the elements in the Series sequence?
Mainly divided into two ways: position index and index label.
1) Position Index/Tag Index Access
Series position index starts from 0, [0] is the first number of Series; [1] is the second number of Series, and so on.
import pandas as pd
import numpy as np

# 基于ndarray 创建一个Series 对象
data = np.array([98, 100, 102, 110, 148])
s = pd.Series(data, index = ["1", "2", "3", "4", "5"])

print(s)

# 通过位置索引访问数据
print(s[0])
# 通过标签索引访问数据
print(s['1'])
output result:
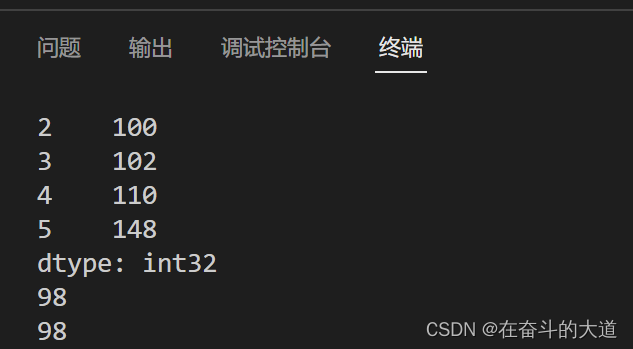
2) Slice position index/label index
Use the position index to slice through the Series object, the same as the usage of the list list.
import pandas as pd
import numpy as np

# 基于ndarray 创建一个Series 对象
data = np.array([98, 100, 102, 110, 148])
s = pd.Series(data, index = ["1", "2", "3", "4", "5"])

print(s)

# 通过位置索引访问数据
print(s[0])
# 通过标签索引访问数据
print(s['1'])

# 通过切片位置索引访问数据
print(s[0:4])
# 通过切片标签索引访问数据
print(s['1':'5'])
Output result:
PS E:\py_workspace\conda-demo> & D:/anaconda3/envs/python310/python.exe e:/py_workspace/conda-demo/panfas-series-two.py
1 98
2 100
3 102
4 110
5 148
dtype: int32
98
98
1 98
2 100
3 102
4 110
dtype: int32
1 98
2 100
3 102
4 110
5 148
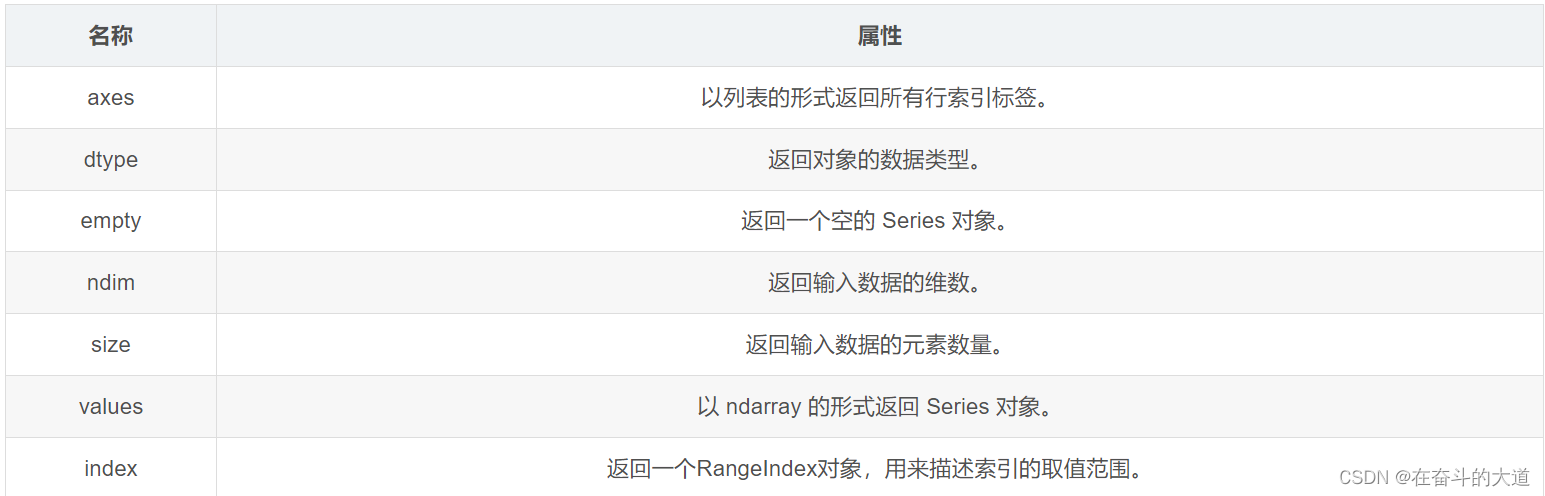
dtype: int32Series common attributes
In this chapter, we will introduce the common properties and methods of Series. Common attributes of Series objects are listed in the following table.
Python function code:
import pandas as pd
import numpy as np

# 定义一个ndarray 数组类型的Series 对象
data = np.array([100, 98, 102, 78, 102])
s = pd.Series(data, index=["A", "B", "C", "D", "E"])

# Series 对象的axes属性
print(s.axes)

# Series 对象的dtype 属性
print(s.dtype)

# 判断 Series 对象是否为空, empty 属性
print(s.empty)

# 查看 Series 对象的维度, ndim 属性
print(s.ndim)

# 查询 Series 对象的长度, size 属性
print(s.size)


# 以数组形式返回Serise 对象中的value,  values 属性
print(s.values)

# 查看Serise 对象的位置索引范围, index
print(s.index)
output result:
PS E:\py_workspace\conda-demo> & D:/anaconda3/envs/python310/python.exe e:/py_workspace/conda-demo/pandas-series-three.py
[Index(['A', 'B', 'C', 'D', 'E'], dtype='object')]
int32
False
1
5
[100  98 102  78 102]
Index(['A', 'B', 'C', 'D', 'E'], dtype='object')
Series common methods
1) head()&tail() view data
If you want to view a certain part of the Series data, you can use the head() or tail() method. Among them, head() returns the first n rows of data, and the first 5 rows of data are displayed by default.
Python function code:
import pandas as pd
import numpy as np

# 定义一个ndarray 数组类型的Series 对象
data = np.array([100, 98, 102, 78, 102, 110, 143, 144])
s = pd.Series(data, index=["A", "B", "C", "D", "E", "F", "G", "H"])

# head() 函数,查看Serise 对象前几行数据, 默认前五行
print(s.head())

# head() 函数, 指定前*行数据
print(s.head(1))

# tail() 函数, 查看Serise 对象后几行数据, 默认后五行
print(s.tail())

# tail() 函数, 指定后*行数据
print(s.tail(1))
Output result:
PS E:\py_workspace\conda-demo> & D:/anaconda3/envs/python310/python.exe e:/py_workspace/conda-demo/pandas-series-four.py
A    100
B     98
C    102
D     78
E    102
dtype: int32
A    100
dtype: int32
D     78
E    102
F    110
G    143
H    144
dtype: int32
H    144
dtype: int32
2) isnull()¬null() detects missing values
isnull() and nonull() are used to detect missing values in Series. The so-called missing value, as the name implies, means that the element value does not exist, is missing, or is missing.
isnull(): Returns True if the element value does not exist or is missing.
notnull(): Returns False if the element value does not exist or is missing.
Python function code:
# 定义一个普通数组类型 的Series 对象
datas = [1, 2, 3, None]
sbool = pd.Series(datas)

# isnull 判断Series 对象中的数据项是否包含空
print(sbool.isnull())

# nonull 判断Serise 对象中的数据项是否包含空
print(sbool.notnull())
output result:
0    False
1    False
2    False
3     True
dtype: bool
0     True
1     True
2     True
3    False
dtype: bool
Quick Start with Pandas DataFrames
DataFrame is one of the important data structures of Pandas, and it is also one of the most commonly used structures in the process of data analysis using Pandas.
DataFrame data structure
DataFrame is a tabular data structure with both row labels (index) and column labels (columns). It is also called a heterogeneous data table. The so-called heterogeneity means that the data types of each column in the table can be different. For example, it can be a string, an integer, or a floating-point type. The DataFrame data structure diagram is as follows:
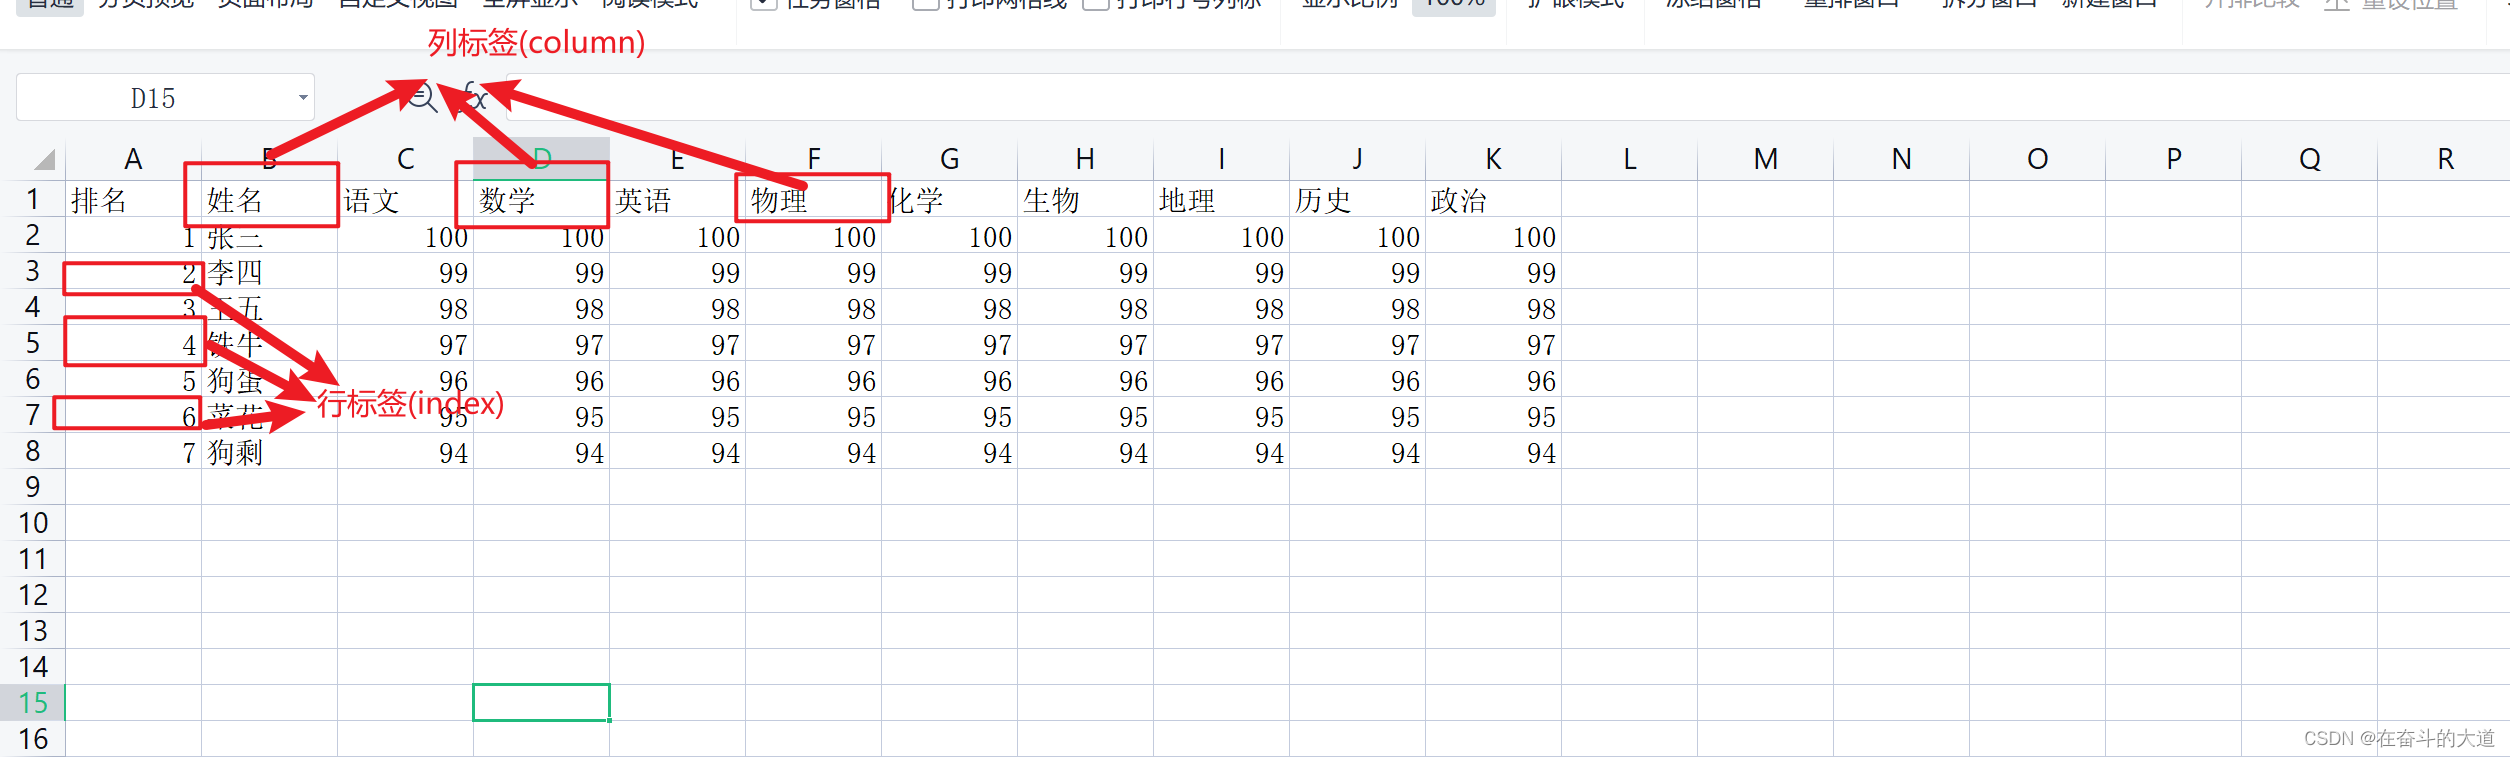
The table shows the relevant data of the scores of each subject in the exam of a certain class of students. Data is represented in rows and columns, where each column represents an attribute and each row represents information for an entry.
The following table shows the data type of the data described by each column label in the above table, as follows:
| Column | Type |
| ranking | String |
| Name | String |
| language | Integer |
| math | Integer |
| English | Integer |
| physics | Integer |
| Chemical | Integer |
| biology | Integer |
| geography | Integer |
| history | Integer |
| politics | Integer |
Each row of data in DataFrame can be regarded as a Series structure, but DataFrame adds a column label to each data value in these rows. Therefore, DataFrame is actually evolved from the basis of Series. DataFrame is widely used in data analysis tasks because it describes data more clearly and intuitively.
DataFrame summary:
- Different data types are allowed for the label values of each column of the DataFrame;
- DataFrame is a tabular data structure with rows and columns;
- Every data value in a DataFrame can be modified.
- The number of rows and columns of the DataFrame structure is allowed to be added or deleted;
- DataFrame has label axes in two directions, row labels and column labels;
- DataFrame can perform arithmetic operations on rows and columns.
Create DataFrame object
The basic syntax for creating a DataFrame object is:
import pandas as pd
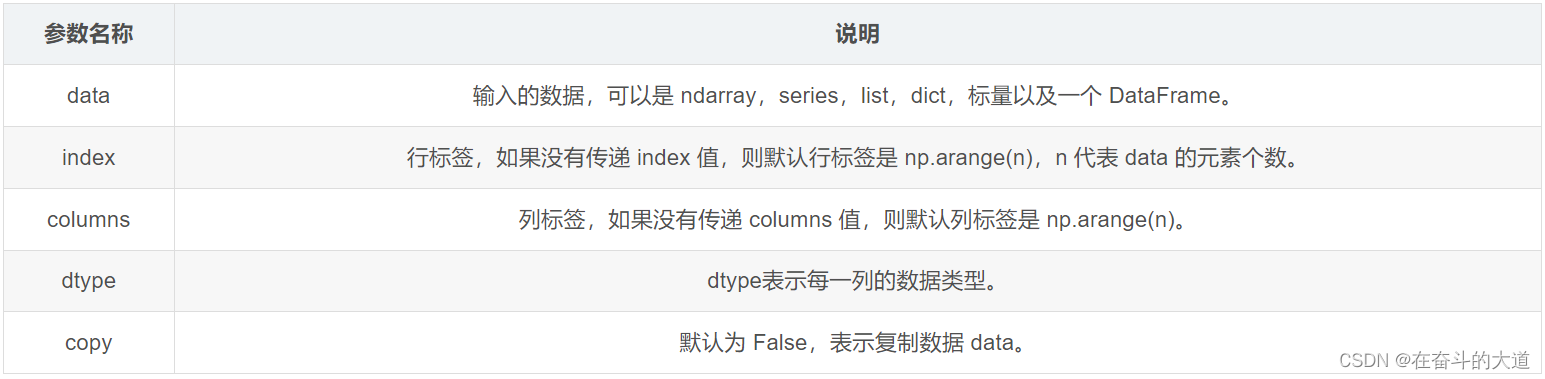
pd.DataFrame( data, index, columns, dtype, copy)
Parameter Description:
Pandas provides a variety of ways to create DataFrame objects, mainly including the following five.
1) Create an empty DataFrame object
import pandas as pd

# 创建一个DataFrame 空对象
df = pd.DataFrame()

print(df)
Output result:
PS E:\py_workspace\conda-demo> & D:/anaconda3/envs/python310/python.exe e:/py_workspace/conda-demo/pandas-dataframe-one.py
Empty DataFrame
Columns: []
Index: []
2) Create a DataFame object from the list
A DataFrame can be created using a single list or nested lists.
Python function codes: a single list
# 创建一个ndarray 数组类型,单一列表的DataFrame 对象
data = np.array([1, 10, 100])
dataf = pd.DataFrame(data)
print(dataf)
output result:
PS E:\py_workspace\conda-demo> & D:/anaconda3/envs/python310/python.exe e:/py_workspace/conda-demo/pandas-dataframe-one.py
Empty DataFrame
Columns: []
Index: []
     0
0    1
1   10
2  100
Python Function Code: Nested Lists
# 创建一个嵌套式数组, 嵌套式列表的DataFrame 对象
nestData = [["张三", 20], ["李四", 43], ["王五", 54]]
nestDF = pd.DataFrame(nestData, columns=["name", "score"])
print(nestDF)
output result:
  name  score
0   张三     20
1   李四     43
2   王五     54
3) Create a list of nested dictionaries
In the dictionary, the element lengths of the values corresponding to the keys must be the same (that is, the lists have the same length). If an index is passed, the length of the index should be equal to the length of the array; if no index is passed, then by default, the index will be range(n), where n represents the length of the array.
Python function code
#  使用字典数据, 创建DataFrame 对象
dictData = {"name": ["小丽", "小米", "小胡"], "height":[110, 109, 112]}
dictDF = pd.DataFrame(dictData)
print(dictDF)
output result:
 name  height
0   小丽     110
1   小米     109
2   小胡     112
Note: The default row label is used here, which is range(n). It generates 0, 1, 2, 3, and corresponds to each element value in the list.
4) List nested dictionary to create DataFrame object
A nested dictionary of lists can be passed as input data to the DataFrame constructor. By default, the keys of the dictionary are used as column names.
Python function code
# 使用列表嵌套字典, 创建DataFrame 对象
listNest =[{"name": "小王", "age": 32}, {"name": "雄霸", "age": 100}, {"name": "完颜康", "address": "中都"}]
listNestDF = pd.DataFrame(listNest)
print(listNestDF)
output result:
  name    age address
0   小王   32.0     NaN
1   雄霸  100.0     NaN
2  完颜康    NaN      中都
Note: If one of the element values is missing, that is, the key of the dictionary cannot find the corresponding value, NaN will be used instead.
Python function code: For a DataFrame object, specify the label index.
# 使用列表嵌套字典,并且指定标签索引
listNestIndexDF = pd.DataFrame(listNest, index=[1, 2, 3])
print(listNestIndexDF)
output result:
  name    age address
1   小王   32.0     NaN
2   雄霸  100.0     NaN
3  完颜康    NaN      中都
5) Series creates DataFrame objects
You can pass a Series as a dictionary to create a DataFrame object whose output row index is the collection of all indices.
Python function code:
# 使用字典,且value 对应Series 对象, 创建DataFrame 对象
dictSeries ={"one": pd.Series([1, 2, 3]),
             "two": pd.Series([10, 20, 10, 100])}
seriesDF = pd.DataFrame(dictSeries)
print(seriesDF)
output result:
   one  two
0  1.0   10
1  2.0   20
2  3.0   10
3  NaN  100
Note: For the one column, although the row index 'd' is displayed here, its value is NaN because there is no corresponding value.
Column index operation DataFrame
DataFrame can use columns to select, add and delete data.
1) Column index select data column
Python function code:
import pandas as pd
import numpy as np

# 基于字典Series 创建一个DataFrame 对象
dictSeries =  {1: pd.Series([10, 100, 102, 104]),
               2: pd.Series([1100, 203, 110, 119, 405]),
               3: pd.Series([110, 80, 102])}
serieseDF = pd.DataFrame(dictSeries)

print(serieseDF)

# 使用列索引选取数据列
print(serieseDF[1])
output result:
PS E:\py_workspace\conda-demo> & D:/anaconda3/envs/python310/python.exe e:/py_workspace/conda-demo/pandas-dataframe-two.py
       1     2      3
0   10.0  1100  110.0
1  100.0   203   80.0
2  102.0   110  102.0
3  104.0   119    NaN
4    NaN   405    NaN
0     10.0
1    100.0
2    102.0
3    104.0
4      NaN
2) Column index to add data column
#使用serieseDF['列']=值,插入新的数据列
serieseDF[4]=pd.Series([10,20,30])
print(serieseDF)
output result:
PS E:\py_workspace\conda-demo> & D:/anaconda3/envs/python310/python.exe e:/py_workspace/conda-demo/pandas-dataframe-two.py
       1     2      3
0   10.0  1100  110.0
1  100.0   203   80.0
2  102.0   110  102.0
3  104.0   119    NaN
4    NaN   405    NaN
0     10.0
1    100.0
2    102.0
3    104.0
4      NaN
Name: 1, dtype: float64
       1     2      3     4
0   10.0  1100  110.0  10.0
1  100.0   203   80.0  20.0
2  102.0   110  102.0  30.0
3  104.0   119    NaN   NaN
4    NaN   405    NaN   NaN
In addition to the way you use serieseDF[]=value, you can also use the insert() method to insert new columns.
Python function code:
# 使用insert 方法, 插入新的数据列
serieseDF.insert(4, column=5, value= [1, 2, 3, 4, 5])
print(serieseDF)
output result:
       1     2      3     4  5
0   10.0  1100  110.0  10.0  1
1  100.0   203   80.0  20.0  2
2  102.0   110  102.0  30.0  3
3  104.0   119    NaN   NaN  4
4    NaN   405    NaN   NaN  5
3) Column index delete data column
Both del and pop() can delete data columns in DataFrame.
Python function code:
# 通过del 函数, 删除DataFrame 数据列
del serieseDF[5]

print(serieseDF)
output result:
       1     2      3     4
0   10.0  1100  110.0  10.0
1  100.0   203   80.0  20.0
2  102.0   110  102.0  30.0
3  104.0   119    NaN   NaN
4    NaN   405    NaN   NaN
Python function code:
# 通过pop 函数, 删除DataFrame 数据列
serieseDF.pop(4)

print(serieseDF)
output result:
       1     2      3
0   10.0  1100  110.0
1  100.0   203   80.0
2  102.0   110  102.0
3  104.0   119    NaN
4    NaN   405    NaN
Row Index Manipulation DataFrame
After understanding the column index operation DataFrame in the previous chapter, the row index operation becomes simple.
1) Tab index selection
Pass the row labels to the loc function to select the data.
Python function code:
# 通过loc 函数, 读取DataFrame 指定行数据
print(serieseDF.loc[0])
output result:
1      10.0
2    1100.0
3     110.0
Name: 0, dtype: float64
Note: loc allows to receive two parameters which are row and column respectively, and the parameters need to be separated by "comma", but this function can only receive label index.
2) Integer index selection
Data row selection can also be achieved by passing the index position of the data row to the iloc function.
Python function code:
# 通过iloc 函数,  读取DataFrame 指定行数据
print(serieseDF.iloc[1])
output result:
1    100.0
2    203.0
3     80.0
Name: 1, dtype: float64
Note: iloc allows to accept two parameters which are row and column respectively, and the parameters are separated by "comma", but this function can only receive integer index.
3) Multi-line selection for slice operation
Use slices to select multiple rows at the same time.
Python function code:
# 使用切片方式, 读取DataFrame 指定多行数据。行数据范围:左闭右开
print(serieseDF[1:3])
output result:
       1    2      3
1  100.0  203   80.0
2  102.0  110  102.0
4) Add data row
New data rows can be added to a DataFrame using the concat() function, which appends data rows at the end of the row.
Python function code:
import pandas as pd
import numpy as np

# 定义 两个DataFrame 对象
df = pd.DataFrame([["小王", 12], ["小李", 14]], columns = ['name','age'])
dfAppend = pd.DataFrame([["小刚", 16], ["肥龙", 18]], columns = ['name','age'])

#在行末追加新数据行
dfMerge = pd.concat([df, dfAppend])
print(dfMerge)
output result:
PS E:\py_workspace\conda-demo> & D:/anaconda3/envs/python310/python.exe e:/py_workspace/conda-demo/pandas-dataframe-three.py
  name  age
0   小王   12
1   小李   14
0   小刚   16
1   肥龙   18
5) Delete data row
Delete a row of data from a DataFrame using the row index label. If index labels are duplicated, they will be deleted together.
Python function code:
# 删除指定数据行
dfConcat = dfConcat.drop(0)

print(dfConcat)
output result:
PS E:\py_workspace\conda-demo> & D:/anaconda3/envs/python310/python.exe e:/py_workspace/conda-demo/pandas-dataframe-three.py
  name  age
0   小王   12
1   小李   14
0   小刚   16
1   肥龙   18
  name  age
1   小李   14
1   肥龙   18
DataFrame Common Properties and Methods
DataFrame properties and methods

DataFrame data initialization
import pandas as pd
import numpy as np

data = {'Name':pd.Series(['c语言从入门到精通','Java从入门到精通',"Python从入门到精通",'JavaScript从入门到精通','C++从入门到精通','MYSQL从入门到精通','Spring5 企业级开发实战']),
   'years':pd.Series([5,6,15,28,3,19,23]),
   'Rating':pd.Series([4.23,3.24,3.98,2.56,3.20,4.6,3.8])}
#构建DataFrame
df = pd.DataFrame(data)

print(df)
output result:
PS E:\py_workspace\conda-demo> & D:/anaconda3/envs/python310/python.exe e:/py_workspace/conda-demo/pandas-dataframe-four.py
               Name  years  Rating
0         c语言从入门到精通      5    4.23
1        Java从入门到精通      6    3.24
2      Python从入门到精通     15    3.98
3  JavaScript从入门到精通     28    2.56
4         C++从入门到精通      3    3.20
5       MYSQL从入门到精通     19    4.60
6   Spring5 企业级开发实战     23    3.80
1) T (Transpose) transpose
Returns the transpose of the DataFrame, that is, the rows and columns are swapped.
Python function code:
# T 转置
print(df.T)
Output result:
                0           1             2                 3          4            5                6
Name    c语言从入门到精通  Java从入门到精通  Python从入门到精通  JavaScript从入门到精通  C++从入门到精通  MYSQL从入门到精通  Spring5 企业级开发实战
years           5           6            15                28          3           19               23
Rating       4.23        3.24          3.98              2.56        3.2          4.6              3.8
2) axes
Returns a list of row and column labels.
Python function code:
#输出行、列标签
print(df.axes)
output result:
[RangeIndex(start=0, stop=7, step=1), Index(['Name', 'years', 'Rating'], dtype='object')]3) dtypes
Returns the data type of each column.
Python function code:
# 输出行、列标签的数据类型
print(df.dtypes)
output result:
Name       object
years       int64
Rating    float64
dtype: object
4) empty
Returns a Boolean value to determine whether the output data object is empty, if it is True, the object is empty.
Python function code:
#判断输入数据是否为空
print(df.empty)
output result:
False5) I am
Returns the dimensionality of the data object.
Python function code:
#DataFrame的维度
print(df.ndim)
output result:
26) shape
Return a tuple representing the dimensions of the DataFrame. Returns a value tuple (a,b), where a represents the number of rows and b represents the number of columns.
Python function code:
#DataFrame的形状
print(df.shape)
output result:
(7, 3)7) size
Returns the number of elements in the DataFrame.
#DataFrame的中元素个数
print(df.size)
output result:
218) values
Return the data in the DataFrame as an ndarray array.
Python function code:
#DataFrame的数据
print(df.values)
output result:\
[['c语言从入门到精通' 5 4.23]
 ['Java从入门到精通' 6 3.24]
 ['Python从入门到精通' 15 3.98]
 ['JavaScript从入门到精通' 28 2.56]
 ['C++从入门到精通' 3 3.2]
 ['MYSQL从入门到精通' 19 4.6]
 ['Spring5 企业级开发实战' 23 3.8]]
9) head()&tail() view data
To view a portion of a DataFrame, use the head() or tail() methods. Among them, head() returns the first n rows of data, and the first 5 rows of data are displayed by default.
# DataFrame 读取默认行数
print(df.head())

# DataFrame 读取指定行数
print(df.head(3))
output result:
               Name  years  Rating
0         c语言从入门到精通      5    4.23
1        Java从入门到精通      6    3.24
2      Python从入门到精通     15    3.98
3  JavaScript从入门到精通     28    2.56
4         C++从入门到精通      3    3.20
           Name  years  Rating
0     c语言从入门到精通      5    4.23
1    Java从入门到精通      6    3.24
2  Python从入门到精通     15    3.98
tail() returns the last n rows of data
# DataFrame 读取末尾默认行数, 默认 5行
print(df.tail())
output result:
               Name  years  Rating
2      Python从入门到精通     15    3.98
3  JavaScript从入门到精通     28    2.56
4         C++从入门到精通      3    3.20
5       MYSQL从入门到精通     19    4.60
6   Spring5 企业级开发实战     23    3.80
10) shift() to move rows or columns
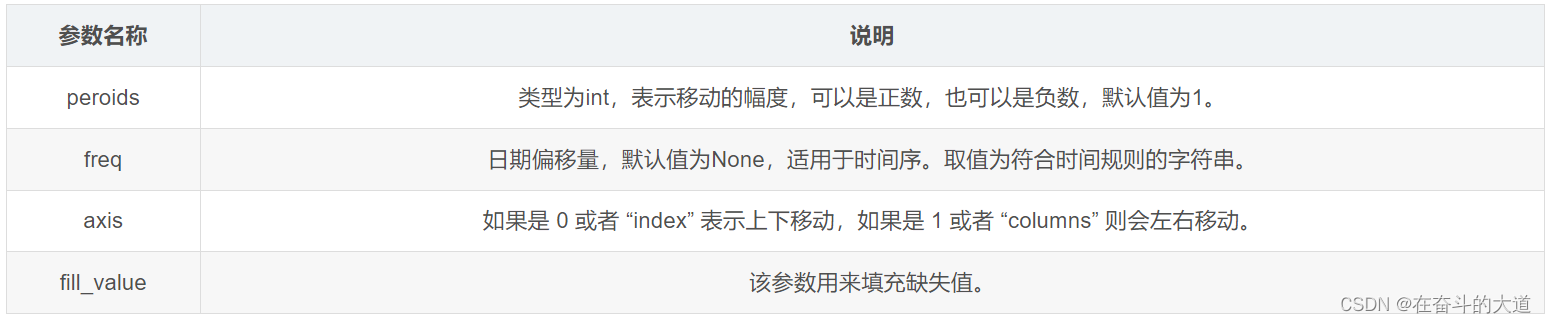
If you want to move a certain row/column in the DataFrame, you can use the shift() function to achieve it. It provides a periods parameter, which represents moving the specified strides on a specific axis.
The syntax of the shif() function is as follows:
DataFrame.shift(periods=1, freq=None, axis=0)The parameters are described as follows:
Python function code:
import pandas as pd
info= pd.DataFrame({'a_data': [40, 28, 39, 32, 18],
'b_data': [20, 37, 41, 35, 45],
'c_data': [22, 17, 11, 25, 15]})
#移动幅度为3
info.shift(periods=3)
Output result:
   a_data  b_data  c_data
0     NaN     NaN     NaN
1     NaN     NaN     NaN
2     NaN     NaN     NaN
3    40.0    20.0    22.0
4    28.0    37.0    17.0
Fill missing values in DataFrame using fill_value parameter, Python function code:
import pandas as pd
info= pd.DataFrame({'a_data': [40, 28, 39, 32, 18],
'b_data': [20, 37, 41, 35, 45],
'c_data': [22, 17, 11, 25, 15]})
#移动幅度为3
print(info.shift(periods=3))
#将缺失值和原数值替换为52
info.shift(periods=3,axis=1,fill_value= 52)
Output result:
原输出结果:
   a_data  b_data  c_data
0     NaN     NaN     NaN
1     NaN     NaN     NaN
2     NaN     NaN     NaN
3    40.0    20.0    22.0
4    28.0    37.0    17.0

替换后输出:
   a_data  b_data  c_data
0      52      52      52
1      52      52      52
2      52      52      52
3      52      52      52
4      52      52      52
Note: The fill_value parameter can not only fill in missing values, but also replace the original data.
Pandas statistics
Descriptive statistics (descriptive statistics) is a discipline in the field of statistics. It mainly studies how to obtain data reflecting objective phenomena, and process and display the collected data in the form of charts, and finally make a synthesis of the laws and characteristics of the data. Sexual descriptive analysis.
Pandas common statistical functions
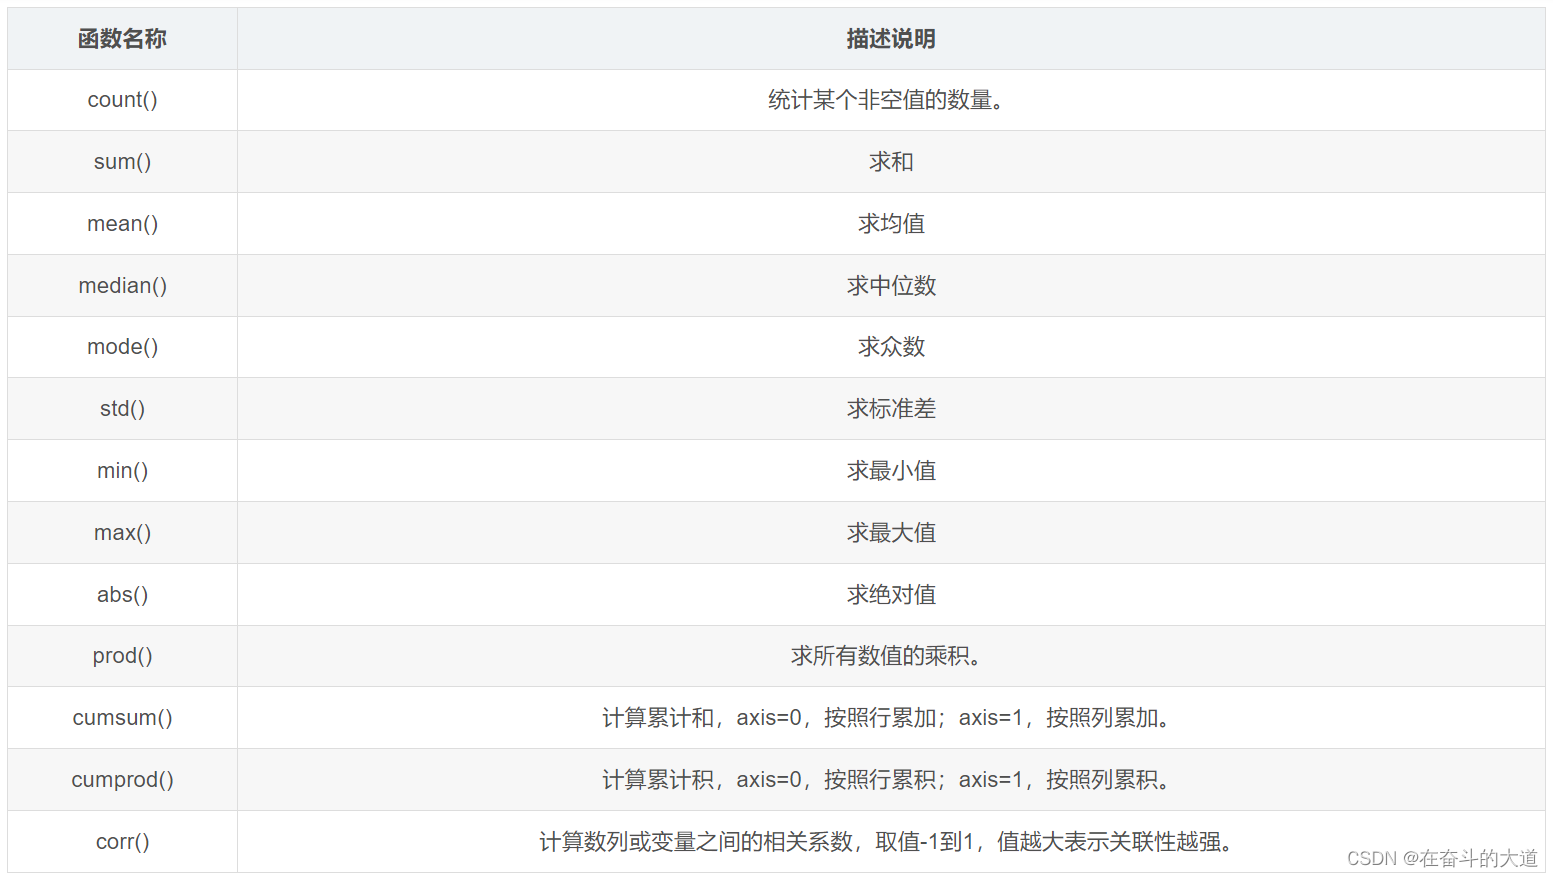
In DataFrame, the axis parameter needs to be specified when using the aggregation class method. There are two ways to pass parameters:
- For row operations, use axis=0 or "index" by default;
- For column operations, use axis=1 or use "columns" by default.
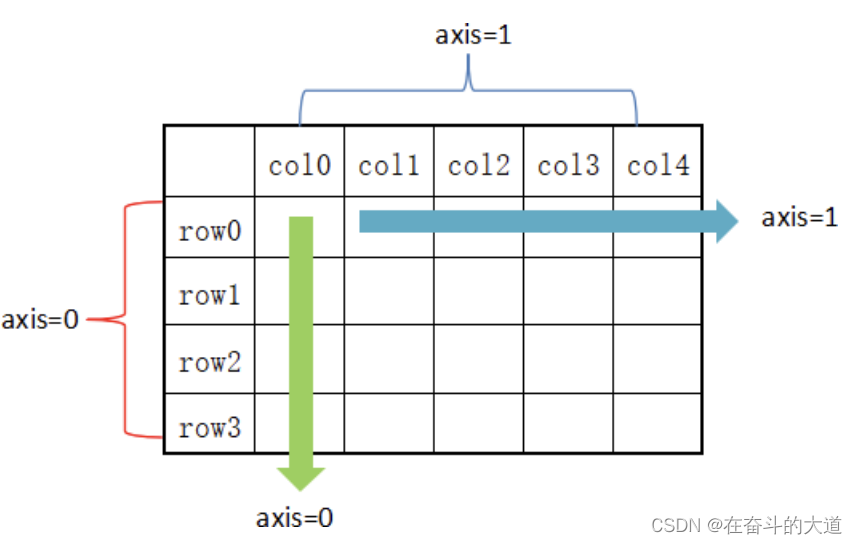
As can be seen from the above figure, axis=0 means to calculate in the vertical direction, while axis=1 means to calculate in the horizontal direction.
Create a DataFrame structure
import pandas as pd
import numpy as np

#创建字典型series结构
data = {'Name':pd.Series(['小明','小亮','小红','小华','老赵','小曹','小陈',
   '老李','老王','小冯','小何','老张']),
   'Age':pd.Series([25,26,25,23,30,29,23,34,40,30,51,46]),
   'Rating':pd.Series([4.23,3.24,3.98,2.56,3.20,4.6,3.8,3.78,2.98,4.80,4.10,3.65])
}
df = pd.DataFrame(data)

print(df)
sum() sums
By default, the sum of all values for axis=0 is returned.
# sum 求和
print(df.sum())
output result:
Name      小明小亮小红小华老赵小曹小陈老李老王小冯小何老张
Age                            382
Rating                       44.92
dtype: object
Note : The sum() and cumsum() functions can handle both numeric and string data. Although character aggregation is usually not used, using these two functions does not throw an exception; for abs(), cumprod() functions will throw an exception, because they cannot operate string data.
Specify axios row and column mode, summary statistics
# sum 指定 列模式统计
print(df.sum(axis=0))
# sum 指定 行模式统计
print(df.sum(axis=1))
output result:
Name      小明小亮小红小华老赵小曹小陈老李老王小冯小何老张
Age                            382
Rating                       44.92
dtype: object
e:\py_workspace\conda-demo\pandas-dataframe-five.py:20: FutureWarning: Dropping of nuisance columns in DataFrame reductions (with 'numeric_only=None') is deprecated; in a future version this will raise TypeError.  Select only valid columns before calling the reduction.
  print(df.sum(axis=1))
0     29.23
1     29.24
2     28.98
3     25.56
4     33.20
5     33.60
6     26.80
7     37.78
8     42.98
9     34.80
10    55.10
11    49.65
dtype: float64
mean() finds the mean
Python function code:
# mean() 平均值
print(df.mean())
output result:
e:\py_workspace\conda-demo\pandas-dataframe-five.py:23: FutureWarning: The default value of numeric_only in DataFrame.mean is deprecated. In a future version, it will default to False. In addition, specifying 'numeric_only=None' is deprecated. Select only valid columns or specify the value of numeric_only to silence this warning.
  print(df.mean())
Age       31.833333
Rating     3.743333
dtype: float64
std() to find the standard deviation
Returns the standard deviation of a numeric column.
# std() 标准差
print(df.std())
Python function code:
output result:
e:\py_workspace\conda-demo\pandas-dataframe-five.py:26: FutureWarning: The default value of numeric_only in DataFrame.std is deprecated. In a future version, it will default to False. In addition, specifying 'numeric_only=None' is deprecated. Select only valid columns or specify the value of numeric_only to silence this warning.
  print(df.std())
Age       9.232682
Rating    0.661628
dtype: float64
The standard deviation is the arithmetic square root of the variance, which reflects the degree of dispersion of a data set. Note that two sets of data with the same mean may not necessarily have the same standard deviation.
Data summary description
The describe() function displays a summary of statistics related to a column of DataFrame data.
Python function code:
#求出数据的所有描述信息
print(df.describe())
output result:
             Age     Rating
count  12.000000  12.000000
mean   31.833333   3.743333
std     9.232682   0.661628
min    23.000000   2.560000
25%    25.000000   3.230000
50%    29.500000   3.790000
75%    35.500000   4.132500
max    51.000000   4.800000
Note: Returns a statistical table of all numeric columns with multiple rows, each row is a statistical indicator, including total, mean, standard deviation, maximum and minimum values, quartiles, etc.
includeSummary information that can filter character columns or numeric columns provided by describe() .
Include related parameter values are described as follows:
- object: Indicates the statistical information description of the character column;
- number: Indicates the statistical information description of the numeric column;
- all: Summarizes statistics for all columns.
Python function code:
print(df.describe(include=["object"]))output result:
      Name
count    12
unique   12
top      小明
freq      1
Pandas visualization
Pandas has a wide range of applications in data analysis and data visualization. Pandas encapsulates an interface based on the Matplotlib drawing package, and common plot()drawing operations can be realized by calling this interface.
The reason why Pandas can realize data visualization is mainly by using the plot() method of the Matplotlib library, which simply encapsulates the plot() method, so you can directly call this interface.
Python Pandas Visualization Example
import pandas as pd
import numpy as np
import matplotlib.pyplot as plt

#创建包含时间序列的DataFrame 数据
ts = pd.Series(np.random.randn(365), index=pd.date_range("1/1/2020", periods=365))
# 图像绘制
ts.plot()
# 图像显示
plt.show()
Matplotlib plots:
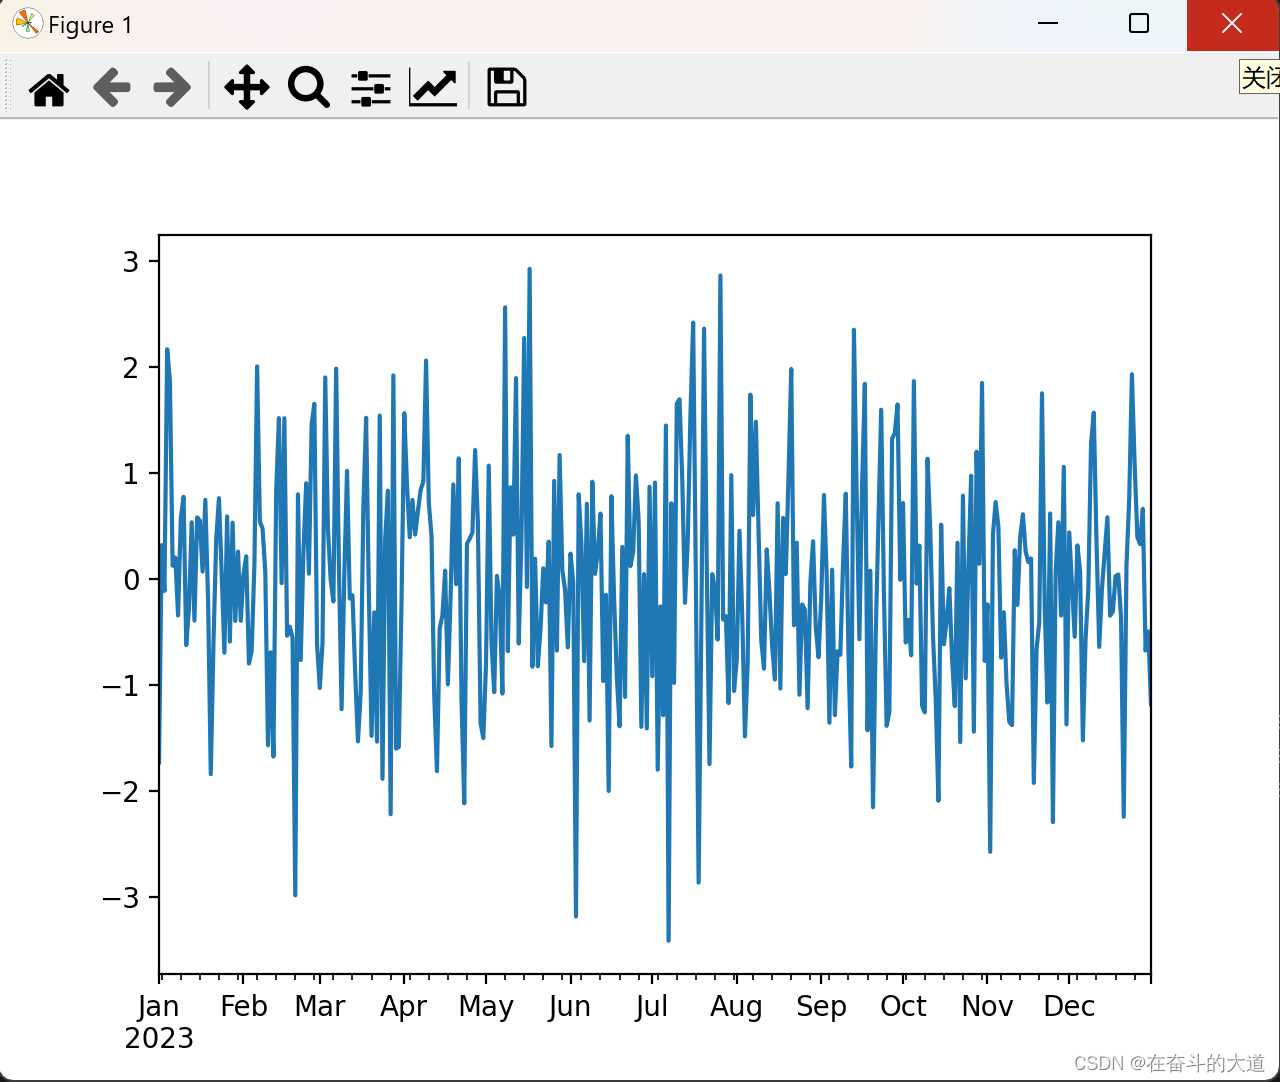
As shown above, if the row index contains a date, Pandas will automatically call gct().autofmt_xdate() to format the x-axis.
In addition to using the default line drawing, you can also use other drawing methods, as follows:
- Histogram: bar() or barh()
- Histogram: hist()
- Box box: box()
- Area map: area()
- Scatter plot: scatter()
kindThe above methods can be passed to plot() via keyword arguments .
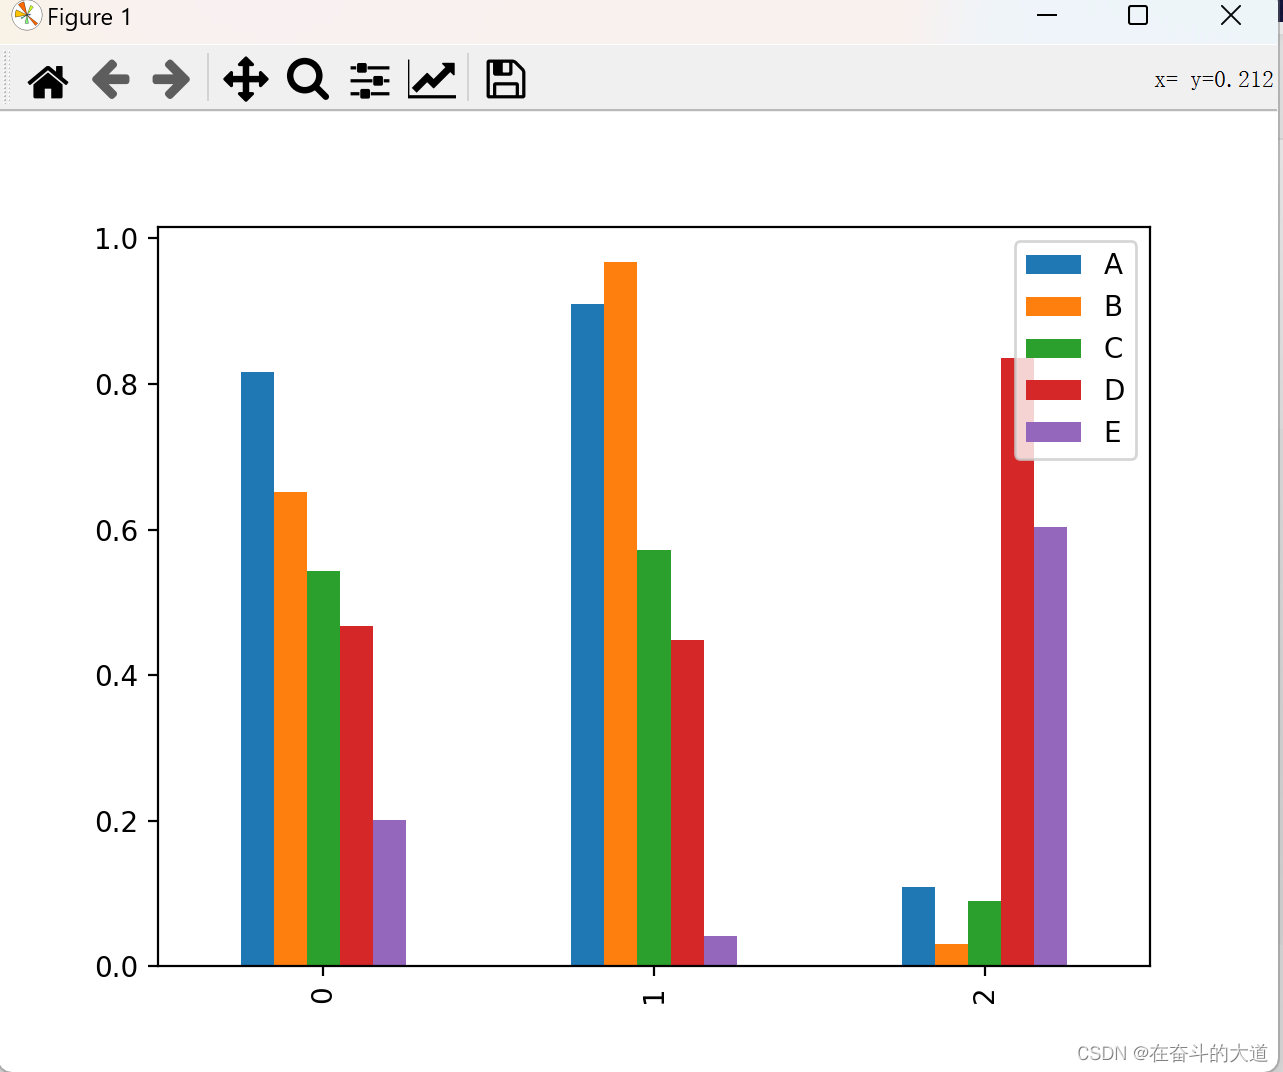
histogram
Create a histogram.
import pandas as pd
import numpy as np
import matplotlib.pyplot as plt

# 创建一个柱状图
df = pd.DataFrame(np.random.rand(3,5),columns=['A','B','C','D','E'])
print(df)
#或使用df.plot(kind="bar")
df.plot.bar()
# 图像显示
plt.show()
Matplotlib graph drawing
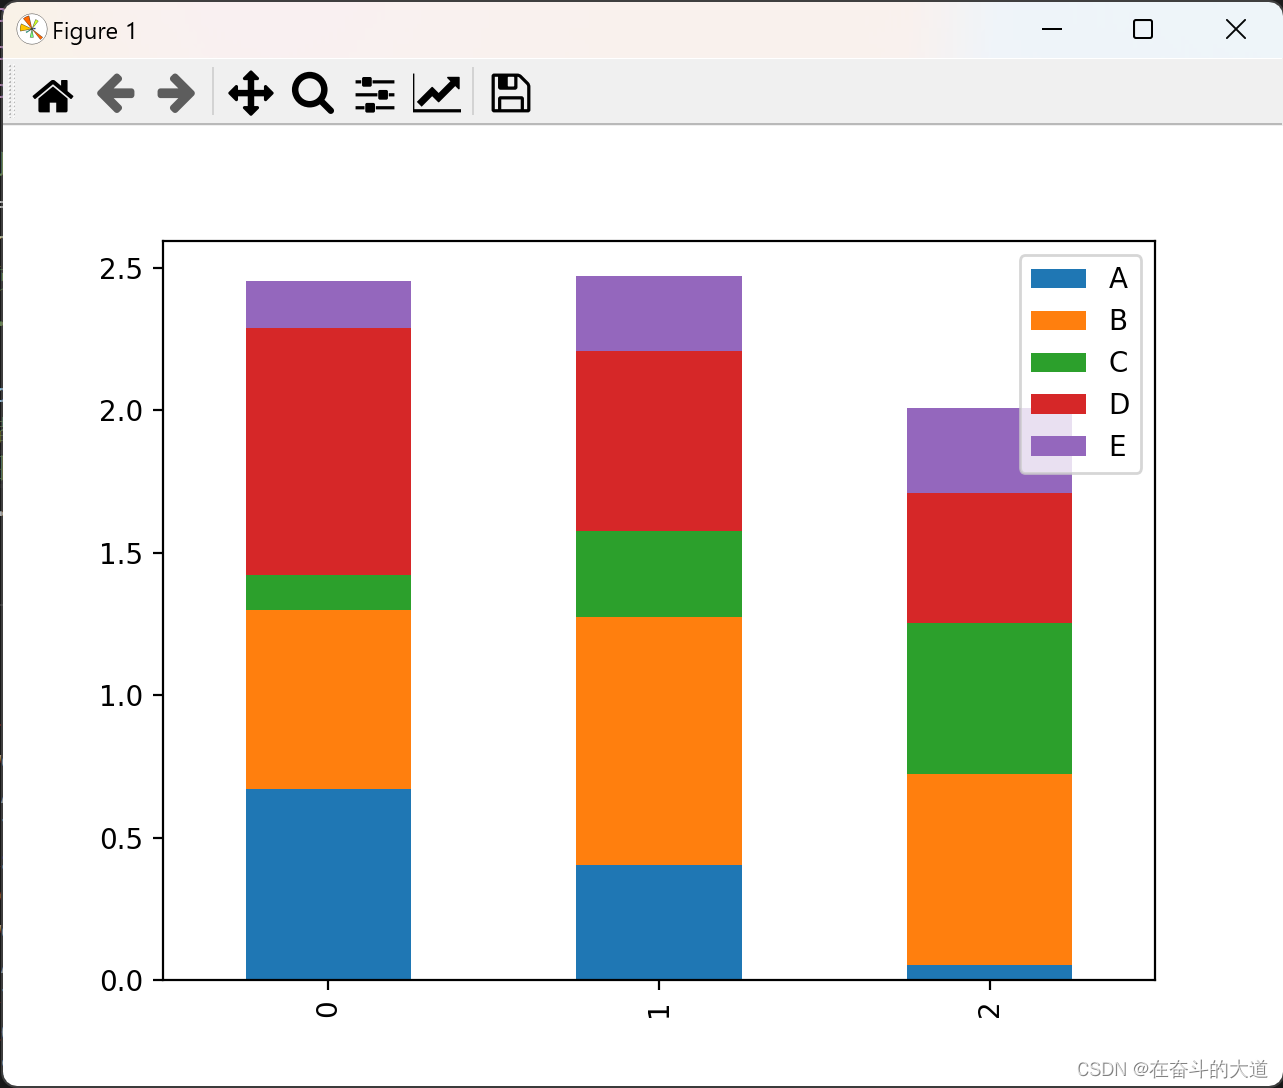
stacked=TrueColumnar stacked charts can be generated by setting parameters
import pandas as pd
import numpy as np
import matplotlib.pyplot as plt

# 创建一个柱状图
df = pd.DataFrame(np.random.rand(3,5),columns=['A','B','C','D','E'])
print(df)
#或使用df.plot(kind="bar")
#df.plot.bar()

df.plot(kind="bar",stacked=True)
#或者使用df.plot.bar(stacked="True")
# 图像显示
plt.show()
Matplotlib graph drawing
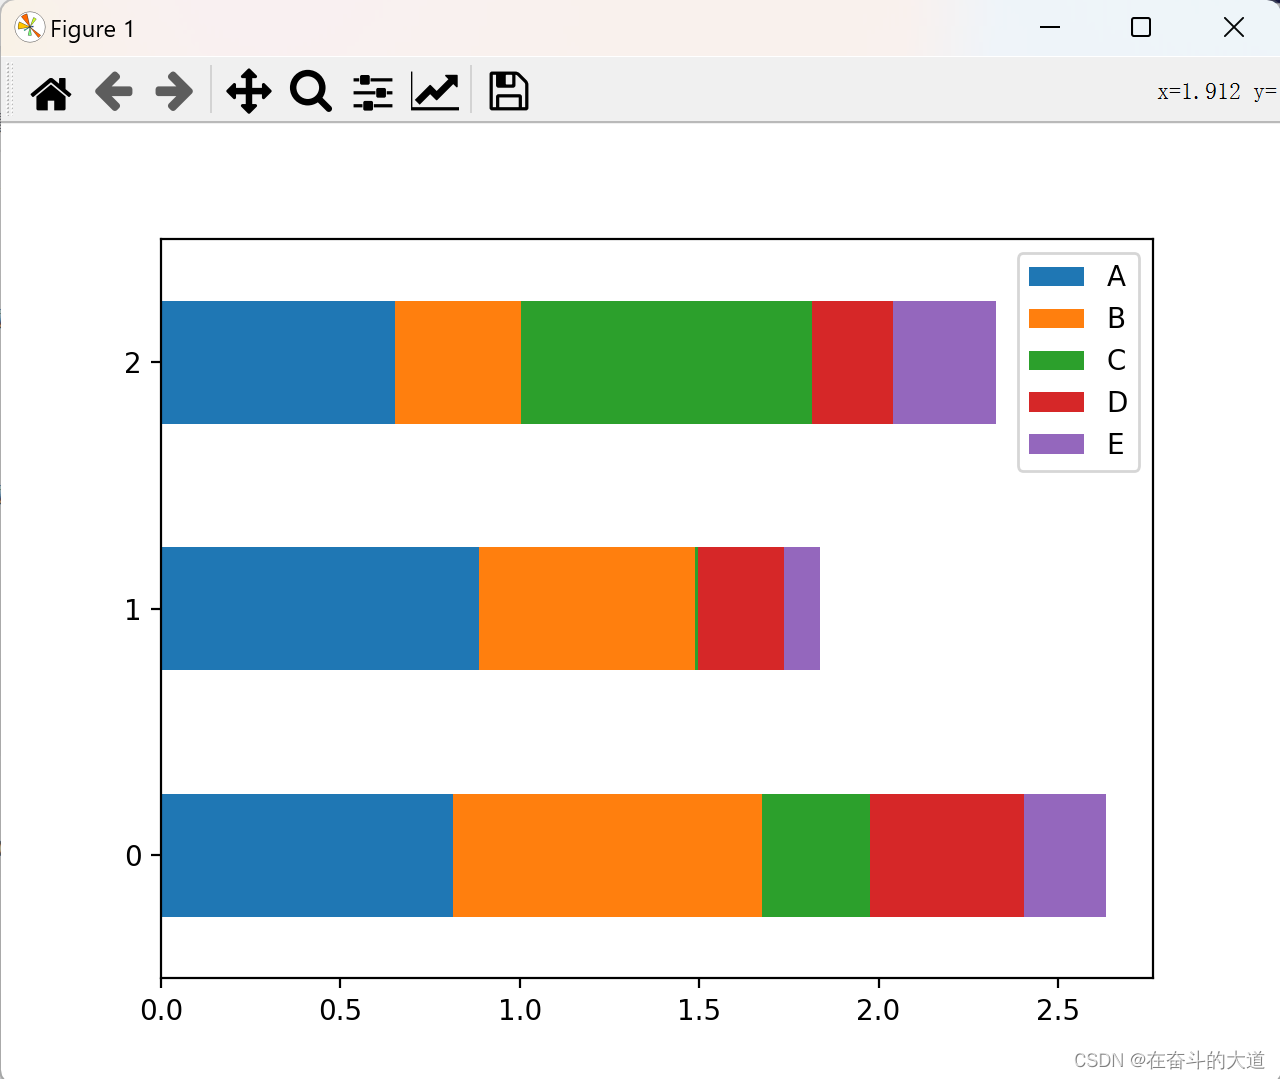
If you want to draw a horizontal histogram, you can use the following method:
import pandas as pd
import numpy as np
import matplotlib.pyplot as plt

# 创建一个DataFrame 对象
df = pd.DataFrame(np.random.rand(3,5),columns=['A','B','C','D','E'])
print(df)
#或使用df.plot(kind="bar")
#df.plot.bar()

#df.plot(kind="bar",stacked=True)
#或者使用df.plot.bar(stacked="True")

# 水平柱状图
df.plot.barh(stacked=True)
# 图像显示
plt.show()
Matplotlib graph drawing
histogram
plot.hist() can be used to draw a histogram, and it can also specify bins (the number of bins that make up the histogram).
import pandas as pd
import numpy as np
import matplotlib.pyplot as plt

df = pd.DataFrame({'A':np.random.randn(10)+2,'B':np.random.randn(10),'C':
np.random.randn(10)-2}, columns=['A', 'B', 'C'])
print(df)
#指定箱数为10
df.plot.hist(bins=10)
# 图像显示
plt.show()
Matplotlib graph drawing
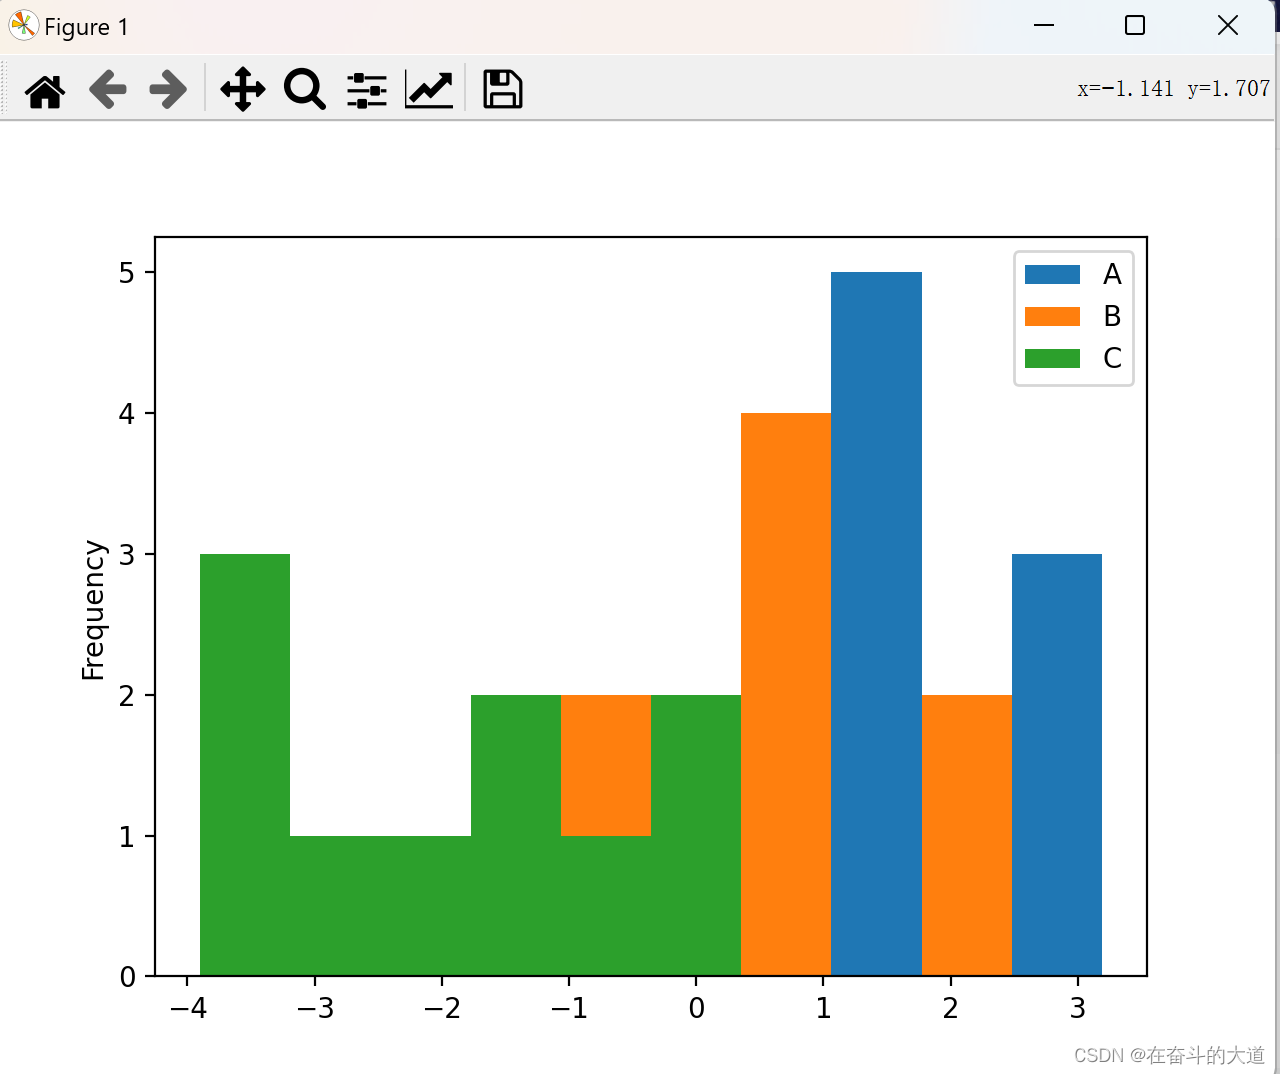
To draw a histogram for each column of data, you need to use the following method:
import pandas as pd
import numpy as np
import matplotlib.pyplot as plt

df = pd.DataFrame({'A':np.random.randn(10)+2,'B':np.random.randn(10),'C':
np.random.randn(10)-2}, columns=['A', 'B', 'C'])
print(df)
#指定箱数为10
# df.plot.hist(bins=10)

#使用diff绘制
df.diff().hist(color="r",alpha=0.5,bins=10)
# 图像显示
plt.show()
Matplotlib graph drawing

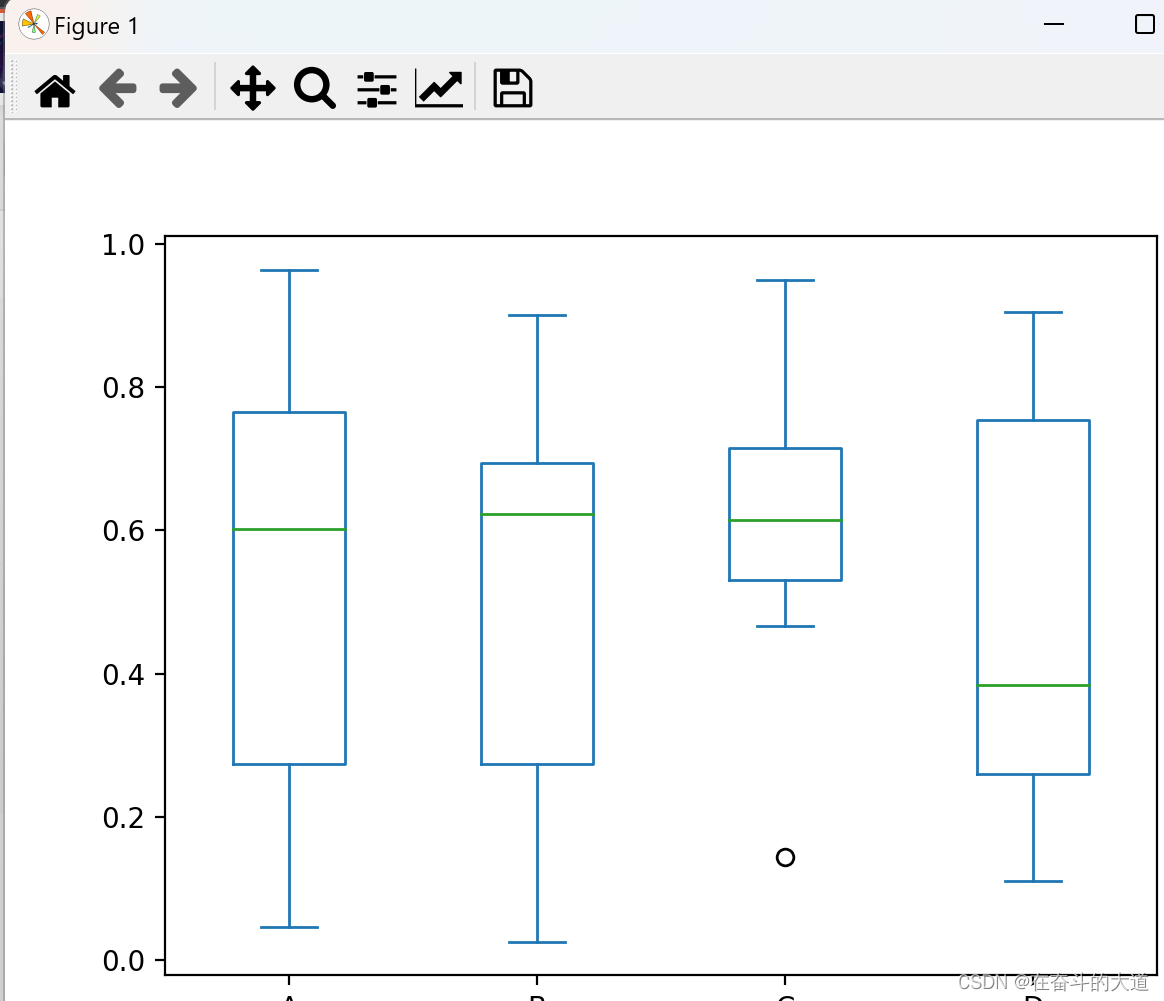
box plot
Draw a box plot by calling the Series.box.plot() , DataFrame.box.plot() or DataFrame.boxplot() method, which displays the distribution of each column of data in a visual image.
import pandas as pd
import numpy as np
import matplotlib.pyplot as plt

# 创建一个DataFrame 对象
df = pd.DataFrame(np.random.rand(10, 4), columns=['A', 'B', 'C', 'D'])
print(df)
# 图像绘制
df.plot.box()
# 图像显示
plt.show()
Matplotlib graph drawing
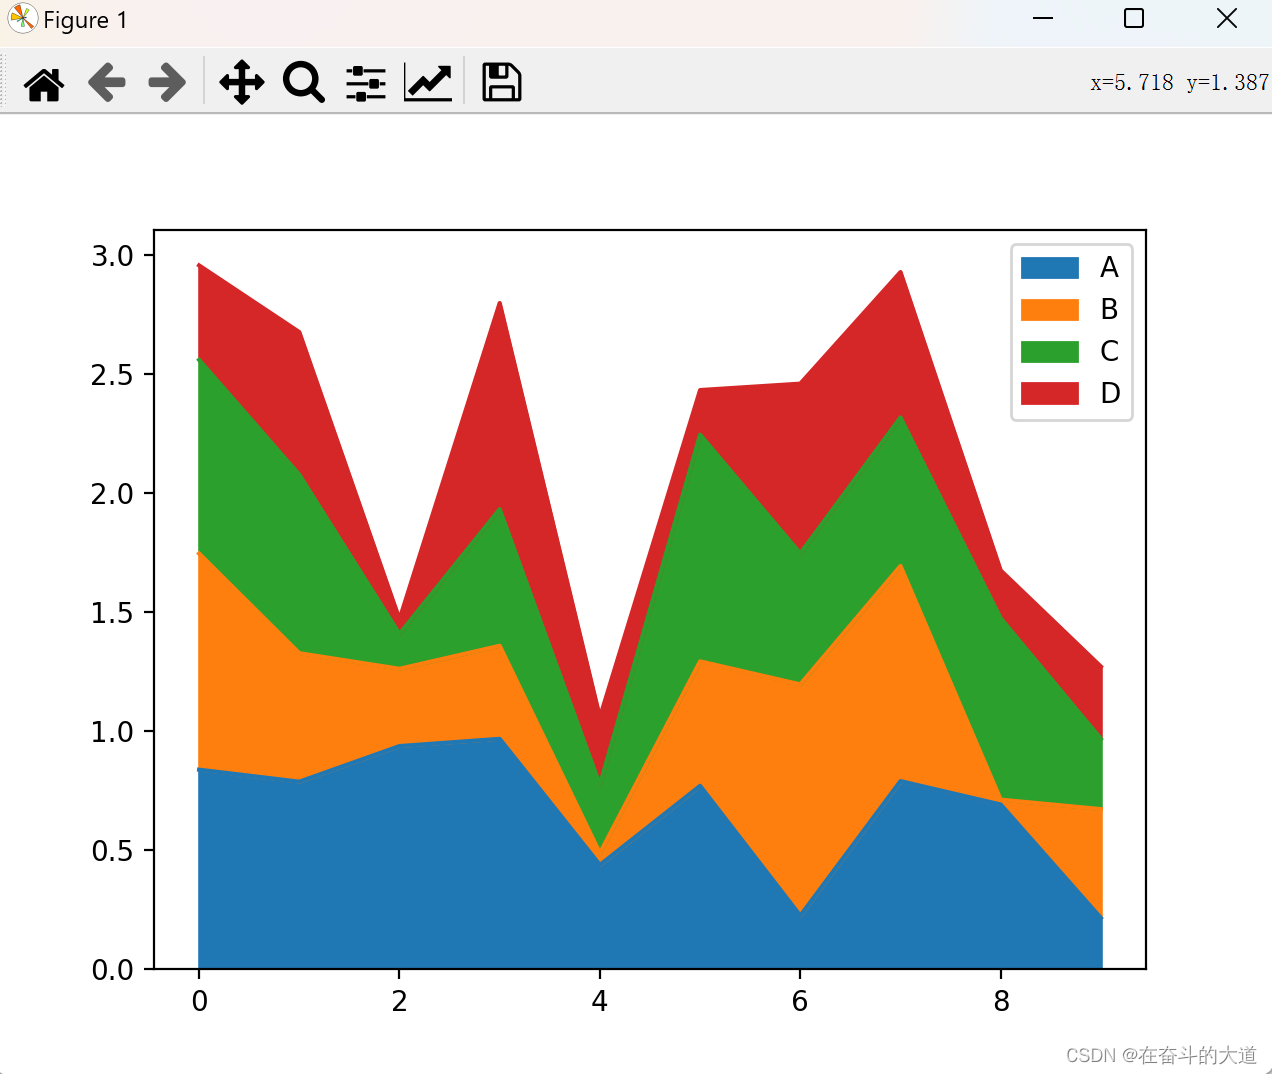
area map
Use the Series.plot.area() or DataFrame.plot.area() method to draw an area plot.
import pandas as pd
import numpy as np
import matplotlib.pyplot as plt

# 创建一个DataFrame 对象
df = pd.DataFrame(np.random.rand(10, 4), columns=['A', 'B', 'C', 'D'])
print(df)
# 图像绘制
# df.plot.box()
# 区域图绘制
df.plot.area()
# 图像显示
plt.show()
Matplotlib graph drawing
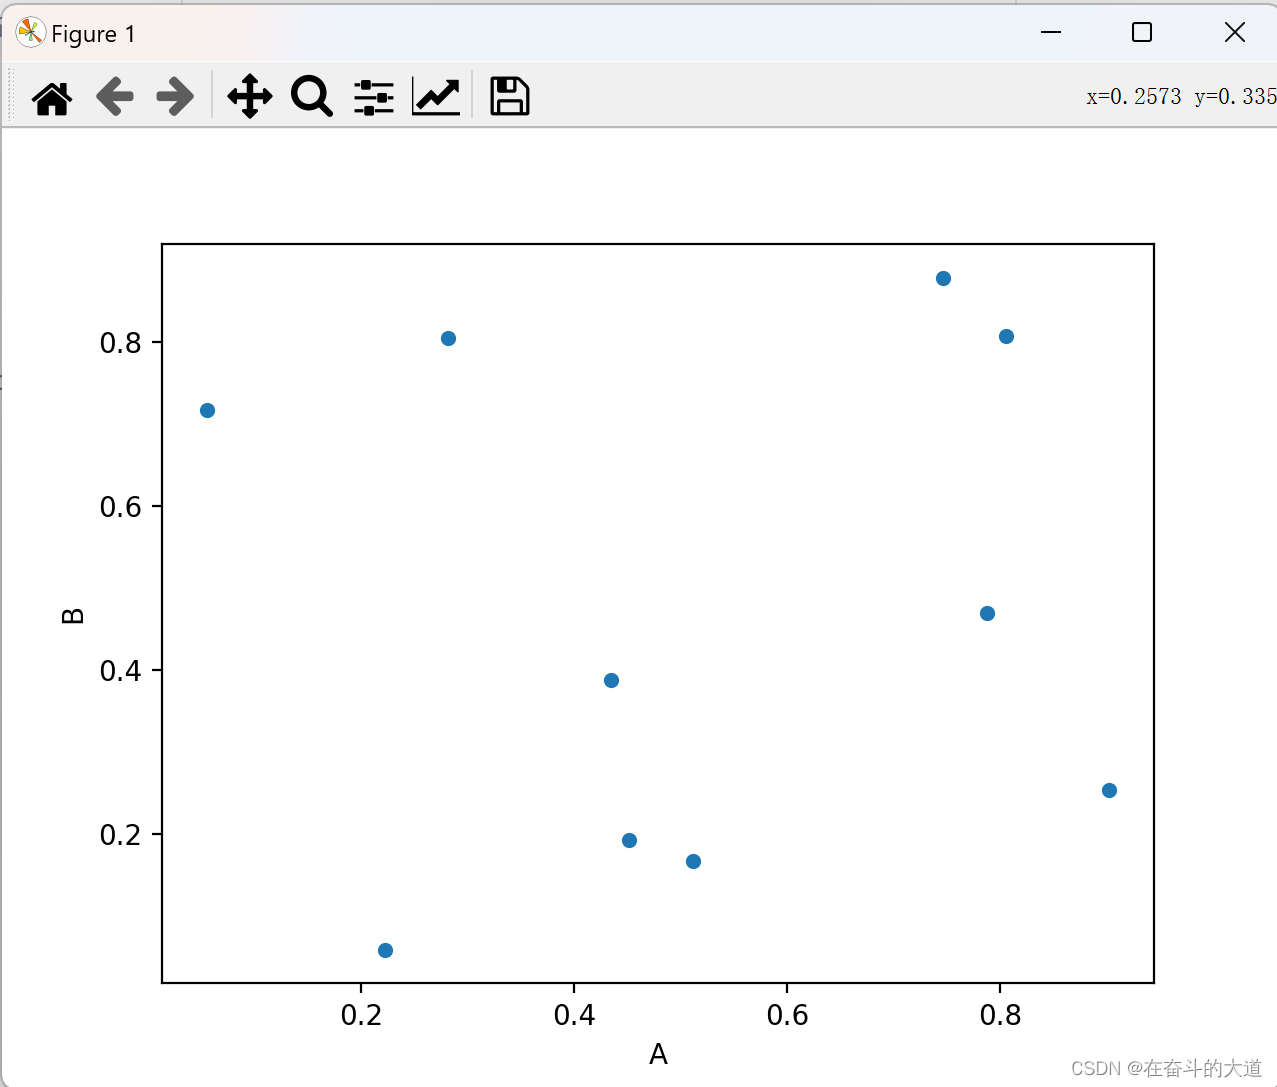
Scatterplot
Use the DataFrame.plot.scatter() method to draw a scatter plot
import pandas as pd
import numpy as np
import matplotlib.pyplot as plt

# 创建一个DataFrame 对象
df = pd.DataFrame(np.random.rand(10, 4), columns=['A', 'B', 'C', 'D'])
print(df)
# 图像绘制
# df.plot.box()
# 区域图绘制
#df.plot.area()

# 绘制闪点图
df.plot.scatter(x='A',y='B')
# 图像显示
plt.show()
Matplotlib graph drawing
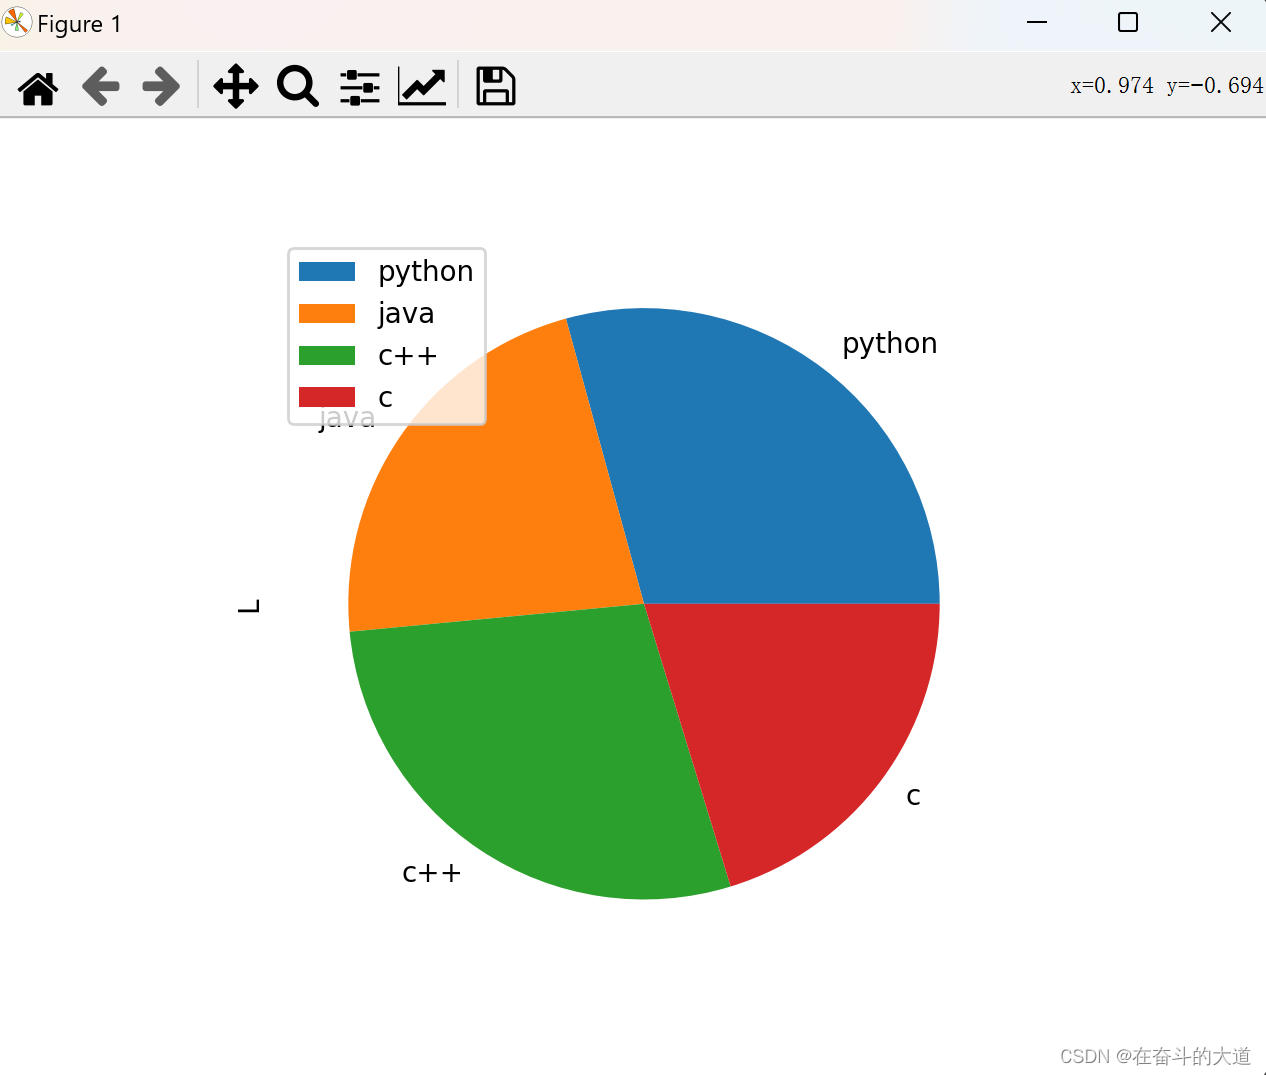
pie chart
Pie charts can be drawn with the DataFrame.plot.pie() method.
import pandas as pd
import numpy as np
import matplotlib.pyplot as plt
# 创建DataFrame 对象
df = pd.DataFrame(100 * np.random.rand(4), index=['python', 'java', 'c++', 'c'], columns=['L'])
print(df)
# 图像绘制
df.plot.pie(subplots=True)
# 图像显示
plt.show()
Matplotlib graph drawing
Pandas excel/csv read and write
The read and write operation of the file belongs to the IO operation of the computer. The Pandas IO operation provides some reader functions, such as pd.read_csv(), pd.read_json, etc., and they all return a Pandas object.
There are two functions for reading text in Pandas, namely: read_csv() and read_table(), which can automatically convert table data into DataFrame objects.
Create a new test data csv/test.csv file and add the following data:
ID,Name,Age,City,Salary
1,Jack,28,Beijing,22000
2,Lida,32,Shanghai,19000
3,John,43,Shenzhen,12000
4,Helen,38,Hengshui,3500
read_csv()
read_csv() means to read data from a CSV file and create a DataFrame object.
import pandas as pd
#需要注意文件的路径
df=pd.read_csv("./csv/test.csv")
print (df)
output result:
PS E:\py_workspace\conda-demo> & D:/anaconda3/envs/python310/python.exe e:/py_workspace/conda-demo/pandas-excel-csv-one.py
   ID   Name  Age      City  Salary
0   1   Jack   28   Beijing   22000
1   2   Lida   32  Shanghai   19000
2   3   John   43  Shenzhen   12000
3   4  Helen   38  Hengshui    3500
1) Custom index
Specify a column in the CSV file, and then use it index_colto implement a custom index.
import pandas as pd
#需要注意文件的路径
df=pd.read_csv("./csv/test.csv",  index_col=["ID"])
print (df)
output result:
PS E:\py_workspace\conda-demo> & D:/anaconda3/envs/python310/python.exe e:/py_workspace/conda-demo/pandas-excel-csv-one.py
     Name  Age      City  Salary
ID
1    Jack   28   Beijing   22000
2    Lida   32  Shanghai   19000
3    John   43  Shenzhen   12000
4   Helen   38  Hengshui    3500
2) Set the dtype of the specified column
import pandas as pd
import numpy as np
#需要注意文件的路径
df=pd.read_csv("./csv/test.csv",  dtype={'Salary':np.float64})
print (df.dtypes)
output result:
PS E:\py_workspace\conda-demo> & D:/anaconda3/envs/python310/python.exe e:/py_workspace/conda-demo/pandas-excel-csv-one.py
ID          int64
Name       object
Age         int64
City       object
Salary    float64
dtype: object
3) Change the file header name
Use the names parameter to specify the names of the header files.
import pandas as pd
import numpy as np
#需要注意文件的路径
df=pd.read_csv("./csv/test.csv",  names=["A", "B", "C", "D", "E"])
print (df)
output result:
PS E:\py_workspace\conda-demo> & D:/anaconda3/envs/python310/python.exe e:/py_workspace/conda-demo/pandas-excel-csv-one.py
    A      B    C         D       E
0  ID   Name  Age      City  Salary
1   1   Jack   28   Beijing   22000
2   2   Lida   32  Shanghai   19000
3   3   John   43  Shenzhen   12000
4   4  Helen   38  Hengshui    3500
Note: The file header name is an additional custom name, but you will find that the original header name (column label name) has not been deleted, and you can use parameters to delete it header.
Removal is achieved by passing the line number of the header, as follows:
import pandas as pd
import numpy as np
#需要注意文件的路径
df=pd.read_csv("./csv/test.csv",  names=["A", "B", "C", "D", "E"], header=0)
print (df)
output result
PS E:\py_workspace\conda-demo> & D:/anaconda3/envs/python310/python.exe e:/py_workspace/conda-demo/pandas-excel-csv-one.py
   A      B   C         D      E
0  1   Jack  28   Beijing  22000
1  2   Lida  32  Shanghai  19000
2  3   John  43  Shenzhen  12000
3  4  Helen  38  Hengshui   3500
4) skip the specified number of lines
skiprowsThe parameter indicates to skip the specified number of lines.
import pandas as pd
import numpy as np
#需要注意文件的路径
df=pd.read_csv("./csv/test.csv",  names=["A", "B", "C", "D", "E"], header=0, skiprows=1)
print (df)
output result:
PS E:\py_workspace\conda-demo> & D:/anaconda3/envs/python310/python.exe e:/py_workspace/conda-demo/pandas-excel-csv-one.py
   A      B   C         D      E
0  2   Lida  32  Shanghai  19000
1  3   John  43  Shenzhen  12000
2  4  Helen  38  Hengshui   3500
to_csv()
The to_csv() function provided by Pandas is used to convert DataFrame to CSV data. If you want to write CSV data to a file, just pass a file object to the function. Otherwise, CSV data will be returned in string format.
import pandas as pd
import numpy as np

# 基于字典创建DataFrame 对象
data = {'Name': ['小王', '小周'], 'ID': [10, 20], 'Language': ['Python', 'JavaScript']}
info = pd.DataFrame(data)
print('DataFrame Values:\n', info)

#转换为csv数据
csv_data = info.to_csv()
print('\nCSV String Values:\n', csv_data)
output result:
PS E:\py_workspace\conda-demo> & D:/anaconda3/envs/python310/python.exe e:/py_workspace/conda-demo/pandas-excel-csv-two.py
DataFrame Values:
Name ID Language
0 小王 10 Python
1 小周 20 JavaScript
CSV String Values:
,Name,ID,Language
0,小王,10,Python
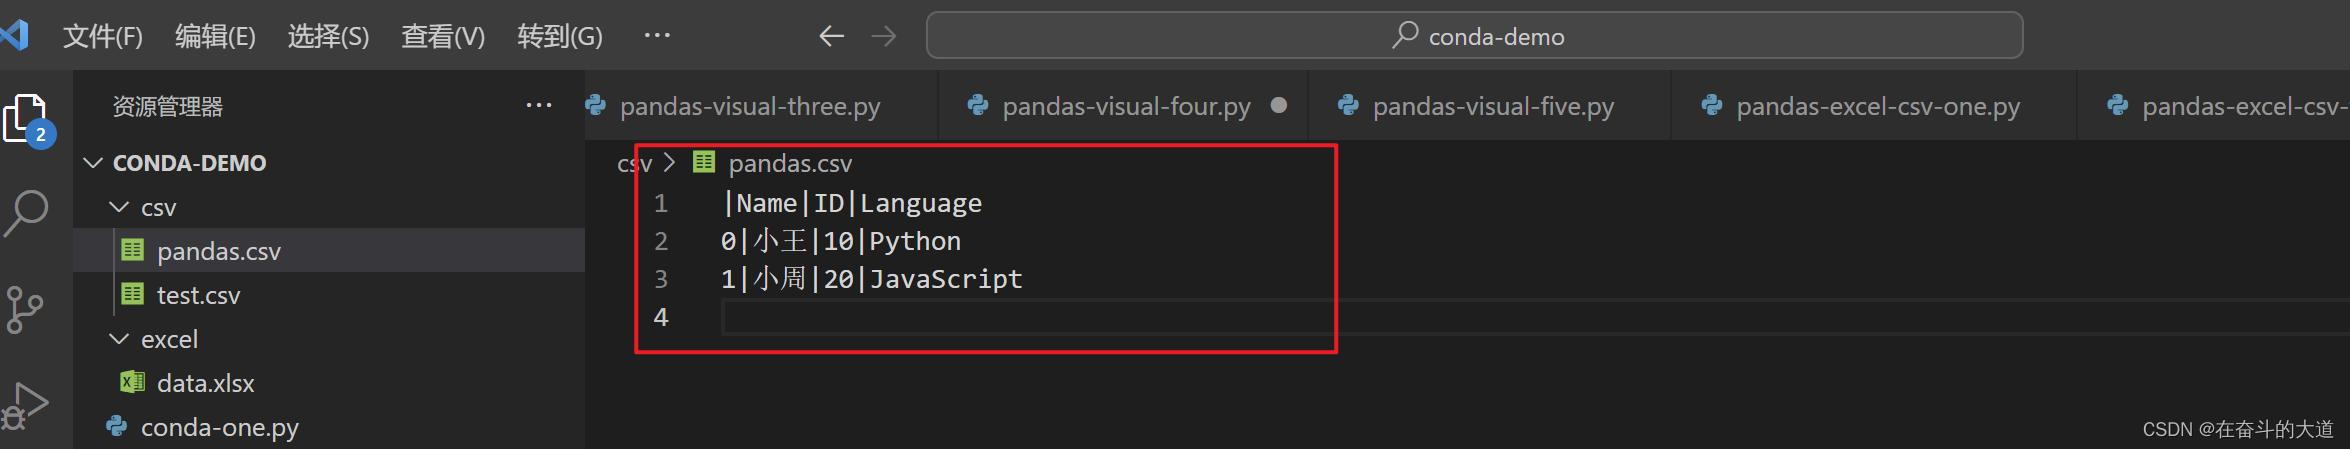
1,小周,20,JavaScriptSpecify the delimiter when outputting the CSV file and save it in the pandas.csv file, the code is as follows:
import pandas as pd
import numpy as np

# 基于字典创建DataFrame 对象
data = {'Name': ['小王', '小周'], 'ID': [10, 20], 'Language': ['Python', 'JavaScript']}
info = pd.DataFrame(data)
print('DataFrame Values:\n', info)

#写入指定csv数据文件, 温馨提示:在csv/文件夹下 创建pandas.csv 文件
csv_data = info.to_csv("./csv/pandas.csv",sep='|')
View the pandas.csv file:
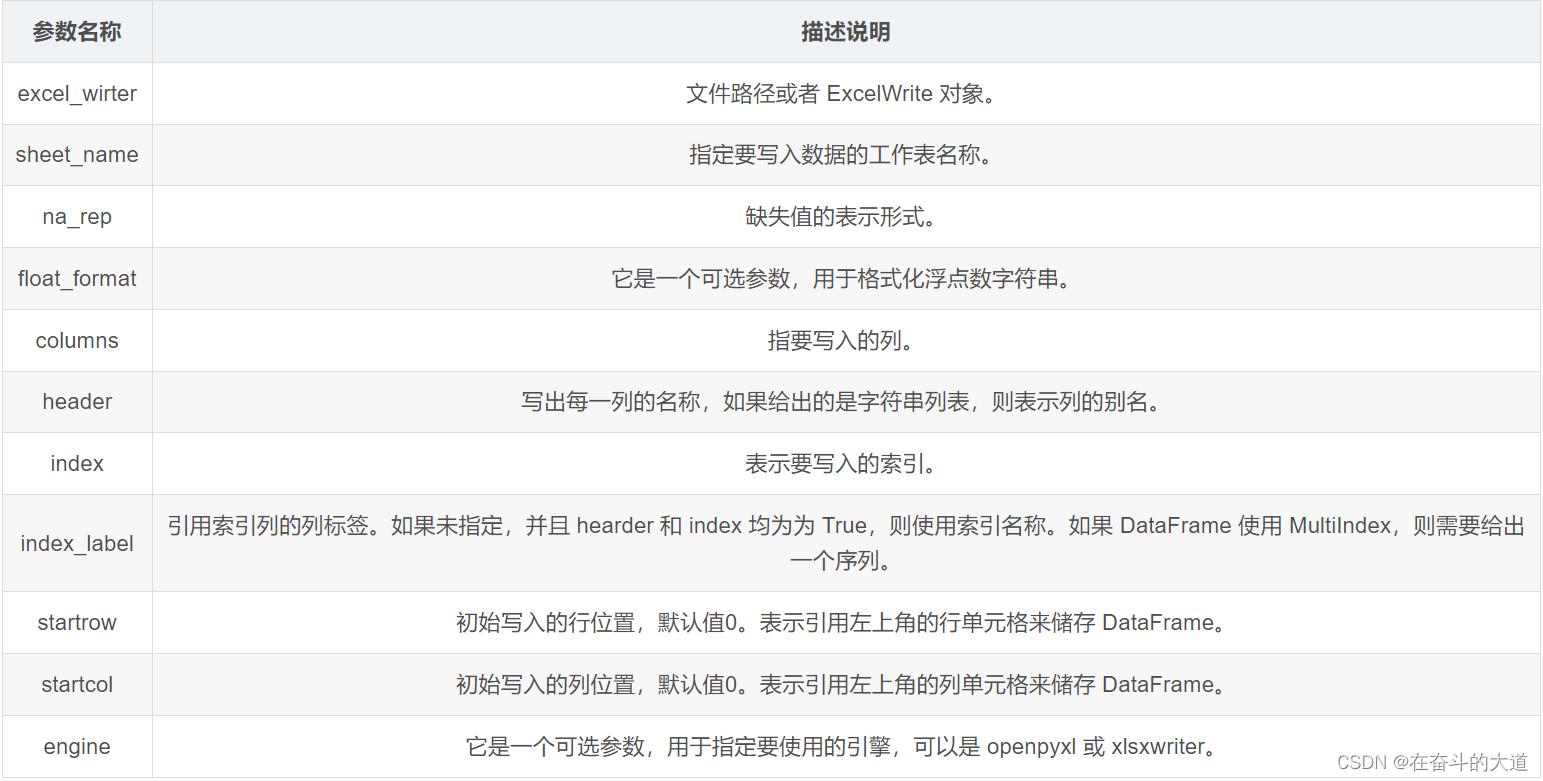
to_excel()
The data in the Dataframe can be written to an Excel file through the to_excel() function.
If you want to write the DataFrame object to an Excel file, you must specify the target file name; if you want to write to multiple worksheets, you need to create an ExcelWriter object with the target file name, and specify the work in turn through the sheet_name parameter The name of the table.
The syntax of to_ecxel() is as follows:
def to_excel(
        self,
        excel_writer,
        sheet_name: str = "Sheet1",
        na_rep: str = "",
        float_format: str | None = None,
        columns: Sequence[Hashable] | None = None,
        header: Sequence[Hashable] | bool_t = True,
        index: bool_t = True,
        index_label: IndexLabel = None,
        startrow: int = 0,
        startcol: int = 0,
        engine: str | None = None,
        merge_cells: bool_t = True,
        encoding: lib.NoDefault = lib.no_default,
        inf_rep: str = "inf",
        verbose: lib.NoDefault = lib.no_default,
        freeze_panes: tuple[int, int] | None = None,
        storage_options: StorageOptions = None,
    ) -> None:
The following table lists the commonly used parameter items of the function, as shown in the following table:
Python function code:
import pandas as pd
import numpy as np

#创建DataFrame数据
info_website = pd.DataFrame({'name': ['菜鸟教程', 'c语言中文网', '传智博客', 'CSDN'],
     'rank': [1, 2, 3, 4],
     'language': ['Java', 'C', 'Python','Python' ],
     'url': ['www.runoob.com', 'c.bianchneg.net', 'www.itcast.com','www.csdn.com' ]})

#创建ExcelWrite对象
writer = pd.ExcelWriter('./excel/content.xlsx')
#DataFrame 写入指定excel 文件
info_website.to_excel(writer)
# 记得执行保存方法
writer.save()
print('输出成功')
Excel results view:
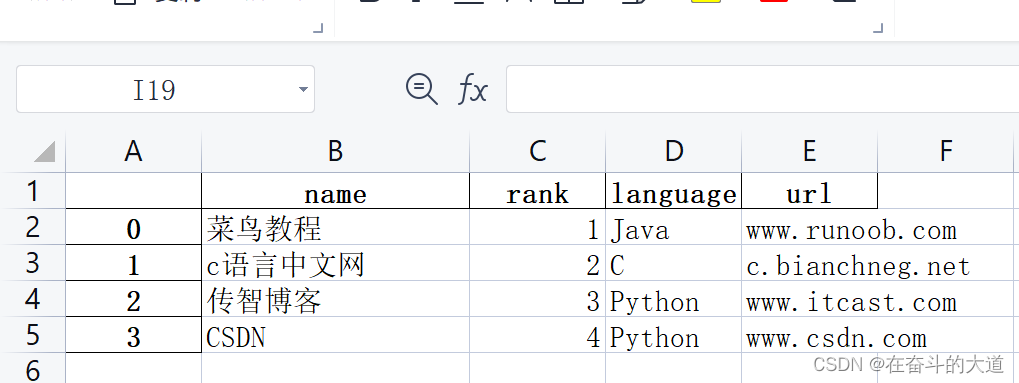
read_excel()
read_excel() method, its syntax is as follows:
def read_excel(
    io,
    # sheet name is str or int -> DataFrame
    sheet_name: str | int = ...,
    header: int | Sequence[int] | None = ...,
    names: list[str] | None = ...,
    index_col: int | Sequence[int] | None = ...,
    usecols: int
    | str
    | Sequence[int]
    | Sequence[str]
    | Callable[[str], bool]
    | None = ...,
    squeeze: bool | None = ...,
    dtype: DtypeArg | None = ...,
    engine: Literal["xlrd", "openpyxl", "odf", "pyxlsb"] | None = ...,
    converters: dict[str, Callable] | dict[int, Callable] | None = ...,
    true_values: Iterable[Hashable] | None = ...,
    false_values: Iterable[Hashable] | None = ...,
    skiprows: Sequence[int] | int | Callable[[int], object] | None = ...,
    nrows: int | None = ...,
    na_values=...,
    keep_default_na: bool = ...,
    na_filter: bool = ...,
    verbose: bool = ...,
    parse_dates: list | dict | bool = ...,
    date_parser: Callable | None = ...,
    thousands: str | None = ...,
    decimal: str = ...,
    comment: str | None = ...,
    skipfooter: int = ...,
    convert_float: bool | None = ...,
    mangle_dupe_cols: bool = ...,
    storage_options: StorageOptions = ...,
) -> DataFrame:
The following table describes the commonly used parameters:
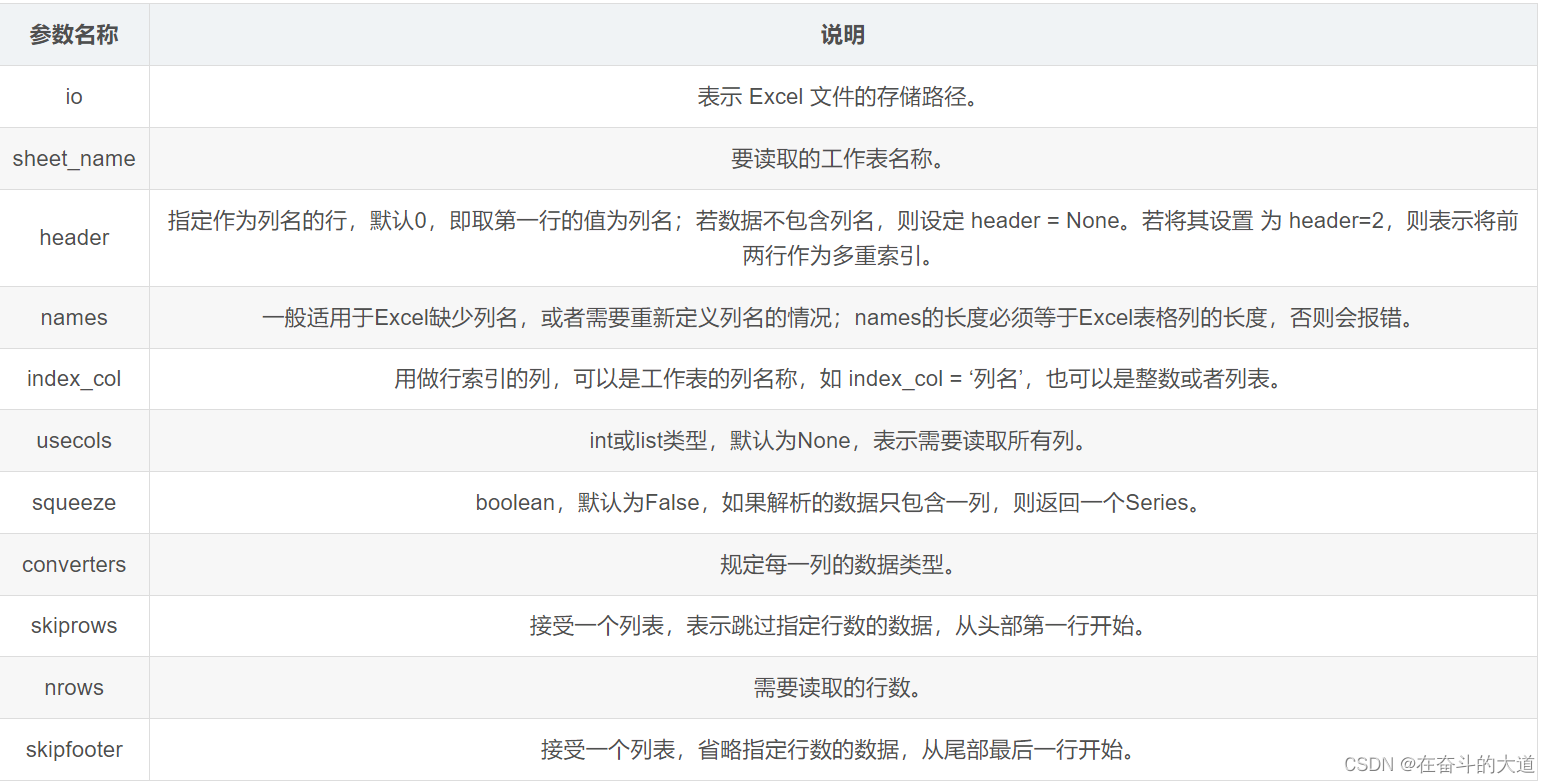
Python function code
#读取excel数据
df = pd.read_excel('./excel/content.xlsx',index_col='name',skiprows=[2])
print(df)

#修改列 名称
df.columns = df.columns.str.replace('url.*', '地址')
print(df)
output result:
e:\py_workspace\conda-demo\pandas-excel-csv-three.py:23: FutureWarning: The default value of regex will change from True to False in a future version.
  df.columns = df.columns.str.replace('url.*', '地址')
      Unnamed: 0  rank language              地址
name
菜鸟教程           0     1     Java  www.runoob.com
传智博客           2     3   Python  www.itcast.com
CSDN           3     4   Python    www.csdn.com
This concludes the quick introduction to Pandas.
Supplementary references: