Table of contents
2. Detailed introduction of pandas.merge() function
3. Noun explanation "data alignment" (from chatGPT3.5)
4. This article will give two examples of data alignment
1) Align dataframe type data with dataframe type data (align NAME column);
Two sets of data sets before data alignment:
The data set after data alignment (aligned by pandas.merge() function):
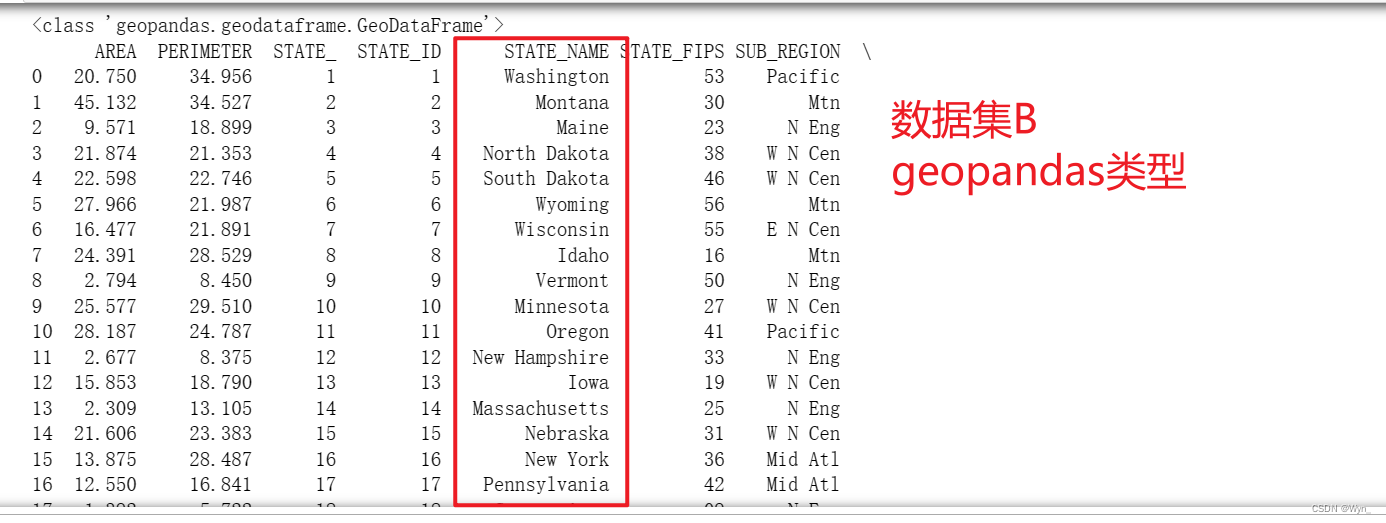
2) dataframe type data and geopandas type data alignment (align STATE_NAME field);
After data alignment, a set of geopandas type data is obtained:
0. Environment
windows + jupyter notebook + python + pandas
1. Applicable scenarios
I encountered this requirement in the process of visualizing geographic data. I have a dataset of type dataframe (dataset A) and a dataset of type geopandas (dataset B). I need to use these two data to draw [ Zonal Statistical Map], the title requirement is "Using PySal data to create a zonal statistical path in the United States, which describes the per capita income of each state in the United States in 2009." But in the process of using the data directly, I found two data sets The data cannot be aligned (the concept of data alignment is described in detail in the next paragraph). If the data is not aligned, the visualization result will be wrong . For example, there is a column named NAME in both data sets, but the order of the NAME column in the two data sets is different, the order of the NAME column in dataset A may be: [name1, name3, name2], the order of the NAME column in dataset B may be: [name3, name1, name2], and the data of other corresponding rows must also follow At this time, I cannot directly use the two data sets for data visualization, which may insert data that does not belong to name1 into name1, resulting in an error in the final visualization result. In order to solve this problem, I use data alignment (using the merge() method) to align two datasets into one dataset (geopandas type)
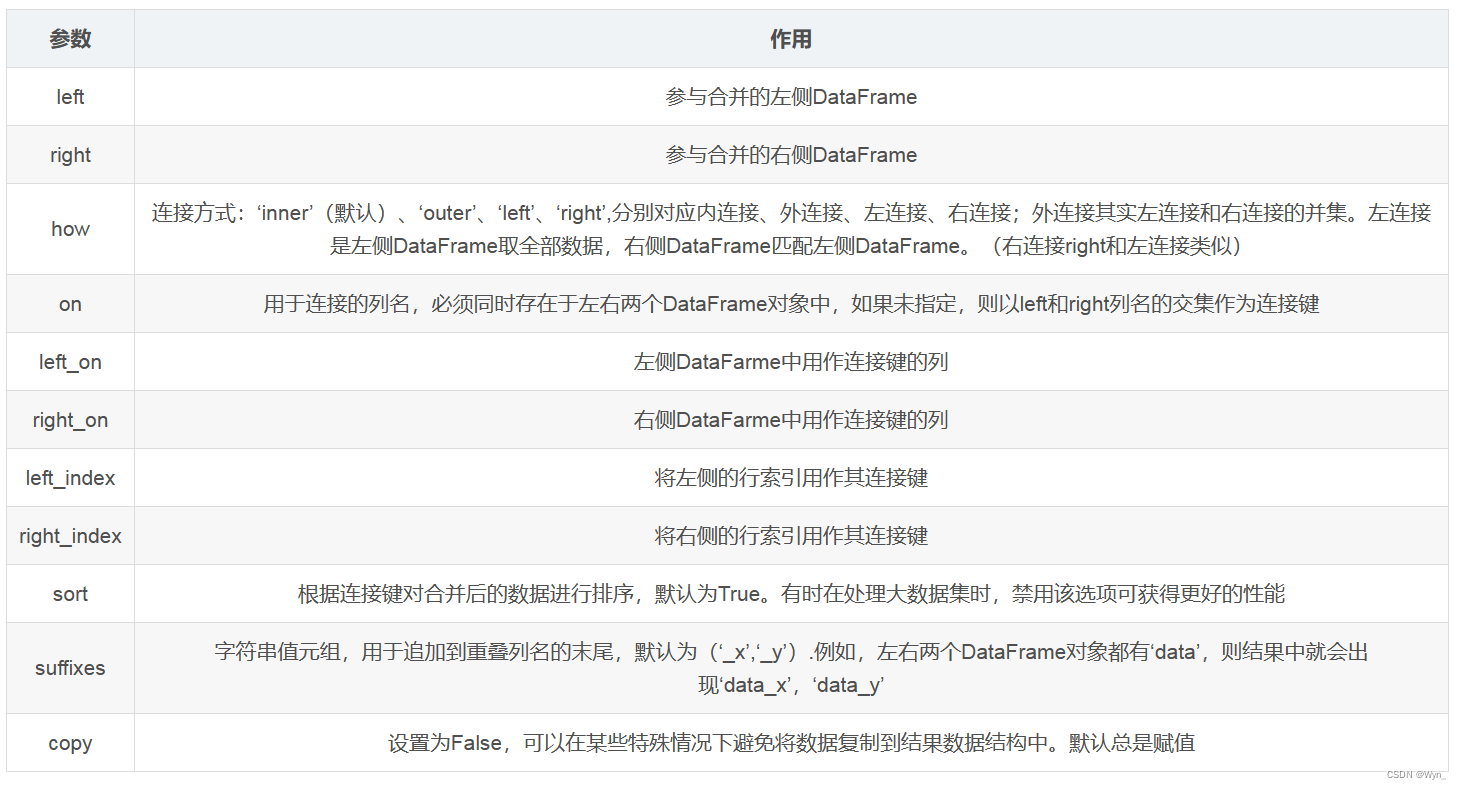
2. Detailed introduction of pandas.merge() function
merge(left, right, how=‘inner’, on=None, left_on=None, right_on=None, left_index=False, right_index=False, sort=False, suffixes=(’_x’, ‘_y’), copy=True, indicator=False, validate=None)
The official document introduces the role of merge(): Merge DataFrame or named Series with database-style connection
3. Noun explanation "data alignment" (from chatGPT3.5)
Data alignment is an important data processing technique, which can ensure that data matches on the same index or column name, thereby simplifying data processing operations and improving the accuracy and reliability of data analysis.
Data alignment refers to the operation of matching and aligning data of different data sets or different indexes according to the same index during data processing . The purpose of this is to facilitate operations such as data comparison, merging, and calculation.
When we have multiple datasets or multiple DataFrame objects, they may have different indexes or column names. The process of data alignment can ensure that the data matches in the same position by aligning the index or column name . Doing so helps eliminate mismatches and missing values between data, making data processing more convenient and accurate.
In the process of data alignment, if the indexes or column names of the two data sets do not match exactly, then the alignment will be performed automatically, and the missing values will be filled as missing values (such as NaN or None). In this way, we can ensure that each data point has a corresponding value when performing data operations, avoiding errors or result deviations caused by data inconsistencies.
4. This article will give two examples of data alignment
1) dataframe type data and dataframe type data alignment (alignment NAME column);
-
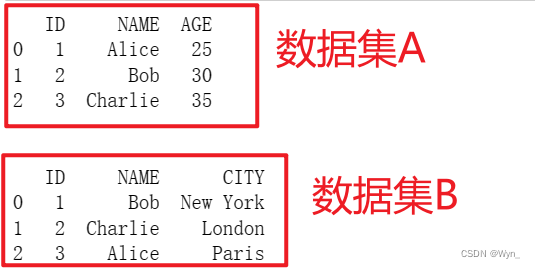
Two sets of data sets before data alignment :
-
The data set after data alignment (aligned by pandas.merge() function):
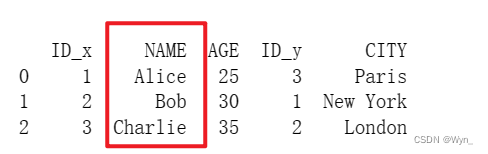
You can see that the two datasets A and B are aligned through the NAME field
-
the code
import pandas as pd

# 创建第一个DataFrame
data1 = {'ID': [1, 2, 3],
         'NAME': ['Alice', 'Bob', 'Charlie'],
         'AGE': [25, 30, 35]}
df1 = pd.DataFrame(data1)
print(df1)
print("\n")

# 创建第二个DataFrame
data2 = {'ID': [1, 2, 3],
         'NAME': ['Bob', 'Charlie', 'Alice'],
         'CITY': ['New York', 'London', 'Paris']}
df2 = pd.DataFrame(data2)
print(df2)
print("\n")


# 使用merge方法对齐两个DataFrame的'NAME'列
merged_df = pd.merge(df1, df2, on='NAME')

# 打印对齐后的DataFrame
print(merged_df)
2) dataframe type data and geopandas type data alignment (align STATE_NAME field);
-
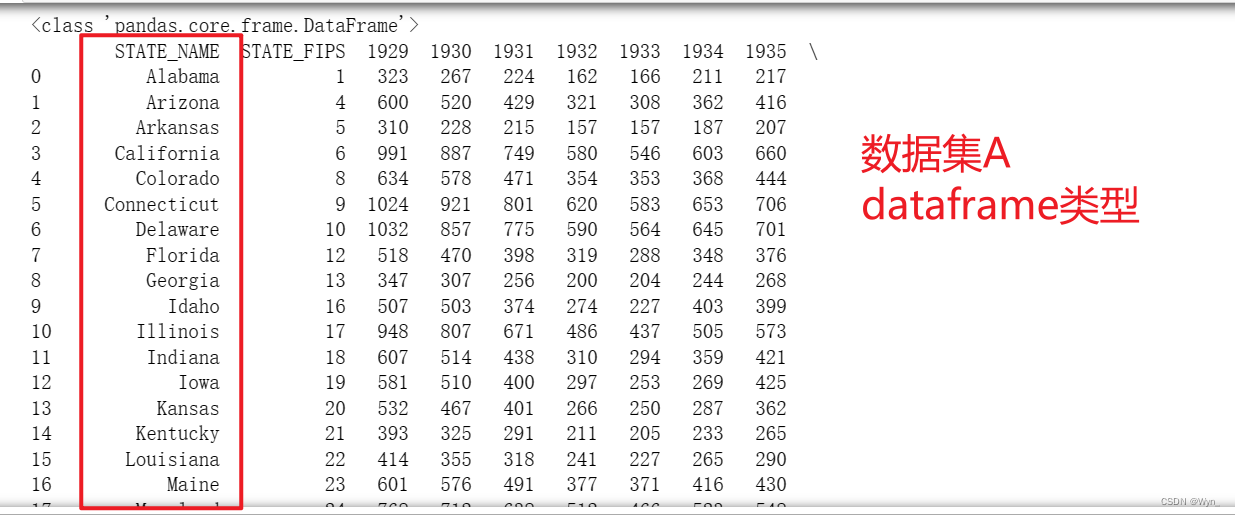
Two sets of data sets before data alignment (both data sets have many rows, only a part of them is intercepted here):
-
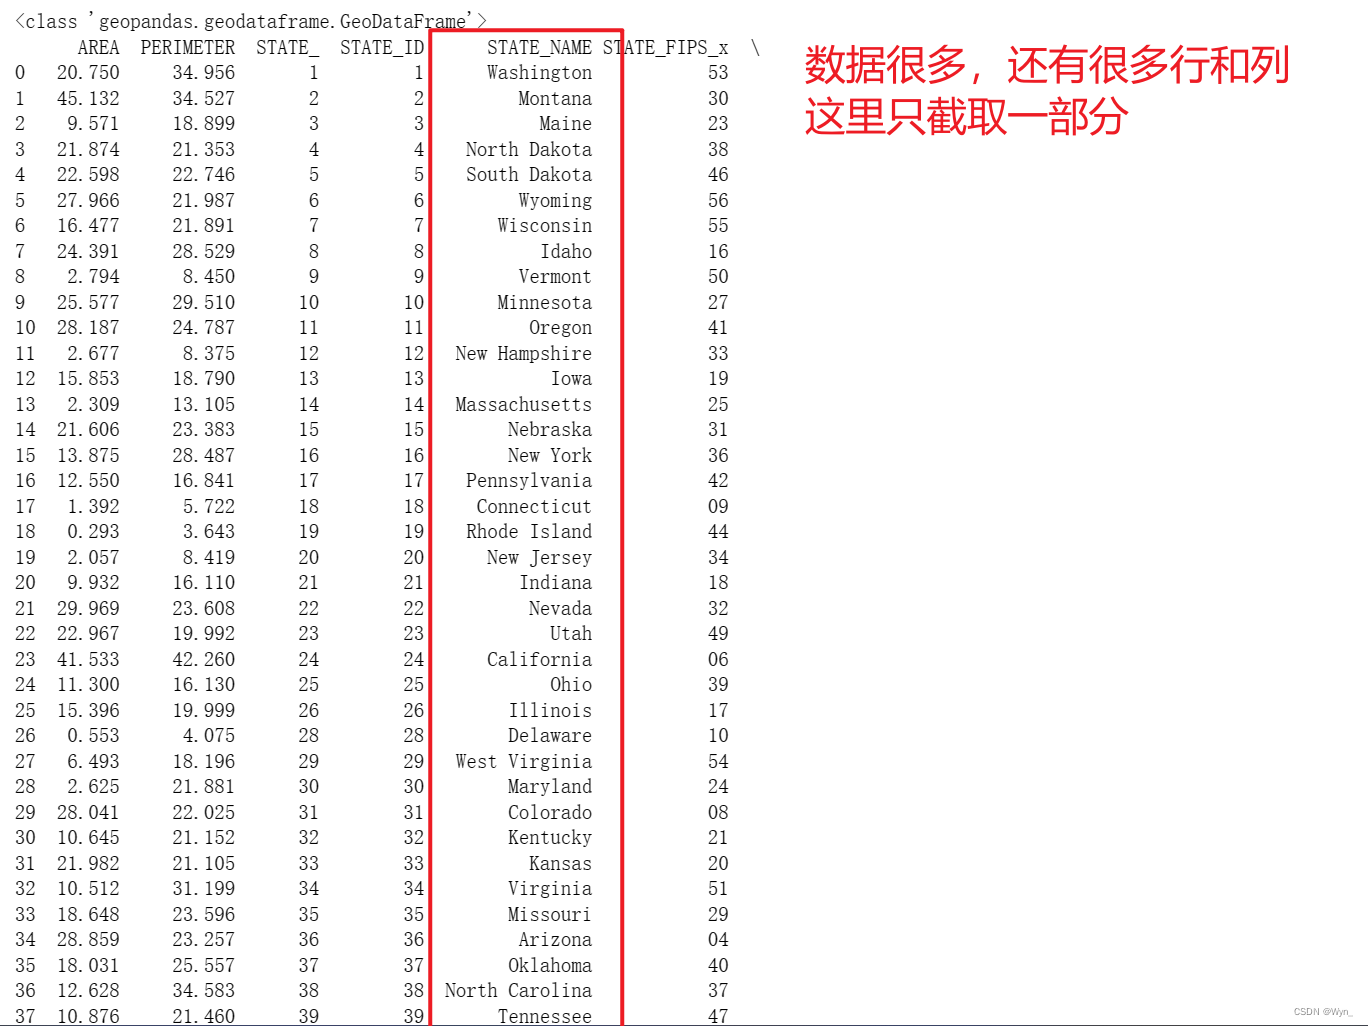
After data alignment, a set of geopandas type data is obtained:
It can be seen that through the STATE_NAME field, the two data sets are combined into a geopandas type data set. Specifically, all the columns of the two data sets are sorted and integrated into one data set according to the STATE_NAME field, and there are many rows and columns. It cannot be displayed on one interface, only a part is intercepted here
-
the code
Note : Before the code runs, you need to install the corresponding modules, such as pysal, geopandas, libpysal, etc., you can use the pip install XXX command to download in [Anaconda prompt]
The specific download process can refer to the blog:
Download the geopandas package
import pysal as ps
import geopandas as gpd
import pandas as pd
import numpy as np
import matplotlib.pyplot as plt
%matplotlib inline

# your code here
from libpysal import examples

#2009年的人均收入数据
income_data  = examples.get_path('usjoin.csv')
#用pandas读数据
usincome = pd.read_csv(income_data)

#重命名dataframe数据(usincome)的Name列
usincome.rename(columns={'Name':'STATE_NAME'}, inplace=True)
# print(type(usincome))
print("对齐前dataframe类型数据:\n")
print(usincome)

#48个州的形状
us_states  = examples.get_path('us48.shp')
us48 = gpd.read_file(us_states )
# print(type(us48))
print("\n对齐前geopandas类型数据:\n")
print(us48)

#数据对齐  STATE_NAME
merged_gdf = us48.merge(usincome, on='STATE_NAME')
# print(type(merged_gdf))
print("\n对齐后geopandas类型数据:\n")
print(merged_gdf)
reference:
(35 messages) Detailed explanation of python pandas.merge() function_Usage of merge function in python_Late whale's blog-CSDN blog pandas data merger one article understand pd.merge() - Zhihu (zhihu.com) (35 messages) Message) Detailed explanation of python pandas.merge() function_Usage of merge function in python_Late whale's blog-CSDN blog
--END--