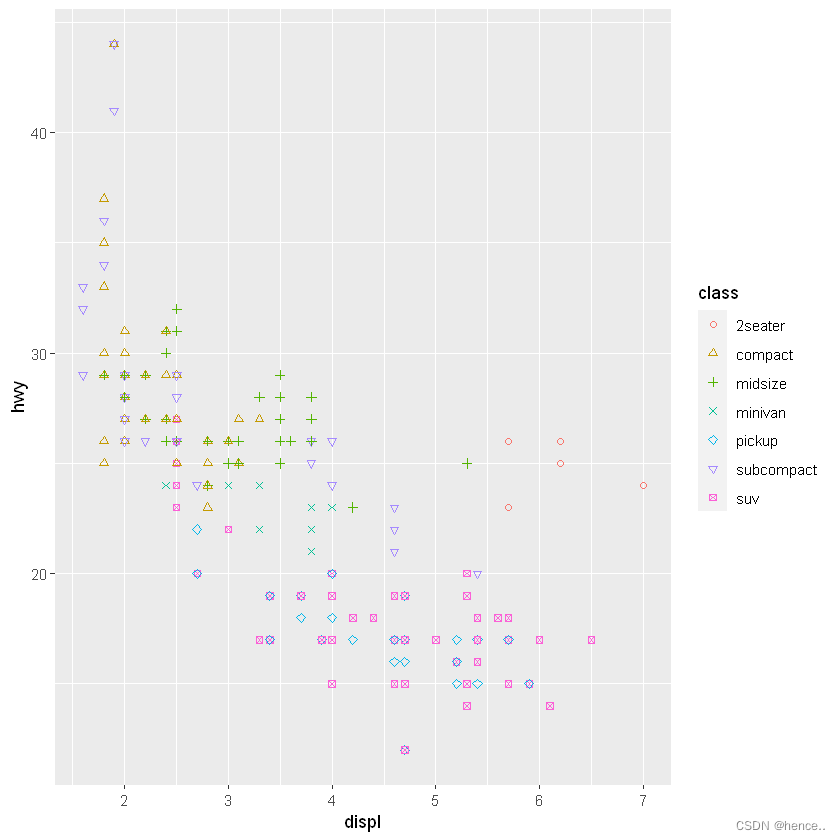
Normal drawing:
library(ggplot2)
ggplot(mpg,aes(displ,hwy))+geom_point(aes(shape=class,color=class))

It can be seen that there is one less shape, the SUV has no shape
, and such a warning will pop up:
Warning message:
“The shape palette can deal with a maximum of 6 discrete values because
more than 6 becomes difficult to discriminate; you have 7. Consider
specifying shapes manually if you must have them.”
Warning message:
“Removed 62 rows containing missing values (geom_point())."
Warning message: "The shape palette can handle up to 6 discrete values, because more than 6 will be difficult to distinguish; you have 7. If you must use shapes, consider specifying manually." Warning message: "Delete Got 62 rows that contained missing values ('geom_point()').
Solution:
There are the following shapes in ggplot: we just need to customize the shapes we need. 
For example, I use 7 shapes 1-7
library(ggplot2)
ggplot(mpg,aes(displ,hwy))+
geom_point(aes(shape=class,color=class))+
   scale_shape_manual(values = c(1:7))

reference article
R language-ggplot custom point shape, line type
What should I do if the shape of the ggplot2 plot point is not enough?