First execute and analyze the most time-consuming link of SQL execution:
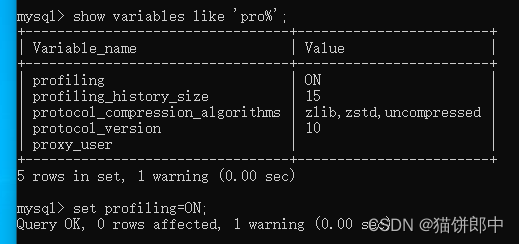
Query the profiling parameter value show variables like 'pro%'; and set set profiling=ON; enable the record of executing SQL:
Execute SQL select * from test_100000 normally; here is the SQL you want to analyze
![]()
Query execution SQL list show profiles;
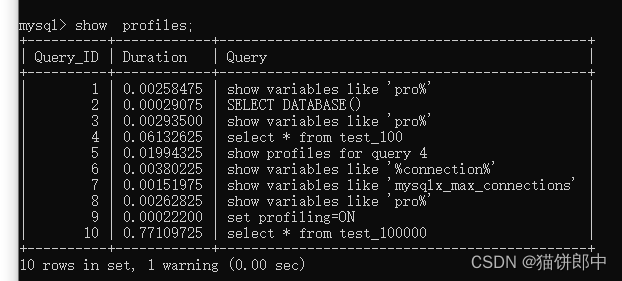
View the detailed process of SQL execution show profile for query 10;
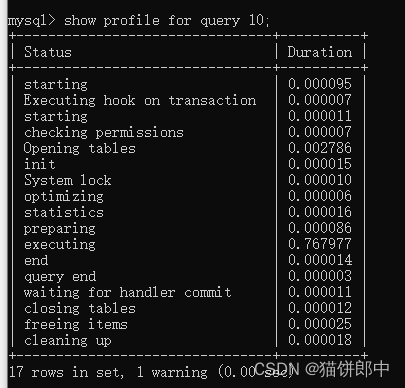
You can see that the time spent on executing is the longest, and you can optimize it from the following aspects:
1. Check whether the index can be created, whether it hits the index, etc. Here, the index has been optimized.
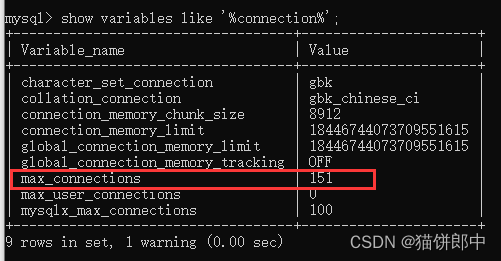
2. Look at the number of connections and set the size.
Java generally uses the druid connection pool to manage database connections. The default maximum number of connections for mysql is 151, which can be adjusted appropriately.
3. Properly increase the buffer pool of mysql. The default is 128MB. According to the size of your own machine environment, you can increase the buffer pool

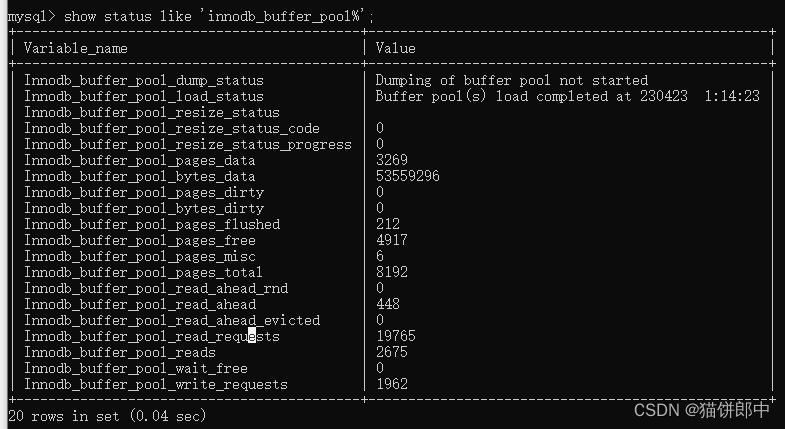
4. Check the cache hit rate,
(1-(Innodb_buffer_pool_reads/Innodb_buffer_pool_read_requests))*100% The larger the value, the higher the hit rate, so the query will be faster. Otherwise, it is necessary to see if the buffer pool can be increased.
show status like 'innodb_buffer_pool%';