Reprint the following article
MySQL open slow query log
MySQL Explain detailed
show profile view SQL execution life cycle
One, start the slow query log
Turning on the slow log is only suitable for small projects, projects that are not online, or emergency situations, because once the slow log query is turned on, it will increase the pressure on the database. Therefore, the background is generally used to write the data operation time into the log file, and the log is cleared regularly every week.
Parameter Description:
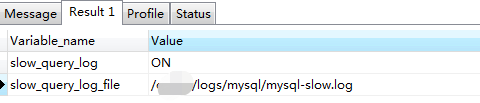
slow_query_log 慢查询开启状态,ON开启,OFF关闭
slow_query_log_file 慢查询日志存放的位置(这个目录需要MySQL的运行帐号的可写权限,一般设置为MySQL的数据存放目录)
long_query_time 查询超过多少秒才记录
Check if slow query has been turned on
show variables like 'slow_query%';
operation result:
show variables like 'long_query_time';
Running result: the

default query is more than 10 seconds before recording
Enable slow query
1. Global variable settings (database restart in this way will all fail and have to be reconfigured)
# 将 slow_query_log 全局变量设置为“ON”状态
set global slow_query_log='ON';
# 设置慢查询日志存放的位置
set global slow_query_log_file='/usr/local/mysql/data/slow.log';
# 设置查询超过1秒就记录(如果有时候用命令不起作用,那么可以关闭再打开)
set global long_query_time=1;
2. Modify the my.cnf configuration file (the server restart will not affect)
Modify the configuration file my.cnf and add it under [mysqld]
slow_query_log = ON
slow_query_log_file = /usr/local/mysql/data/slow.log     //linux
long_query_time = 1
Restart MySQL service
service mysqld restart
Second, analyze slow query sql
explain View an execution plan of these SQL statements, check whether the SQL statement uses an index, and whether a full table scan is performed
explain select * from emp where name = 'Jefabc';
operation result:

| id | Select identifier |
| select_type | Indicates the type of query. |
| table | Table of output result set |
| partitions | Matching partition |
| type | Indicates the connection type of the table |
| possible_keys | Indicates the index that may be used when querying |
| key | Indicates the actual index used |
| key_len | Index field length |
| ref | Comparison of columns and indexes |
| rows | Number of rows scanned (estimated number of rows) |
| filtered | Percentage of rows filtered by table criteria |
| Extra | Description and explanation of implementation |
The type of select_type query is single table query, union query, sub query, etc.
| SIMPLE | Simple SELECT, without using UNION or subqueries, etc. |
| PRIMARY | The outermost query in the subquery. If the query contains any complex subparts, the outermost select is marked as PRIMARY |
| UNION | The second or subsequent SELECT statement in UNION |
| DEPENDENT UNION | The second or subsequent SELECT statement in UNION depends on the query outside |
| UNION RESULT | The result of UNION, the second select in the union statement starts all selects |
| SUBQUERY | The first SELECT in the subquery, the result does not depend on the external query |
| DEPENDENT SUBQUERY | The first SELECT in the subquery depends on the external query |
| DERIVED | Subqueries in SELECT and FROM clauses of derived tables |
| UNCACHEABLE SUBQUERY | The result of a subquery cannot be cached, the first line of the outer link must be re-evaluated |
type access to the table
Sort from best to worst: system> const> eq_ref> ref> ref_or_null> index_merge> unique_subquery> index_subquery> range> index> all.
| ALL | Traverse the entire table to find matching rows |
| index | Traverse the index tree |
| range | Retrieve only rows in a given range, use an index to select rows |
| ref | Indicates the connection matching condition of the above table, that is, which columns or constants are used to find the value on the index column |
| eq_ref | Similar to ref, the difference is that the index used is the unique index primary key or unique |
| const、system | When MySQL optimizes a certain part of the query and converts it to a constant, use these types of access. If the primary key is placed in the where list, MySQL can convert the query into a constant. System is a special case of the const type. When the query table has only one row, use system |
| NULL | MySQL decomposes the statement during the optimization process, and does not even need to access the table or index during execution. For example, selecting the minimum value from an index column can be done through a separate index search. |
possible_keys possible indexes
Indicate which index MySQL can use to find records in the table. If there is an index on the field involved in the query, the index will be listed, but it may not be used by the query (the index that can be used by the query, if there is no index, it will display null )
Key actually used index
The key column shows the key (index) that MySQL actually decides to use, which must be included in possible_keys
If no index is selected, the key is NULL. To force MySQL to use or ignore the index in the possible_keys column, use FORCE INDEX, USE INDEX, or IGNORE INDEX in the query.
Three, Show Profile for sql analysis
1. What is Show Profile
It is a SQL tuning method provided by mysql to analyze the resource consumption of SQL execution in the current session, and is more granular than explain. The default closed state, and save the results of the last 15 runs.
2. Check whether the parameter is turned on and how to turn it on
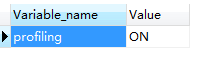
1. Check whether it is turned on
show VARIABLES like 'profiling';
Operation result:
2. Open Profile, which is closed by default, now open.
set profiling = 1;
3. Use Profile
1. Slow SQL while executing
select * from emp group by id%10;
select * from emp group by id%20 order by 5;
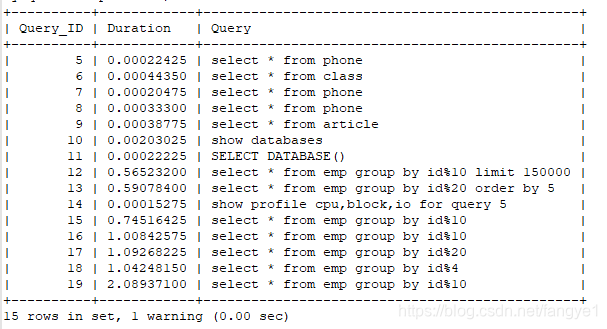
2. Execute sql
show profiles;
operation result:
3. Diagnose SQL and view CUP usage, format: show profile cpu,block io for query [Query_ID]
show profile cpu,block io for query 12
Running results
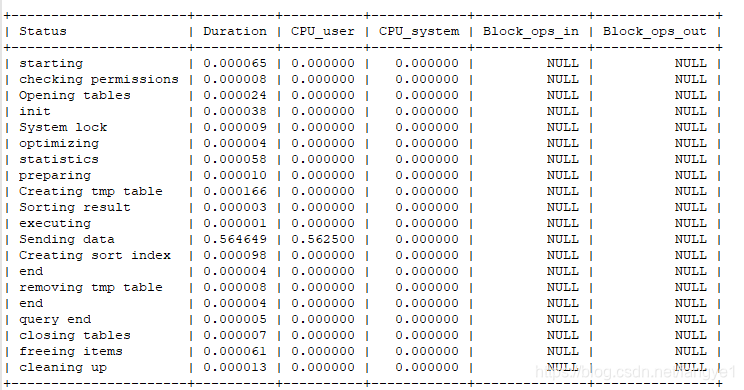
Only cpu and block io are listed here. Of course, the diagnosis types are more than these, the commonly used cpu and block io
ALL 显示所有的开销信息
BLOCK IO 显示块IO相关开销
CONTEXT SWITCHES 上下文切换相关开销
CPU  显示CPU相关开销信息
IPC  显示发送和接收相关开销信息
MEMORY 显示内存相关开销信息
PAGE FAULTS 显示页面错误相关开销
SOURCE  显示和Source_function,Source_file,Source_line相关的开销信息
SWAPS   显示交换次数相关开销的信息
The following 4 occurrences of Status will cause big problems:
converting HEAP to MyISAM :查询结果太大,内存都不够用了往磁盘上搬
Creating tmp table : 创建临时表,拷贝数据到临时表,用完再删除
Copy to tmp table on disk : 把内存中临时表赋值到磁盘,很危险
locked   :存在锁
As follows:
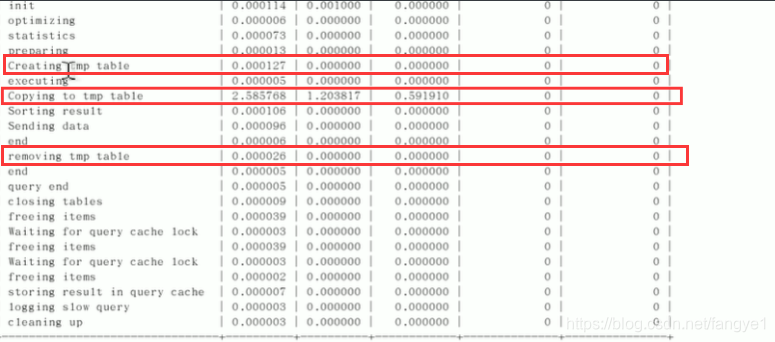
Creating tmp table, Copy to tmp table, removing tmp table, of course, will be slow