Article directory
Some Principles of System Design
Hayne's law
- The occurrence of accidents is the result of accumulation of quantity
- No matter how good the technology, the perfect regulations, and the actual operation level, it cannot replace the quality and sense of responsibility of the people themselves.
Murphy's Law
- Nothing is as simple as it seems
- Everything will take longer than you expect
- things can go wrong
- If you're worried about something happening, it's more likely to happen
High availability design in software architecture
What is high availability
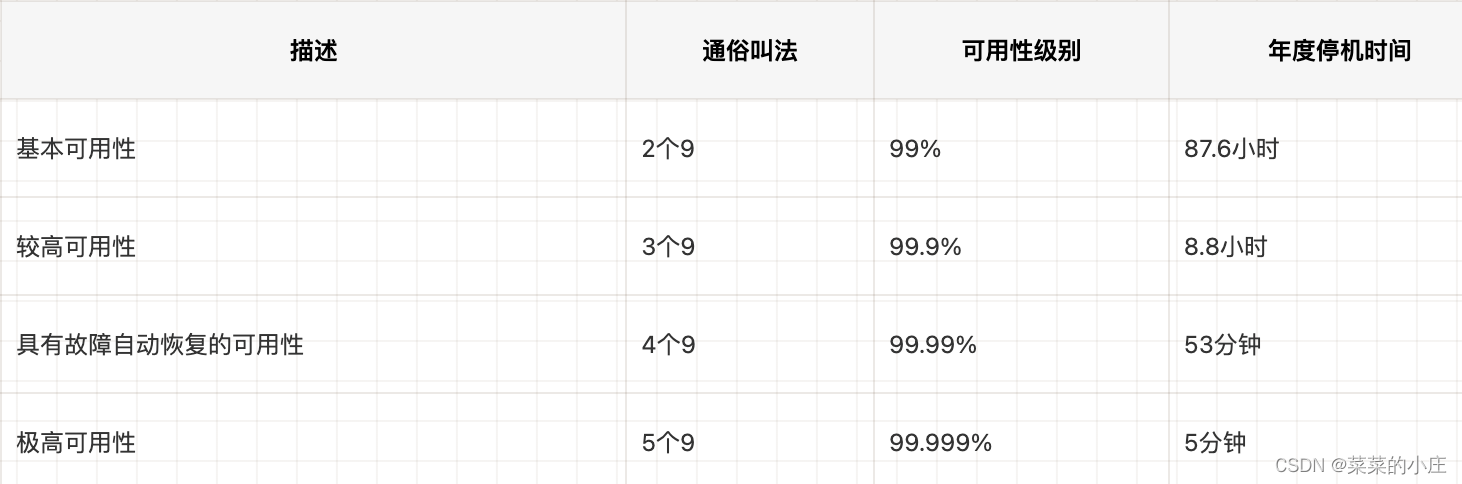
First of all, let's understand how to define the availability of a system. The industry often uses N nines to define the availability of a system. For example, the availability is 99.99%. This 99.99% means that the system is available 99.99% of the time within a year. What about 99.99% system downtime? There are 365 days in a year, 24 hours in a day, 60 minutes in an hour, and 60 seconds in a minute, so the unavailable time of a system with 99.99% availability is approximately 52.56 minutes in a year (365 24 60*(1-0.9999 ) ) .
High availability is a system with an availability index greater than or equal to 4 nines.
Measurement and assessment of faults
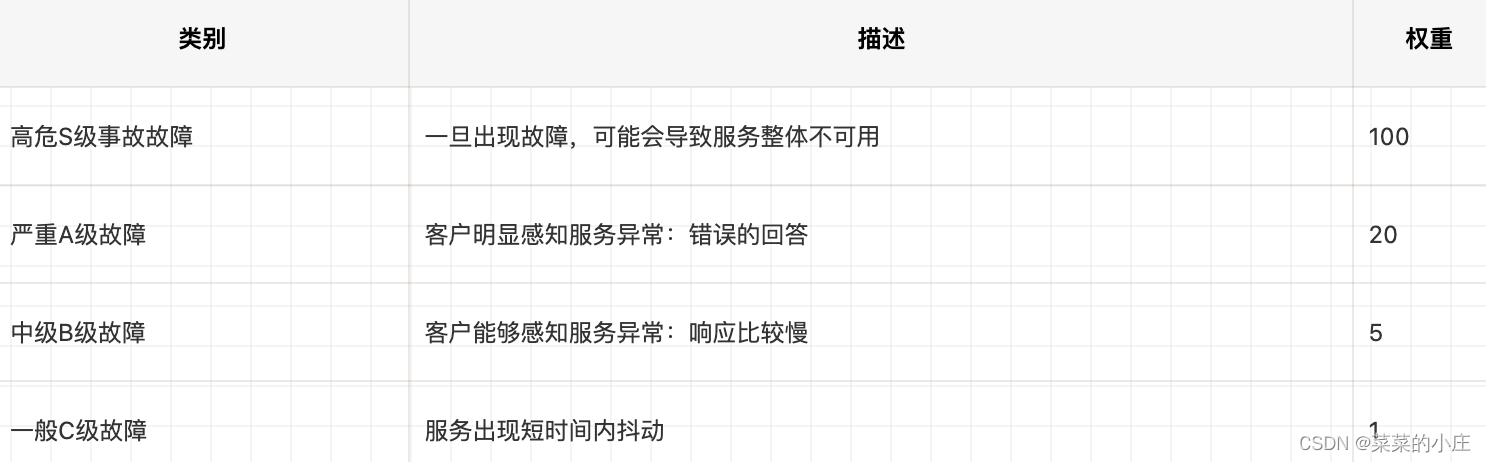
Generally, SRE and the technical leaders of various business parties will negotiate and output a unified standard for this evaluation standard. A summary will be made after each level of failure occurs, as the technical output at the end of the year.
Specific solutions to high availability issues
- Cluster deployment
- load balancing
- fuse
- Limiting
- downgrade
- isolation
- Timeouts and retries
- rollback
- Pressure test and plan
Cluster deployment
Since the single-point deployment is directly unavailable once the service is down, cluster deployment is required to avoid single-point failures.
load balancing
Load balancing implementation
internal service
Ensure that the service cluster can fail over. When the service is down, the load balancing will be transferred to achieve high availability. For internally invoked services, load balancing is provided through RPC.
external service
For external services called, external services are required to ensure their own high-availability deployment. At the same time, the caller needs to retry (switch to other nodes when the requested node is unavailable) and monitor the unavailability and abnormality of third-party services.
database
The database in the service needs to ensure high-availability deployment, and the incompatibility of the high-availability scheme adopted, such as the temporary unavailability of some high-availability schemes during failover, this situation also needs to be taken into account. Finally, the database needs to be monitored (abnormal, slow request, CPU, disk, memory, thread pool, IO)
load balancing algorithm
round-robin
Polling, the default load balancing algorithm, forwards the request to the upstream server in a polling manner, and weight-based polling can be realized with weight configuration
ip_hash
Perform load balancing based on customer IP, and share the same IP to load balance to the same upstream server
upstream backend{
	ip_hash;
	server 192.168.1.101:8080 weight=1;
	server 192.168.1.102:8080 weight=2;
}
hash key
Hash a key or use a consistent hash algorithm for load balancing.
The problem with the Hash algorithm is that if a server is added or deleted, many keys will be rebalanced to different servers, causing back-end problems.
If a consistent hashing algorithm is used, when adding/deleting a server, only a few keys will be rebalanced to different servers.
retry on failure
upstream backend{
	server 192.168.1.101:8080 max_fails=2 fail_timeout=10s weight=1;
	server 192.168.1.102:8080 max_fails=2 fail_timeout=10s weight=2;
}
If there are max_fails failures within fail_timeout seconds, the upstream server is considered unavailable | not alive, and the upstream server will be removed. After fail_timeout seconds, the server will be added to the survival list again for retrying.
health examination
Always pay attention to the health status of the service. If the service is unavailable, the request will be forwarded to other surviving services to improve availability.
Nginx can integrate the nginx_upstream_check_module module for active health checks. Supports TCP heartbeat and HTTP heartbeat.
TCP
upstream backend{
	server 192.168.1.101:8080 weight=1;
	server 192.168.1.102:8080 weight=2;
	check interval=3000 rise=1 fall=3 timeout=2000 type=tcp;
}
- interval: The detection interval time, which is configured to detect every 3s.
- fall: After how many times the detection fails, the upstream server is marked as not alive.
- rise: After how many times the detection is successful, the upstream server is marked as alive and can process the request.
HTTP
upstream backend{
	server 192.168.1.101:8080 weight=1;
	server 192.168.1.102:8080 weight=2;
	check interval=3000 rise=1 fall=3 timeout=2000 type=tcp;
	check_http_send ”HEAD /status HTTP/1.0\r\n\r\n“
	check_http_expect_alive http_2xx http_3xx;
}
- check_http_send: That is, the content of the HTTP request sent during the check.
- check_http_expect_alive: When the upstream server returns a matching response status code, the upstream server is considered alive. Do not set the check time too short to prevent too many heartbeat check packets from affecting the upstream server.
So we can see that some factories have the [Health Check] function on their container platforms, which is a transformation based on nginx. The user needs to configure the path, frequency, waiting time for the first detection, timeout time for each detection, port, and detection failure threshold of the health check.
isolation
thread isolation
Thread isolation refers to thread pool isolation, a problem with a request will not affect other thread pools.
process isolation
Split the project into sub-projects one by one, physically isolated from each other (deployed on different machines).
cluster isolation
The clusters are isolated so that they do not affect each other.
Computer room isolation
Deploy in different computer rooms, Hangzhou computer room; Beijing computer room; Shanghai computer room, because there may be network problems in a certain computer room, this can prevent the entire system from being unusable due to network problems in a certain computer room.
read-write isolation
Most Internet projects read more and write less, separate read and write, expand the ability to read, improve performance, and improve usability. The common mysql read and write separation is this principle. However, when using read-write separation, data delays and transaction failures must also be considered.
Motion and static isolation
Put static resources into nginx and CDN to achieve dynamic and static isolation and prevent pages from loading a large number of static resources.
hotspot isolation
-
Separate hotspot businesses into systems or services for isolation, such as flash sales and snap-ups.
-
Read hotspots generally use multi-level caching. At the same time, cache and database consistency issues need to be considered.
-
Write hotspots generally use the method of caching and message queue. At the same time, it is necessary to consider whether the data delay problem will affect the business.
Limiting
Current limiting is mainly for scenarios with sudden traffic, such as flash sales and panic buying. If there is no flow limit, the service may be overwhelmed when there is a sudden large flow.
Current limiting algorithm
Leaky Bucket Algorithm
The idea of the leaky bucket algorithm is very simple. Water (requests) enters the leaky bucket first, and the leaky bucket discharges water at a certain speed. When the water flows in too fast, it will overflow directly. It can be seen that the leaky bucket algorithm can forcibly limit the data transmission rate.
token bucket algorithm
The principle of the token bucket algorithm is that the system will put tokens into the bucket at a constant speed, and if the request needs to be processed, it needs to get a token from the bucket first, when there is no token in the bucket, then Denial of service.
nginx current limiting
Nginx access layer current limiting can use two modules that come with Nginx:
-
Connection number current limit module ngx_http_limit_conn_module
-
Request current limiting module ngx_http_limit_req_module implemented by leaky bucket algorithm
ngx_http_limit_conn_module
Limit the total number of network connections corresponding to a key
You can limit the total number of connections in the IP dimension according to IP, or limit the total number of connections in a certain domain name according to the service domain name.
http{
	limit_conn_zone $binary_remote_addr zone=addr:10m;
	limit_conn_log_level error;
	limit_conn_status 503;
    ...
    server{
		location /limit{
			limit_conn addr 1;
		}
    }
    ...
}
-
limit_conn: To configure the shared memory area for storing keys and counters and the maximum number of connections for the specified key. The maximum number of connections specified here is 1, which means that Nginx can process at most 1 connection concurrently.
-
limit_conn_zone: Used to configure the current limit key and the size of the shared memory area for storing the information corresponding to the key. The key here is binaryremoteaddr", which means the IP address. You can also use binary_remote_addr", which means the IP address. You can also use binaryremoteaddr", which means the IP address. You can also use server_name as the key to limit the maximum number of connections at the domain name level. .
-
limit_conn_status: Configure the status code returned after being limited, and return 503 by default.
-
limit_conn_log_level: Configure the log level after the current limit is recorded, the default error level.
ngx_http_limit_req_module
Leaky bucket algorithm implementation, used to limit the request corresponding to the specified key, for example, limit the request rate according to the IP dimension. The configuration example is as follows
limit_conn_log_level error;
limit_conn_status 503;
...
server{
	location /limit{
		limit_req zone=one burst=5 nodelay;
    }
}
-
limit_req: Configure current limiting area, bucket capacity (burst capacity, default is 0), whether to delay mode (default delay).
-
limit_req_zone: Configure the current limiting key, the size of the shared memory area for storing the information corresponding to the key, and the fixed request rate. The key specified here is "$binary_remote_addr", indicating the IP address. The fixed request rate is configured using the rate parameter, which supports 10r/s and 60r/m, that is, 10 requests per second and 60 requests per minute. However, it will eventually be converted to a fixed request rate per second (10r/s is processing a request every 100 milliseconds, and 60r/m is processing a request every 1000 milliseconds).
-
limit_conn_status: Configure the status code returned after being limited, and return 503 by default.
-
limit_conn_log_level: Configure the log level after the record is limited. The default level is error.
Tomcat current limiting
For an application system, there must be a limit on the number of concurrency/requests, that is, there is always a TPS/QPS threshold, if the threshold is exceeded, the system will not respond to user requests or respond very slowly, so we'd better overload protection to prevent a flood of requests from overwhelming the system. For the configuration of these parameters, a good data can only be obtained after a stress test, and every time a major function is launched, it needs to be tested again to see if the parameters need to be adjusted. This is not a simple matter.
<Connector port="8080" protocol="HTTP/1.1"
	connectionTimeout="20000"
	redirectPort="8443" maxThreads="800" maxConnections="2000" acceptCount="1000"/>
-
acceptCount: waiting queue, if Tomcat's threads are busy responding, the new connection will enter the queue queue, if it exceeds the queue size, the connection will be rejected; the default value is 100
-
maxConnections: The instantaneous maximum number of connections that can be created, and those that exceed will be queued;
-
maxThreads: The maximum number of threads that Tomcat can start to process requests, that is, the number of tasks processed at the same time. The default value is 200. If the request processing volume is always far greater than the maximum number of threads, it will cause slow response or even freeze.
Interface current limiting
The current limit of the interface is mainly to limit the current of some core and high QPS interfaces, and limit the request frequency of a certain interface, so as to protect the entire service from being overwhelmed. You can set the QPS of each instance interface or the sum of all instances.
downgrade
When the traffic increases sharply, the service has problems (such as long response time or no response), or non-core services affect the performance of the core process, it is still necessary to ensure that the service is still available, even if it is damaged. The system can perform automatic downgrade based on some key data, or configure switches to achieve manual downgrade. The ultimate goal of downgrading is to keep core services available, even if lossy.
Downgrade plan
Before downgrading, it is necessary to sort out the system to determine whether the system can be kept safe, so as to sort out which ones can be downgraded and which ones cannot.
-
General: For example, if some services occasionally time out due to network jitter or the service is going online, they can be automatically downgraded.
-
Warning: The success rate of some services fluctuates within a period of time (for example, between 95 and 100%), which can be downgraded automatically or manually, and an alarm will be sent.
-
Error: For example, the availability rate is lower than 90%, or the database connection pool is used up, or the traffic suddenly increases to the maximum threshold that the system can bear. At this time, it can be automatically downgraded or manually downgraded according to the situation.
-
Serious errors: For example, data errors occur due to special reasons. At this time, an emergency manual downgrade is required.
The downgrade can be divided into automatic switch downgrade and manual switch downgrade according to whether it is automatic or not.
Degradation can be divided into functions: read service downgrade and write service downgrade.
Downgrade can be divided into: multi-level downgrade according to the system level.
The function of downgrading is mainly considered from the server-side link, that is, to sort out where the downgrade needs to be done according to the service call link accessed by the user.
page downgrade
During large-scale promotions or snap-up activities, some pages occupy some scarce service resources, and can be completely downgraded in an emergency.
page fragment downgrade
For example, part of the merchant on the product details page needs to be downgraded due to data errors.
Page asynchronous request downgrade
For example, there are requests for asynchronous loading such as recommendation information/delivery to, etc. on the product details page. If the response to these information is slow or there is a problem with the backend service, you can downgrade.
Service function downgrade
For example, when rendering a product details page, it is necessary to call some less important services (related categories, best-selling lists, etc.), and these services are not obtained directly under abnormal circumstances, that is, they can be downgraded.
read downgrade
For example, in the multi-level cache mode, if there is a problem with the backend service, it can be downgraded to a read-only cache. This method is suitable for scenarios that do not require high read consistency.
write downgrade
For example, in flash sales, we can only update the Cache, and then asynchronously deduct the inventory to the DB to ensure the final consistency. At this time, the DB can be downgraded to the Cache.
automatic downgrade
When the number of errors in the service reaches the threshold (99.99%), the service will be downgraded and a warning will be issued.
fuse
The fuse mechanism is also very important. The fuse mechanism means that the system automatically collects the resource usage and performance indicators of the dependent services. When the dependent services are unavailable or the number of call failures reaches a certain threshold, it will fail quickly, allowing the current system to immediately switch to other backup services. The more commonly used flow control and circuit breaker degradation frameworks are Netflix's Hystrix and Alibaba's Sentinel.
Timeouts and retries
Once the user's request is not responded to for a certain period of time, an exception is thrown. This is very important. Many online system failures are caused by the lack of timeout settings or incorrect timeout settings. When we read third-party services, it is especially suitable for setting timeout and retry mechanisms. Failure to set a timeout may result in slow request response, or even lead to request accumulation and make the system unable to process requests. The number of retries is generally set to 3 times. It is not beneficial to retry multiple times, but it will increase the pressure on the server (it is not suitable to use the failure retry mechanism in some scenarios, because repeated requests may occur, and the server does not do power. Dirty data will be generated after processing). Common retries are as follows:
-
Proxy layer timeout and retry: nginx
-
web container timeout and retry
-
Middleware | Timeouts and retries between services
-
Database connection timeout and retry
-
nosql timeout and retry
-
Business timeout and retry
-
Front-end browser ajax request timeout and retry
Pressure test and plan
System pressure test
Stress testing generally refers to performance stress testing, which is used to evaluate the stability and performance of the system, and evaluate the system capacity through the stress testing data, so as to decide whether to expand or shrink the capacity.
Offline pressure test
Through a certain interface (such as query inventory interface) or a certain component (such as database connection pool) of JMeter, Apache ab pressure measurement system, and then perform tuning (such as adjusting JVM parameters, optimizing code), to achieve the performance of a single interface or component Best performance.
The environment of offline stress testing (such as server, network, data volume, etc.) is completely different from that of online stress testing. The degree of simulation is not high, and it is difficult to perform full-link stress testing.Suitable for component-level pressure testing, the data can only be used as a reference.
Online pressure test
There are many ways of online stress testing,According to read and write, it is divided into read pressure test, write pressure test and mixed pressure test,According to the degree of data simulation, it is divided into simulation pressure test and drainage pressure test,According to whether to provide services to users, it is divided into isolated cluster pressure test and online cluster pressure test。
Read pressure measurement refers to the read traffic of the pressure measurement system, for example, the pressure measurement service for commodity prices. Write pressure test is to test the write traffic of the system, such as placing an order. When writing a stress test, pay attention to separating the data written in the stress test from the real data, and delete the stress test data after the stress test is completed. Only reading or writing pressure testing can sometimes not find system bottlenecks, because sometimes reading and writing will affect each other. Therefore, mixed pressure testing is required in this case.
The simulated pressure test is a system pressure test through a simulated request. The data of the simulated request can be constructed using a program, artificially constructed (such as preparing some users and products in advance), or using Nginx to access logs. If the amount of data for the pressure test is limited, it will Form request hotspots. A better way is to consider drainage pressure testing, such as using TCPCopy to copy; you can also consider using traffic copy to copy online traffic, and then construct the same environment (hardware, data, examples, etc.) It is very complicated to use the copied traffic to test the test environment, and it requires a separate pressure testing platform to support it.
System Optimization
After getting the stress test report, the report will be analyzed next, and then some targeted optimizations will be carried out, such as hardware upgrade, system expansion, parameter tuning, code optimization (such as changing code synchronously to asynchronous), architecture optimization (such as adding cache, read-write separation, historical data archiving), etc.
Do not reuse other people's cases directly, but make reasonable adjustments to your own cases according to the stress test results.
When performing system optimization, it is necessary to conduct a code walkthrough to find unreasonable parameter configurations, such as timeout time, downgrading strategy, and cache time. Perform slow query troubleshooting during system stress testing, including Redis, MySQL, etc., and solve slow query problems by optimizing queries.
In terms of application system expansion, you can evaluate whether expansion is needed and how many times it needs to be expanded based on last year’s traffic, communication and promotion efforts with operating business parties, and recent traffic. For example, if GMV is expected to increase by 100%, then you can consider expanding 2 ~3 times capacity.
emergency plan
After the system pressure test, some system bottlenecks will be found. After the system is optimized, the system throughput will be improved and the response time will be reduced. The system availability after the disaster recovery can be guaranteed, but there will still be some risks, such as network jitter, and a certain machine is overloaded. High, a certain service slows down, the database Load value is too high, etc. In order to prevent system avalanches due to these problems, it is necessary to formulate emergency plans for these situations, so that in case of emergencies, there are corresponding measures to solve these problems.
The emergency plan can be carried out according to the following steps: firstly, system classification, then full link analysis, monitoring and alarm configuration, and finally an emergency plan.
monitor
First of all, this part does not belong to the high-availability system architecture, it should be part of the monitoring system, and the reason why it is placed here is mainly because the maintenance time in the software life cycle is longer, so it is still necessary in the early system architecture design. Consider monitoring during development and maintenance. At the same time, there will not be much introduction to monitoring here, and only a brief summary will be made based on the three major monitoring data.
From the above steps, we know that if there is no monitoring, the system maintenance personnel will be like a blind man in the face of the system, and will not know the situation of the system. Even if the design is complete in the early stage and the technical level of the developers is high, there will still be problems in the software maintenance process. So detailed, comprehensive and reasonable monitoring is essential. It can help maintainers know the occurrence of exceptions, and can help maintainers know about changes in the system. A comprehensive and perfect monitoring system is the key to business guarantee.
There is no system that is in place in one step, so monitoring is more needed to help the system improve its own problems.
index
We need to expose, collect, and monitor indicators of the business and performance of the system. We can analyze the change of something in the system according to the change of the index, and at the same time, we can send an alarm according to the value of the index.
Indicators can be roughly divided into container (tomcat), middleware, database, http, pool (database connection pool, http connection pool), etc. Each indicator can have QPS, response time, exception rate, slow request rate, etc. These are some basic indicator data, and more indicator data and report displays will be added during the continuous maintenance and iteration of the system. This is a process of continuous optimization.
link tracking
Link tracing is mainly used to analyze the time consumption of an execution process and where specific performance problems occur. At the same time, the link ID (this piece needs to be modified and compatible with the link tracking system) can also be used as the middle layer of the serial log to serialize the log and the link. Because the link data is very complete, link data is very valuable data, and link analysis can be performed to help businesses maintain the system more easily.
log
As the data commonly used by developers to troubleshoot problems, the log has a very uncomfortable point, that is, it is impossible to find out all the logs of an execution at once, so you can add traceId to the log to concatenate the log data. Good, comprehensive logs are key to troubleshooting problems. So the reconstruction of the log exists in the whole process of software maintenance. The level setting of the log is very critical, because we often analyze the log, and notify the maintenance personnel of the corresponding service by alerting the log of the error level.