filebeat —> logstash —>elasticsearch —> kibana
Official website address:
https://www.elastic.co/guide/en/kibana/current/settings.html
https://www.elastic.co/guide/en/logstash/current/docker-config.html
https://www.elastic.co/guide/en/elasticsearch/reference/8.6/docker.html
1. centos7 yum installation source
yum-config-manager --add-repo https://mirrors.aliyun.com/docker-ce/linux/centos/docker-ce.repo
Two, docker deployment
The combination of ELK and Filebeat can achieve more powerful log collection and processing functions.
1. Create a Docker network (omitted)
The containers of ELK and Filebeat will communicate under the same network, so we need to create a Docker network first.
docker network create -d overlay --attachable elastic-net
docker service deployment elk3 copy (can be ignored, notes)
docker service create --name es --network elastic-net --replicas 3 -p 9200:9200 -p 9300:9300 -e "discovery.type=single-node" elasticsearch:8.6.2
docker service logs -f es
curl -X GET "localhost:9200/_cat/nodes?v&pretty"
2. Deploy Elasticsearch and kibana containers
We will deploy Elasticsearch in a Docker container.
In this command, we use the docker run command to create and start a container called elasticsearch. The -p option maps port 4 of the Elasticsearch container to a port on the host machine, and the --network option connects the container to the elk-network network created earlier. Finally, we configure the discovery.type to single-node to indicate that the node is a standalone node.
a. Create the required directory and yml
mkdir -p /u01/elk/elasticsearch/es0{

    1,2,3}/data
mkdir -p /u01/elk/elasticsearch/es0{

    1,2,3}/logs
mkdir -p /u01/elk/kibana/{

    data,config}
mkdir -p /u01/elk/logstash/{

    data,config}
chmod -R 777 /u01/elk/*
a1. Write docker-copose.yml
cd /u01/elk/elasticsearch/
vim docker-compose.yml
version: "2.2"

services:
  setup:
    image: elasticsearch:8.6.2
    volumes:
      - ./certs:/usr/share/elasticsearch/config/certs
    user: "0"
    command: >
      bash -c '
        if [ x${

    ELASTIC_PASSWORD} == x ]; then
          echo "Set the ELASTIC_PASSWORD environment variable in the .env file";
          exit 1;
        elif [ x${

    KIBANA_PASSWORD} == x ]; then
          echo "Set the KIBANA_PASSWORD environment variable in the .env file";
          exit 1;
        fi;
        if [ ! -f config/certs/ca.zip ]; then
          echo "Creating CA";
          bin/elasticsearch-certutil ca --silent --pem -out config/certs/ca.zip;
          unzip config/certs/ca.zip -d config/certs;
        fi;
        if [ ! -f config/certs/certs.zip ]; then
          echo "Creating certs";
          echo -ne \
          "instances:\n"\
          "  - name: es01\n"\
          "    dns:\n"\
          "      - es01\n"\
          "      - localhost\n"\
          "    ip:\n"\
          "      - 127.0.0.1\n"\
          "  - name: es02\n"\
          "    dns:\n"\
          "      - es02\n"\
          "      - localhost\n"\
          "    ip:\n"\
          "      - 127.0.0.1\n"\
          "  - name: es03\n"\
          "    dns:\n"\
          "      - es03\n"\
          "      - localhost\n"\
          "    ip:\n"\
          "      - 127.0.0.1\n"\
          > config/certs/instances.yml;
          bin/elasticsearch-certutil cert --silent --pem -out config/certs/certs.zip --in config/certs/instances.yml --ca-cert config/certs/ca/ca.crt --ca-key config/certs/ca/ca.key;
          unzip config/certs/certs.zip -d config/certs;
        fi;
        echo "Setting file permissions"
        chown -R root:root config/certs;
        find . -type d -exec chmod 750 \{

    \} \;;
        find . -type f -exec chmod 640 \{

    \} \;;
        echo "Waiting for Elasticsearch availability";
        until curl -s --cacert config/certs/ca/ca.crt https://es01:9200 | grep -q "missing authentication credentials"; do sleep 30; done;
        echo "Setting kibana_system password";
        until curl -s -X POST --cacert config/certs/ca/ca.crt -u "elastic:${

    ELASTIC_PASSWORD}" -H "Content-Type: application/json" https://es01:9200/_security/user/kibana_system/_password -d "{

    \"password\":\"${KIBANA_PASSWORD}\"}" | grep -q "^{

    }"; do sleep 10; done;
        echo "All done!";
      '
    healthcheck:
      test: ["CMD-SHELL", "[ -f config/certs/es01/es01.crt ]"]
      interval: 1s
      timeout: 5s
      retries: 120

  es01:
    container_name: es01
    depends_on:
      setup:
        condition: service_healthy
    image: elasticsearch:8.6.2
    volumes:
      - ./certs:/usr/share/elasticsearch/config/certs
      - ./es01/data:/usr/share/elasticsearch/data
      - ./es01/logs:/usr/share/elasticsearch/logs
    ports:
      - 9200:9200
      - 9300:9300
    environment:
      - node.name=es01
      - cluster.name=${

    CLUSTER_NAME}
      - cluster.initial_master_nodes=es01,es02,es03
      - discovery.seed_hosts=es02,es03
      - ELASTIC_PASSWORD=${

    ELASTIC_PASSWORD}
      - bootstrap.memory_lock=true
      - xpack.security.enabled=true
      - xpack.security.http.ssl.enabled=true
      - xpack.security.http.ssl.key=certs/es01/es01.key
      - xpack.security.http.ssl.certificate=certs/es01/es01.crt
      - xpack.security.http.ssl.certificate_authorities=certs/ca/ca.crt
      - xpack.security.transport.ssl.enabled=true
      - xpack.security.transport.ssl.key=certs/es01/es01.key
      - xpack.security.transport.ssl.certificate=certs/es01/es01.crt
      - xpack.security.transport.ssl.certificate_authorities=certs/ca/ca.crt
      - xpack.security.transport.ssl.verification_mode=certificate
      - xpack.license.self_generated.type=${

    LICENSE}
    mem_limit: ${

    MEM_LIMIT}
    ulimits:
      memlock:
        soft: -1
        hard: -1
    deploy:
      resources:
        limits:
          cpus: '0.5'
          memory: 1g
        reservations:
          cpus: '0.25'
          memory: 512m
    healthcheck:
      test:
        [
          "CMD-SHELL",
          "curl -s --cacert config/certs/ca/ca.crt https://localhost:9200 | grep -q 'missing authentication credentials'",
        ]
      interval: 10s
      timeout: 10s
      retries: 120

  es02:
    container_name: es02
    depends_on:
      - es01
    image: elasticsearch:8.6.2
    volumes:
      - ./certs:/usr/share/elasticsearch/config/certs
      - ./es02/data:/usr/share/elasticsearch/data
      - ./es02/logs:/usr/share/elasticsearch/logs
    environment:
      - node.name=es02
      - cluster.name=${

    CLUSTER_NAME}
      - cluster.initial_master_nodes=es01,es02,es03
      - discovery.seed_hosts=es01,es03
      - bootstrap.memory_lock=true
      - xpack.security.enabled=true
      - xpack.security.http.ssl.enabled=true
      - xpack.security.http.ssl.key=certs/es02/es02.key
      - xpack.security.http.ssl.certificate=certs/es02/es02.crt
      - xpack.security.http.ssl.certificate_authorities=certs/ca/ca.crt
      - xpack.security.transport.ssl.enabled=true
      - xpack.security.transport.ssl.key=certs/es02/es02.key
      - xpack.security.transport.ssl.certificate=certs/es02/es02.crt
      - xpack.security.transport.ssl.certificate_authorities=certs/ca/ca.crt
      - xpack.security.transport.ssl.verification_mode=certificate
      - xpack.license.self_generated.type=${

    LICENSE}
    mem_limit: ${

    MEM_LIMIT}
    ulimits:
      memlock:
        soft: -1
        hard: -1
    deploy:
      resources:
        limits:
          cpus: '0.5'
          memory: 1g
        reservations:
          cpus: '0.25'
          memory: 512m
    healthcheck:
      test:
        [
          "CMD-SHELL",
          "curl -s --cacert config/certs/ca/ca.crt https://localhost:9200 | grep -q 'missing authentication credentials'",
        ]
      interval: 10s
      timeout: 10s
      retries: 120

  es03:
    container_name: es03
    depends_on:
      - es02
    image: elasticsearch:8.6.2
    volumes:
      - ./certs:/usr/share/elasticsearch/config/certs
      - ./es03/logs:/usr/share/elasticsearch/logs
      - ./es03/data:/usr/share/elasticsearch/data
    environment:
      - node.name=es03
      - cluster.name=${

    CLUSTER_NAME}
      - cluster.initial_master_nodes=es01,es02,es03
      - discovery.seed_hosts=es01,es02
      - bootstrap.memory_lock=true
      - xpack.security.enabled=true
      - xpack.security.http.ssl.enabled=true
      - xpack.security.http.ssl.key=certs/es03/es03.key
      - xpack.security.http.ssl.certificate=certs/es03/es03.crt
      - xpack.security.http.ssl.certificate_authorities=certs/ca/ca.crt
      - xpack.security.transport.ssl.enabled=true
      - xpack.security.transport.ssl.key=certs/es03/es03.key
      - xpack.security.transport.ssl.certificate=certs/es03/es03.crt
      - xpack.security.transport.ssl.certificate_authorities=certs/ca/ca.crt
      - xpack.security.transport.ssl.verification_mode=certificate
      - xpack.license.self_generated.type=${

    LICENSE}
    mem_limit: ${

    MEM_LIMIT}
    ulimits:
      memlock:
        soft: -1
        hard: -1
    deploy:
      resources:
        limits:
          cpus: '0.5'
          memory: 1g
        reservations:
          cpus: '0.25'
          memory: 512m
    healthcheck:
      test:
        [
          "CMD-SHELL",
          "curl -s --cacert config/certs/ca/ca.crt https://localhost:9200 | grep -q 'missing authentication credentials'",
        ]
      interval: 10s
      timeout: 10s
      retries: 120

  kibana:
    container_name: kibana
    depends_on:
      es01:
        condition: service_healthy
      es02:
        condition: service_healthy
      es03:
        condition: service_healthy
    image: kibana:8.6.2
    volumes:
      - ./certs:/usr/share/kibana/config/certs
      - /u01/elk/kibana/data:/usr/share/kibana/data
    ports:
      - ${

    KIBANA_PORT}:5601
    environment:
      - SERVERNAME=kibana
      - ELASTICSEARCH_HOSTS=https://es01:9200
      - ELASTICSEARCH_USERNAME=kibana_system
      - ELASTICSEARCH_PASSWORD=${

    KIBANA_PASSWORD}
      - SERVER_PUBLICBASEURL=http://192.168.174.130:5601
      - ELASTICSEARCH_SSL_CERTIFICATEAUTHORITIES=config/certs/ca/ca.crt
    mem_limit: ${

    MEM_LIMIT}
    healthcheck:
      test:
        [
          "CMD-SHELL",
          "curl -s -I http://localhost:5601 | grep -q 'HTTP/1.1 302 Found'",
        ]
      interval: 10s
      timeout: 10s
      retries: 120

#volumes:
#  certs:
#    driver: local
#  esdata01:
#    driver: local
#  esdata02:
#    driver: local
#  esdata03:
#    driver: local
#  kibanadata:
#    driver: local
a2. Write the .env file in the same directory
# Password for the 'elastP@sswordic' user (at least 6 characters)
ELASTIC_PASSWORD=P@ssword

# Password for the 'kibana_system' user (at least 6 characters)
KIBANA_PASSWORD=P@ssword

# Version of Elastic products
STACK_VERSION=8.6.2

# Set the cluster name
CLUSTER_NAME=es_cluster

# Set to 'basic' or 'trial' to automatically start the 30-day trial
LICENSE=basic
#LICENSE=trial

# Port to expose Elasticsearch HTTP API to the host
ES_PORT=9200
#ES_PORT=127.0.0.1:9200

# Port to expose Kibana to the host
KIBANA_PORT=5601
#KIBANA_PORT=80

# Increase or decrease based on the available host memory (in bytes)
MEM_LIMIT=1073741824

# Project namespace (defaults to the current folder name if not set)
#COMPOSE_PROJECT_NAME=myproject
a3, background start
docker compose up -d ## 后台运行
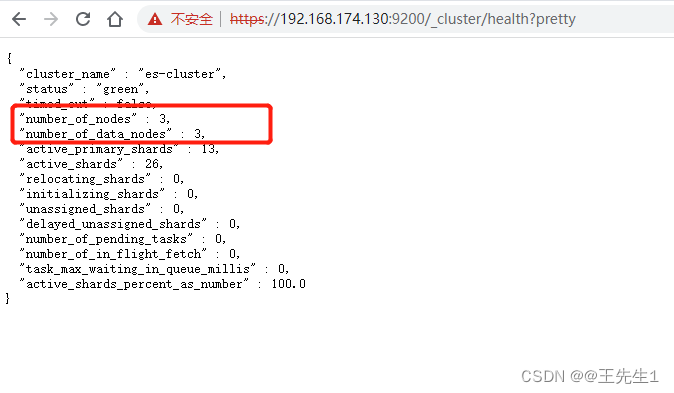
a4. Check the health status of the cluster
https://192.168.174.130:9200/_cluster/health?pretty
b. docker-compose.yaml shell script annotation
检查环境变量ELASTIC_PASSWORD和KIBANA_PASSWORD是否设置,如果没有设置,则输出提示信息并退出脚本。
检查是否已经生成了CA和证书。如果没有生成,则使用elasticsearch-certutil工具生成,将生成的CA和证书文件保存在config/certs目录下。
设置文件权限为root:root和750/640,以保护文件安全。
等待Elasticsearch可用,并检查是否需要身份验证。使用curl命令检查Elasticsearch是否可用,如果返回的信息中包含"missing authentication credentials"字样,则说明不需要身份验证。此处等待30秒,直到Elasticsearch可用。
设置Kibana_system用户的密码。使用curl命令修改Kibana_system用户的密码,直到返回的信息中包含空json {

    } 为止。
输出"All done!"表示脚本执行完成。
c. health check annotation
test:指定健康检查的命令或脚本,使用的格式为 CMD-SHELL,表示在容器内执行 Shell 命令。
interval:健康检查的间隔时间,默认为 30s。
timeout:每次健康检查的超时时间,默认为 30s。
retries:健康检查失败后的重试次数,默认为 3 次。
d. depends_on annotation
It is used to specify the dependencies between services, where depends_on is used to specify other services that this service depends on, and condition is used to specify the conditions of the dependencies.
In this configuration, depends_on specifies that the service that this service depends on is named setup, and condition specifies that this service will only be started when the health check status of the setup service is service_healthy. This means that the service will wait for the health check of the setup service to pass before starting the service.
e, mem_limit resource limit
mem_limit: The maximum memory limit of the container. Here the variable ${MEM_LIMIT} is used to set the memory limit, the value of this variable should be set before deploying.
ulimits: Contains the ulimit parameter configuration of the container, which is used to control the use of system resources by the container. The memlock parameter here sets the memory lock limit, and sets the memory lock limit to unlimited.
deploy: used to define the deployment strategy and resource configuration of the Docker service, including:
resources: used to specify the upper and lower limits of the CPU and memory resources that the service can use. In this example, set the CPU usage limit to 0.5 and the memory limit to 1G. At the same time, set the CPU usage guarantee to 0.25 and the memory guarantee to 512M.
Note that limits and reservations here are two different restriction levels, and different restriction levels will affect Docker's scheduling strategy.
3. Deploy the Logstash container
We will use Logstash to collect, process and transform data and send it to Elasticsearch. Here, we deploy Logstash by mapping configuration files.
Prepare the Logstash configuration file
cat logstash.yml
http.host: "0.0.0.0"
xpack.monitoring.elasticsearch.hosts: [ "https://es01:9200" ]
xpack.monitoring.elasticsearch.username: "elastic"
xpack.monitoring.elasticsearch.password: "P@ssword"
xpack.monitoring.elasticsearch.ssl.certificate_authority: "/usr/share/logstash/config/ca.crt"
cat logstash.conf
input {
  beats {
    port => 5044
  }
}

filter {
  grok {
    match => { "message" => "%{COMBINEDAPACHELOG}" }
  }
}

output {
  elasticsearch {
    hosts => "https://es01:9200"
    user => "elastic"
    password => "P@ssword"
    ssl => true
    cacert => "/user/share/logstash/config/ca.crt"
    index => "httpd_logstash-%{+YYYY.MM.dd}"
  }
}
This configuration file defines how Logstash handles the collected log data. in:
input defines the use of the Beats protocol to listen to port 5044 to receive data.
filter defines how to filter and convert the original log data. Here, the Grok plug-in is used to match the Apache log format.
output defines the way to output the processed log data to Elasticsearch.
run logstash
docker run  -d \
-v /u01/elk/logstash/config/logstash.conf:/usr/share/logstash/config/logstash.conf \
-v /u01/elk/logstash/config/logstash.yml:/usr/share/logstash/config/logstash.yml \
-v /u01/elk/logstash/config/ca.crt:/usr/share/logstash/config/ca.crt --name logstash --network elasticsearch_default  logstash:8.6.2 ./bin/logstash -f /usr/share/logstash/config/your_config_path
4. Deploy the Filebeat container
4.1 Prepare Filebeat configuration file
We will create a configuration file called filebeat.yml on the host and map it to a path inside the container.
filebeat.inputs:
- type: log
  paths:
    - /u01/elk/filebeat/logs/*.log

output.logstash:
  hosts: ["logstash:5044"]
This configuration file defines how Filebeat collects and processes log data. in:
filebeat.inputs defines the log file path to be monitored by Filebeat.
output.logstash defines how log data is sent to Logstash.
4.2 Start the Filebeat container
docker run -d --name filebeat \
    --network elasticsearch_default \
    -v /u01/elk/to/filebeat.yml:/usr/share/filebeat/filebeat.yml \
    -v /var/lib/docker/containers:/var/lib/docker/containers:ro \
    filebeat:8.6.2
In this command, we use the docker run command to create and start a container called filebeat. The --network option connects the container to the elasticsearch_default network created earlier. The -v option maps a Filebeat configuration file on the host to a path inside the container. In addition, we also map the log path of the Docker container to the path inside the Filebeat container so that the log data of the Docker container can be collected and processed.
5. Start the Kibana container
Finally, we will start Kibana in the Docker container to visualize and analyze the log data in Elasticsearch.
docker run -d --name kibana \
    -p 5601:5601 \
    --network elasticsearch_default \
    kibana:8.6.2
In this command, we use the docker run command to create and start a container called kibana. The -p option maps the Kibana container's port to the host's port, and the --network option connects the container to the elasticsearch_default network created earlier.
3. Configuration file
logstash:
Configuration query document: https://www.elastic.co/guide/en/logstash/current/index.html
examples—> options
conf match=pattern
[root@hh patterns]# pwd
/usr/share/logstash/vendor/bundle/jruby/2.5.0/gems/logstash-patterns-core-4.3.4/patterns
logstash.conf
input{


  beats {


    port => 5044
  }
  file {


    path => [ "/usr/local/nginx/logs/access.log","/usr/local/nginx/logs/error.log" ]
    sincedb_path => "/var/log/logstash/since.db"
    start_position => "beginning"
    type => "nginxlog"
  }
  tcp {


    mode => "server"
    host => "0.0.0.0"
    port => 8888
    type => "tcplog"
  }
  udp {


    port => 8888
    type => "udplog"
      }
}
filter{


  grok {


       # match => {

     "message" => "%{

    IP:client} %{

    WORD:method} %{

    URIPATHPARAM:request} %{

    NUMBER:bytes} %{

    NUMBER:duration}" }
       match => {

     "message" => "(?<ip>[0-9\.]+).*\[(?<time>.+)\] \"(?<method>[A-Z]+) (?<url>\S+) (?<ver>[^\"]+)\" (?<rc>\d+) (?<size>\d+) \".*\" \"(?<agent>.*)\""}
      }
}
output{


  #stdout{

     codec => "json"}
  stdout{

     codec => "rubydebug"}
}
elasticsearch
elasticsearch.yml
[root@hh elasticsearch]# grep -Pv "^(#|$)" elasticsearch.yml
node.name: es1              ##hosts文件中主机名
path.data: /var/lib/elasticsearch
path.logs: /var/log/elasticsearch
network.host: 192.168.174.130      ###0.0.0.0监听地址
discovery.seed_hosts: ["es1"]    ###集群多个节点
cluster.initial_master_nodes: ["es1"]
http.cors.enabled: true
http.cors.allow-origin: "*"
kibana
#server.port: 5601
server.host: '0.0.0.0'
#server.basePath: ""
#server.maxPayloadBytes: 1048576
#server.name: "your-hostname"
elasticsearch.url: 'http://192.168.174.130:9201'
#elasticsearch.preserveHost: true
#kibana.index: ".kibana"
#kibana.defaultAppId: "discover"
#elasticsearch.username: "user"
#elasticsearch.password: "pass"
#server.ssl.enabled: false
#server.ssl.certificate: /path/to/your/server.crt
#server.ssl.key: /path/to/your/server.key
#elasticsearch.ssl.certificate: /path/to/your/client.crt
#elasticsearch.ssl.key: /path/to/your/client.key
#elasticsearch.ssl.certificateAuthorities: [ "/path/to/your/CA.pem" ]
#elasticsearch.ssl.verificationMode: full
#elasticsearch.pingTimeout: 1500
#elasticsearch.requestTimeout: 30000
#elasticsearch.requestHeadersWhitelist: [ authorization ]
#elasticsearch.customHeaders: {

    }
#elasticsearch.shardTimeout: 0
#elasticsearch.startupTimeout: 5000
#pid.file: /var/run/kibana.pid
#logging.dest: stdout
#logging.silent: false
#logging.quiet: false
#logging.verbose: false
#ops.interval: 5000
i18n.defaultLocale: "zh_CN"