ELK system construction
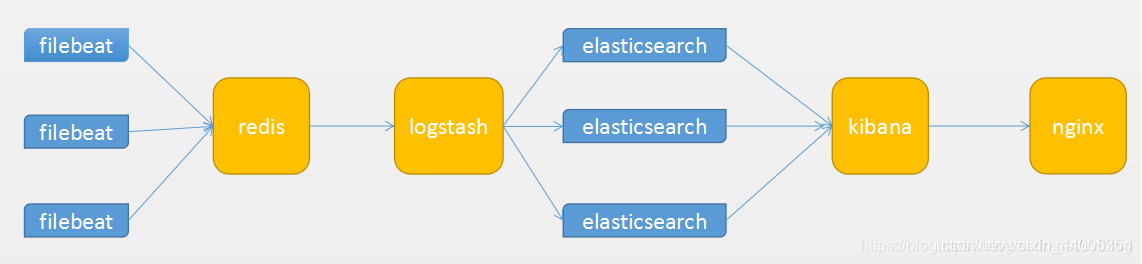
1. System architecture
Two, es cluster construction
1. Configuration preparation
docker run -d --name es --rm -e "discovery.type=single-node" ydtong/elasticsearch:7.2.0
mikdir -p /docker/elk/es1
docker cp es:/usr/share/elasticsearch/config /docker/elk/es1/config
docker stop es
sudo mkdir -p /docker/elk/es1/data
sudo chmod -R 777 /docker/elk/es1/data
cp -a /docker/elk/es1 /docker/elk/es2
cp -a /docker/elk/es1 /docker/elk/es3
2. Configuration file modification
Master node node1: elasticsearch.yml
cluster.name: "elk"
node.name: node1
node.master: true
node.data: false
network.bind_host: 0.0.0.0
network.publish_host: 192.168.10.45
http.port: 9201
transport.tcp.port: 9301
http.cors.enabled: true
http.cors.allow-origin: "*"
discovery.seed_hosts: ["192.168.10.45:9301","192.168.10.45:9302","192.168.10.45:9303"]
cluster.initial_master_nodes: ["node1"]
xpack.monitoring.collection.enabled: true
Data node node2: elasticsearch.yml
cluster.name: "elk"
node.name: node2
node.master: false
node.data: true
network.bind_host: 0.0.0.0
network.publish_host: 192.168.10.45
http.port: 9202
transport.tcp.port: 9302
http.cors.enabled: true
http.cors.allow-origin: "*"
discovery.seed_hosts: ["192.168.10.45:9301","192.168.10.45:9302","192.168.10.45:9303"]
cluster.initial_master_nodes: ["node1"]
xpack.monitoring.collection.enabled: true
Data node node3: elasticsearch.yml
cluster.name: "elk"
node.name: node3
node.master: false
node.data: true
network.bind_host: 0.0.0.0
network.publish_host: 192.168.10.45
http.port: 9203
transport.tcp.port: 9303
http.cors.enabled: true
http.cors.allow-origin: "*"
discovery.seed_hosts: ["192.168.10.45:9301","192.168.10.45:9302","192.168.10.45:9303"]
cluster.initial_master_nodes: ["node1"]
xpack.monitoring.collection.enabled: true
3. Start the es cluster
docker run -d --name es-node1 -p 9201:9201 -p 9301:9301 \
-v /docker/elk/es1/config/:/usr/share/elasticsearch/config \
-v /docker/elk/es1/data/:/usr/share/elasticsearch/data \
ydtong/elasticsearch:7.2.0

docker run -d --name es-node2 -p 9202:9202 -p 9302:9302 \
-v /docker/elk/es2/config/:/usr/share/elasticsearch/config \
-v /docker/elk/es2/data/:/usr/share/elasticsearch/data \
ydtong/elasticsearch:7.2.0

docker run -d --name es-node3 -p 9203:9203 -p 9303:9303 \
-v /docker/elk/es3/config/:/usr/share/elasticsearch/config \
-v /docker/elk/es3/data/:/usr/share/elasticsearch/data \
ydtong/elasticsearch:7.2.0
4. View the cluster status
The status status is green, the cluster is considered successful
curl 192.168.10.45:9201/_cluster/health
{"cluster_name":"elk","status":"green","timed_out":false,"number_of_nodes":3,"number_of_data_nodes":2,"active_primary_shards":10,"active_shards":20,"relocating_shards":0,"initializing_shards":0,"unassigned_shards":0,"delayed_unassigned_shards":0,"number_of_pending_tasks":0,"number_of_in_flight_fetch":0,"task_max_waiting_in_queue_millis":0,"active_shards_percent_as_number":100.0}
5. Solve the problem of es startup error reporting
max virtual memory areas vm.max_map_count [65530] is too low, increase to at least [262144]
Switch root user su root
输入命令
  sysctl -w vm.max_map_count=262144
查看
  sysctl -a|grep vm.max_map_count
结果
  vm.max_map_count = 262144
prevent this from happening in the future
Switch to the root user to modify the configuration sysctl.conf
vi /etc/sysctl.conf
Add the following configuration:
vm.max_map_count=655360
and execute the command:
sysctl -p
Then, restart elasticsearch to start successfully
6. Insufficient memory for es startup
Insufficient memory required by the JVM
[es@localhost bin]$ ./elasticsearch
Exception in thread "main" java.lang.RuntimeException: starting java failed with [1]
output:
#
# There is insufficient memory for the Java Runtime Environment to continue.
# Native memory allocation (mmap) failed to map 986513408 bytes for committing reserved memory.
# An error report file with more information is saved as:
# logs/hs_err_pid59343.log
error:
OpenJDK 64-Bit Server VM warning: Option UseConcMarkSweepGC was deprecated in version 9.0 and will likely be removed in a future release.
OpenJDK 64-Bit Server VM warning: INFO: os::commit_memory(0x00000000c5330000, 986513408, 0) failed; error='Not enough space' (errno=12)
        at org.elasticsearch.tools.launchers.JvmErgonomics.flagsFinal(JvmErgonomics.java:111)
        at org.elasticsearch.tools.launchers.JvmErgonomics.finalJvmOptions(JvmErgonomics.java:79)
        at org.elasticsearch.tools.launchers.JvmErgonomics.choose(JvmErgonomics.java:57)
        at org.elasticsearch.tools.launchers.JvmOptionsParser.main(JvmOptionsParser.java:89)
solve:
Modify the jvm configuration file jvm.options
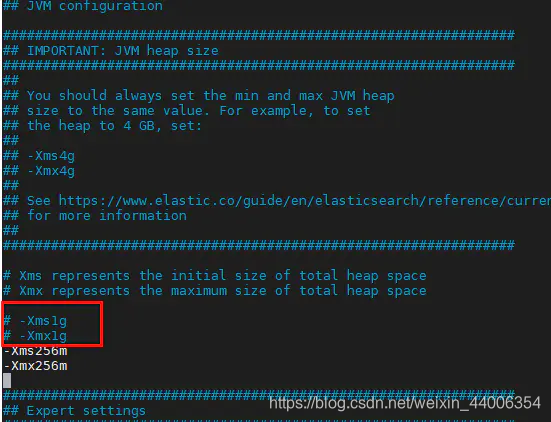
and change the red box memory to a value that matches the machine memory.
3. Kibana construction
1. Configuration file preparation
docker run -d --name kibana --rm ydtong/kibana:7.2.0
mkdir -p /docker/elk/kibana/config
cd /docker/elk/kibana/config
docker cp kibana:/usr/share/kibana/config/kibana.yml .
docker stop kibana
kibana.yml
server.port: 5601
server.host: "0.0.0.0"
elasticsearch.hosts: ["http://192.168.10.45:9201","http://192.168.10.45:9202","http://192.168.10.45:9203"]
2. Install the logtrail plugin
1. Download the kibana plugin logtrail
Kibana requires that the plugin version exactly matches the Kibana version. If you can't find the logtrail plugin version for your Kibana version, follow the URL here to find the updated Kibana version in the logtrail plugin archive.
Put the downloaded compressed package in the /docker/elk/kibana directory and create a Dockerfile
#基础镜像
FROM ydtong/kibana:7.2.0
#将文件拷贝到/usr/share/kibana下
COPY logtrail-7.2.0-0.1.31.zip /usr/share/kibana/logtrail-7.2.0.zip
#安装插件
RUN  bin/kibana-plugin install file:///usr/share/kibana/logtrail-7.2.0.zip && rm -rf /usr/share/kibana/logtrail-7.2.0.zip
- Note: Put the file in the current directory of the container. If you don’t know it, you can use
pwdit to locate it. Put the file in this directory. Use towhoamiview the current effective user name
3. Start command
docker run -d --name kibana -p 5601:5601 -v /docker/elk/kibana/config/kibana.yml:/usr/share/kibana/config/kibana.yml:ro ydtong/kibana:7.2.0
4. Browser access
http://192.168.10.45:5601/

Click Dev toolsto view cluster health

Four, redis construction
1. Configuration file preparation
mkdir -p /docker/elk/redis/data
vim /docker/elk/redis/data/redis.conf
redis.conf
bind 0.0.0.0
daemonize no
pidfile "/var/run/redis.pid"
port 6380
timeout 300
loglevel warning
logfile "redis.log"
databases 16
rdbcompression yes
dbfilename "redis.rdb"
dir "/data"
requirepass "123456"
masterauth "123456"
maxclients 10000
maxmemory 1000mb
maxmemory-policy allkeys-lru
appendonly yes
appendfsync always
2. Start command
docker run -d --name redis -p 6380:6380 -v /docker/elk/redis/data/:/data redis:5.0 redis-server redis.conf
Five, logstash build
1. Configuration preparation
mkdir /docker/elk/logstash
cd /docker/elk/logstash
docker run --rm -d --name logstash ydtong/logstash:7.2.0
docker cp logstash:/usr/share/logstash/config .
docker cp logstash:/usr/share/logstash/pipeline .
docker stop logstash
2. Modify the configuration file
vim /docker/elk/logstash/config/logstash.yml
vim /docker/elk/logstash/config/pipelines.yml
mv /docker/elk/logstash/pipeline/logstash.conf /docker/elk/logstash/pipeline/docker.conf
vim /docker/elk/logstash/pipeline/docker.conf
logstash.yml
http.host: "0.0.0.0"
xpack.monitoring.enabled: true
xpack.monitoring.elasticsearch.hosts: ["http://192.168.10.45:9201","http://192.168.10.45:9202","http://192.168.10.45:9203"]
pipelines.yml
- pipeline.id: docker
  path.config: "/usr/share/logstash/pipeline/docker.conf"
docker.conf
input {
    redis {
        host => "192.168.10.45"
        port => 6380
        db => 0
        key => "localhost"
        password => "123456"
        data_type => "list"
        threads => 4
        tags => "localhost"
    }
}

output {
    if "localhost" in [tags] {
        if [fields][function] == "docker" {
            elasticsearch {
                hosts => ["192.168.10.45:9201","192.168.10.45:9202","192.168.10.45:9203"]
                index => "docker-localhost-%{+YYYY.MM.dd}"
            }
        }
    }
}
3. Start command
docker run -d -p 5044:5044 -p 9600:9600 --name logstash  \
-v /docker/elk/logstash/config/:/usr/share/logstash/config \
-v /docker/elk/logstash/pipeline/:/usr/share/logstash/pipeline \
ydtong/logstash:7.2.0
Six, filebeat build (collect docker logs)
1. Configuration file preparation
mkdir /docker/elk/filebeat
vim /docker/elk/filebeat/filebeat.yml
sudo chown root:root /docker/elk/filebeat/filebeat.yml
filebeat.yml
filebeat.config.modules:
  path: ${path.config}/modules.d/*.yml
  reload.enabled: false

setup.template.settings:
  index.number_of_shards: 1

filebeat.inputs:
- type: docker
  enabled: true
  combine_partial: true
  containers:
    path: "/var/lib/docker/containers"
    ids:
      - '*'
  processors:
    - add_docker_metadata: ~
  encoding: utf-8
  max_bytes: 104857600
  tail_files: true
  fields:
    function: docker

processors:
  - add_host_metadata: ~
  - add_cloud_metadata: ~

output.redis:
  hosts: ["192.168.10.45:6380"]
  password: "123456"
  db: 0
  key: "ydt"
  keys:
    - key: "%{[fields.list]}"
      mappings:
        function: "docker"
  worker: 4
  timeout: 20
  max_retries: 3
  codec.json:
    pretty: false

monitoring.enabled: true
monitoring.elasticsearch:
  hosts: ["http://192.168.10.45:9201","http://192.168.10.45:9202","http://192.168.10.45:9203"]
2. Start command
docker run -d --name filebeat --hostname localhost --user=root \
-v /docker/elk/filebeat/filebeat.yml:/usr/share/filebeat/filebeat.yml:ro \
-v /var/lib/docker:/var/lib/docker:ro \
-v /var/run/docker.sock:/var/run/docker.sock:ro \
ydtong/filebeat:7.2.0
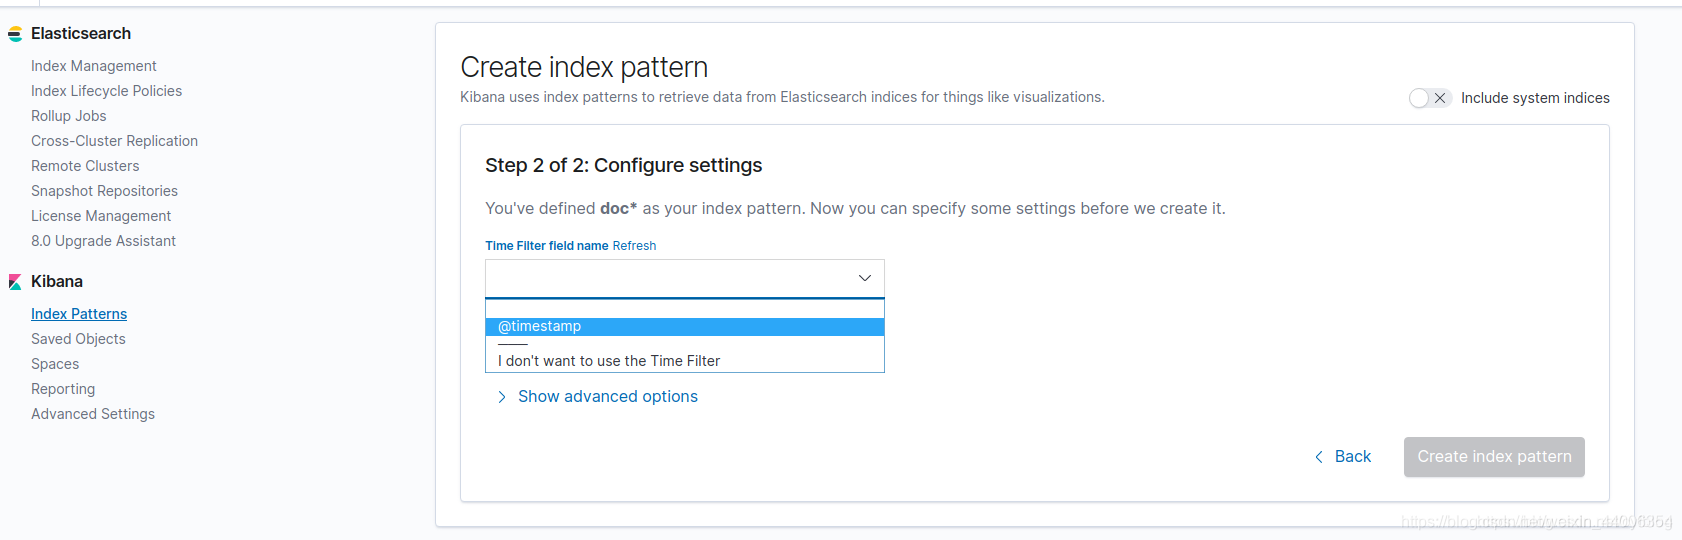
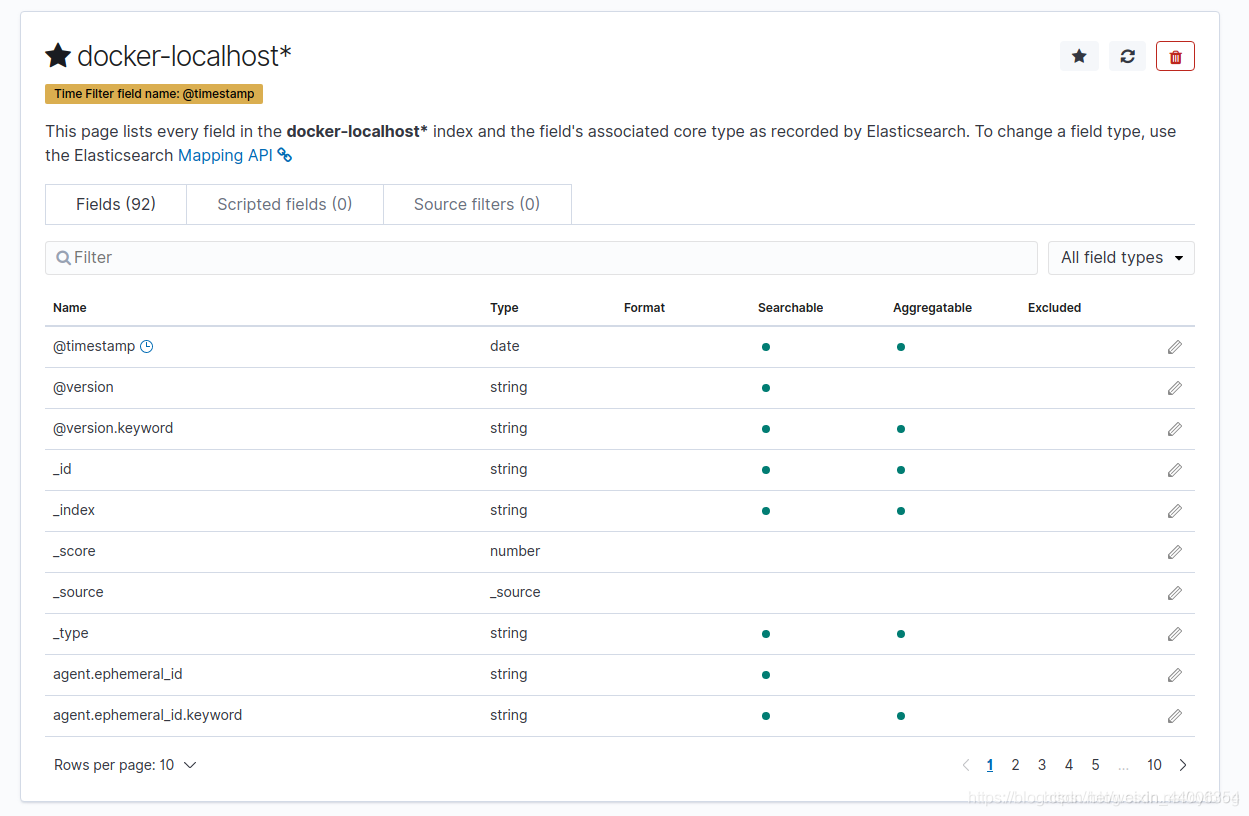
7. Log display
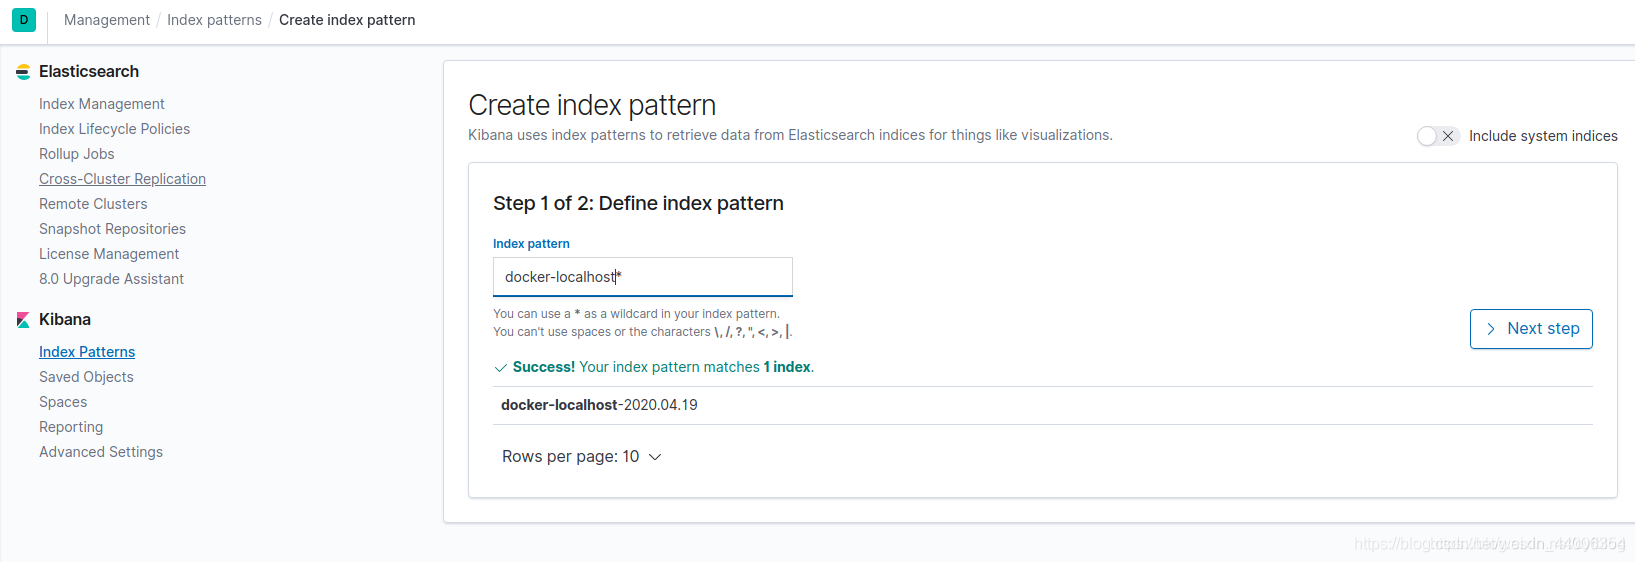
1. Configuration index
Click Management, then click Index Patterns under Kibana, and then Create index pattern
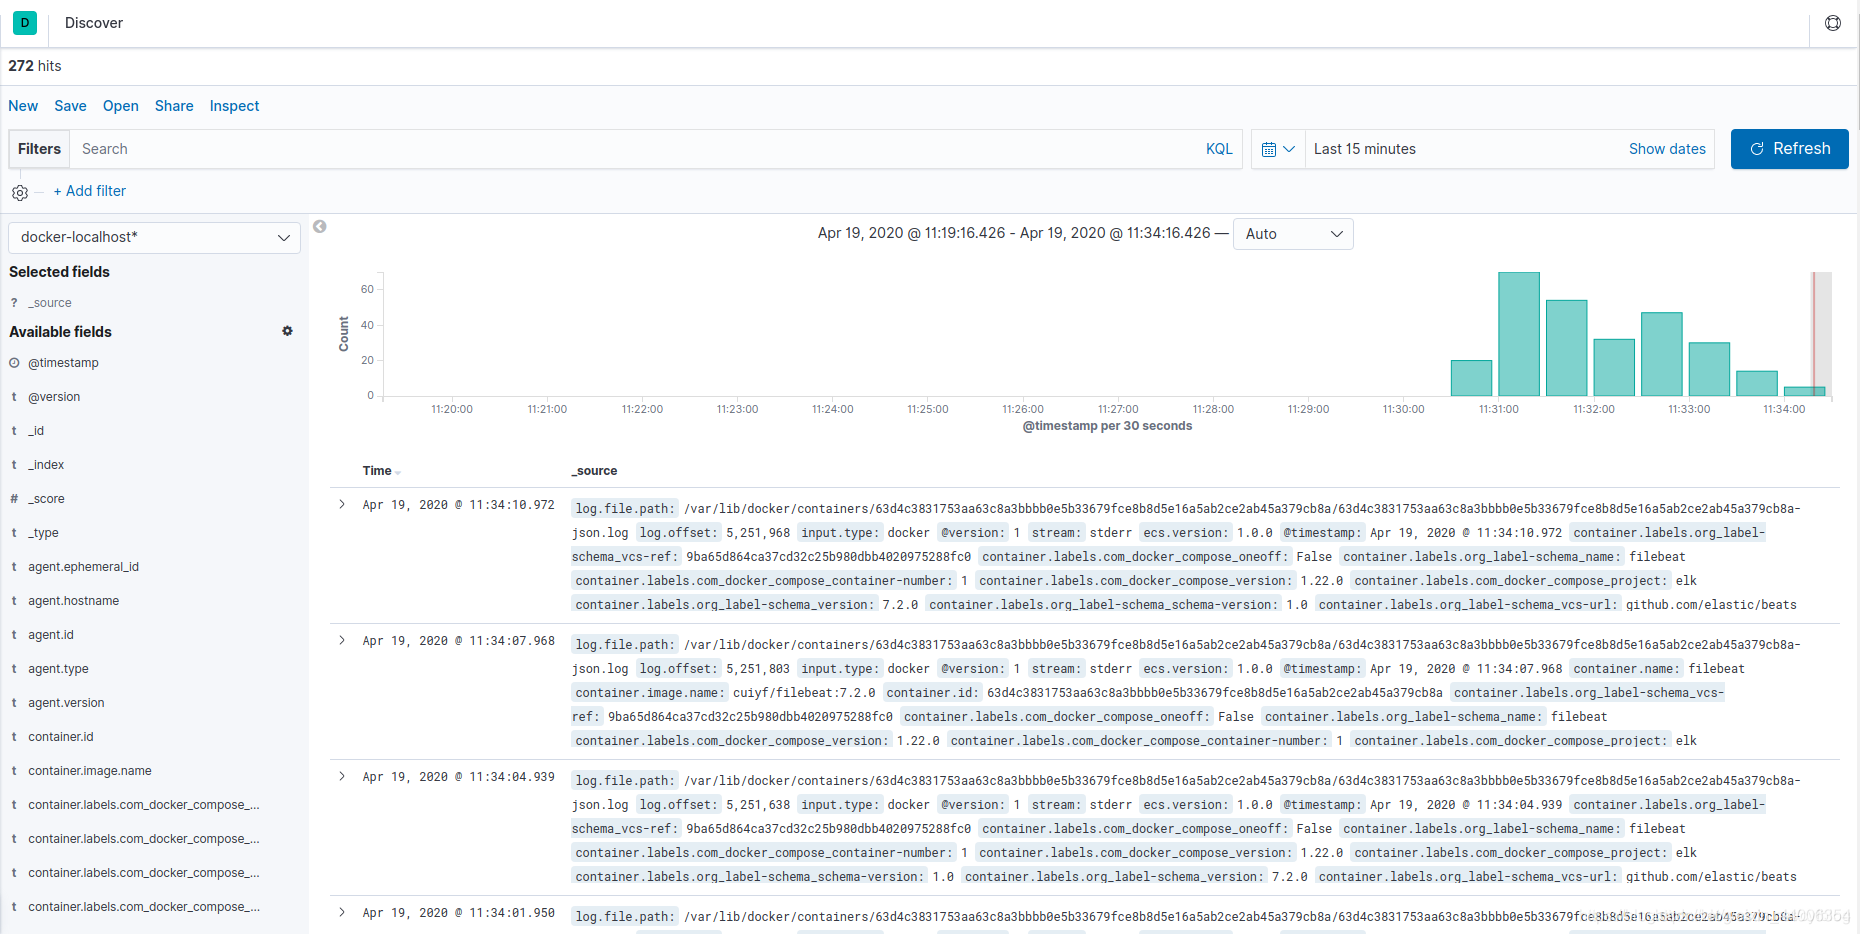
2. Check the log
Click Discover