Chapter 3 Introduction to Python Machine Learning Series and DataFrame Creation, Indexing, Slicing, Data Cleaning, Data Analysis, etc.
Chapter 1 Use of the Pandas library for getting started with Python machine learning
Chapter 2 Use of the NumPy Library for Getting Started with Python Machine Learning
Chapter 3 Introduction to Python Machine Learning Series and DataFrame Creation, Indexing, Slicing, Data Cleaning, Data Analysis, etc.
Chapter 4 Data Visualization for Getting Started with Python Machine Learning
Chapter 5 Machine Learning Algorithms for Getting Started with Python Machine Learning
Chapter 6 Practical Projects for Getting Started with Python Machine Learning

1. Create Series
1. Creation of Series
Series is a one-dimensional array that can be created by:
Create Series from list
Use the pd.Series() function to create a Series object, specify the index parameter to customize the index, and specify the dtype parameter to specify the data type. For example:
s = pd.Series([1, 2, 3, 4, 5], index=['a', 'b', 'c', 'd', 'e'], dtype=float)
print(s)
Output result:
a    1.0
b    2.0
c    3.0
d    4.0
e    5.0
dtype: float64
You can use the Python built-in function list() to convert other data types into lists, use the Python built-in function range() to generate a sequence of integers within a certain range, use the functions in the NumPy library to generate a sequence of random numbers within a certain range, and use the Python built-in function zip() combines multiple lists into a list of tuples.
Create a Series from a dictionary
Use the pd.Series() function to create a Series object. The key of the dictionary will be used as the index of the Series, and the value of the dictionary will be used as the data of the Series. You can specify the dtype parameter to specify the data type. For example:
d = {

    'a': 1, 'b': 2, 'c': 3, 'd': 4, 'e': 5}
s = pd.Series(d, dtype=float)
print(s)
Output result:
a    1.0
b    2.0
c    3.0
d    4.0
e    5.0
dtype: float64
Second, the creation of DataFrame
DataFrame is a two-dimensional table, which can be created in the following ways:
WX search official account: resource charging bar
0R scan code attention

因为我在学习过程中经常要找资料,而且很多要付费,所以干了个免费的资源分享平台。不要想太多,真的无偿,关注回复想要的资料即可
Free sharing of popular IT learning materials in 2023, various tutorials on various platforms, source code

Create DataFrame from list
Use the pd.DataFrame() function to create a DataFrame object, you can specify the columns parameter to customize the column name, and specify the index parameter to customize the index. For example:
data = {

    'name': ['Alice', 'Bob', 'Charlie', 'David'], 'age': [25, 30, 35, 40], 'gender': ['F', 'M', 'M', 'M']}
df = pd.DataFrame(data, columns=['name', 'age', 'gender'], index=['a', 'b', 'c', 'd'])
print(df)
Output result:
a     Alice   25      F
b       Bob   30      M
c   Charlie   35      M
d     David   40      M
Other data types can be converted to lists using the Python built-in function list(), and multiple lists can be combined into a list of tuples using the Python built-in function zip().
Create DataFrame from dictionary
Use the pd.DataFrame() function to create a DataFrame object. The key of the dictionary will be used as the column name of the DataFrame, and the value of the dictionary will be used as the data of the DataFrame. You can specify the columns parameter to customize the column name, and specify the index parameter to customize the index. For example:
data = {

    'name': ['Alice', 'Bob', 'Charlie', 'David'], 'age': [25, 30, 35, 40], 'gender': ['F', 'M', 'M', 'M']}
df = pd.DataFrame.from_dict(data, orient='columns', columns=['name', 'age', 'gender'], index=['a', 'b', 'c', 'd'])
print(df)
Output result:
a     Alice   25      F
b       Bob   30      M
c   Charlie   35      M
d     David   40      M
3. Indexing and slicing
Indexing and slicing of Series
Use the [] operator for indexing, the .loc[] method for label indexing, the .iloc[] method for location indexing, the slice operation for slice operations, and the boolean index for filter operations. For example:
s = pd.Series([1, 2, 3, 4, 5], index=['a', 'b', 'c', 'd',
output result
1.0 1.0 1.0 b 2.0 c 3.0 d 4.0 e 5.0 dtype: float64

d 4.0 e 5.0 dtype: float64
Indexing and slicing of DataFrame
Use the [] operator for indexing, the .loc[] method for label indexing, the .iloc[] method for location indexing, the slice operation for slice operations, and the boolean index for filter operations. For example
import pandas as pd

data = {

    'name': ['Alice', 'Bob', 'Charlie', 'David'], 'age': [25, 30, 35, 40], 'gender': ['F', 'M', 'M', 'M']}
df = pd.DataFrame(data, columns=['name', 'age', 'gender'], index=['a', 'b', 'c', 'd'])

#索引
print(df['name'])

#标签索引
print(df.loc['a'])

#位置索引
print(df.iloc[0])

#切片
print(df[1:3])

#筛选
print(df[df['age'] > 30])
输出结果:

```csharp
a       Alice
b         Bob
c     Charlie
d       David
Name: name, dtype: object

name      Alice
age          25
gender        F
Name: a, dtype: object

name      Alice
age          25
gender        F
Name: a, dtype: object

       name  age gender
b       Bob   30      M
c   Charlie   35      M

       name  age gender
c   Charlie   35      M
d     David   40      M
4. Data cleaning
remove duplicate rows
Use the .drop_duplicates() method to remove duplicate rows in a DataFrame. For example:
import pandas as pd

data = {

    'name': ['Alice', 'Bob', 'Charlie', 'David', 'Bob'], 'age': [25, 30, 35, 40, 30], 'gender': ['F', 'M', 'M', 'M', 'M']}
df = pd.DataFrame(data, columns=['name', 'age', 'gender'])

# 删除重复行
df = df.drop_duplicates()
print(df)
Output result:
      name  age gender
0    Alice   25      F
1      Bob   30      M
2  Charlie   35      M
3    David   40
5. Replace empty values
Use the .fillna() method to replace empty values in a DataFrame with the specified value. For example
import pandas as pd

data = {

    'name': ['Alice', 'Bob', 'Charlie', 'David'], 'age': [25, None, 35, 40], 'gender': ['F', 'M', 'M', None]}
df = pd.DataFrame(data, columns=['name', 'age', 'gender'])

# 替换空值
df = df.fillna({

    'age': 30, 'gender': 'M'})
print(df)
Output result:
       name   age gender
0     Alice  25.0      F
1       Bob  30.0      M
2   Charlie  35.0      M
3     David  40.0      M
6. Data type conversion
In Pandas, the data type conversion of Series and DataFrame can use the astype() method. The astype() method can convert the data type in Series or DataFrame to the specified data type. Here is some sample code:
import pandas as pd

# 创建一个Series
s = pd.Series(['1', '2', '3'])
print(s)

# 将Series中的数据类型转换为整型
s = s.astype(int)
print(s)

# 创建一个DataFrame
df = pd.DataFrame({

    'A': ['1', '2', '3'], 'B': ['4', '5', '6']})
print(df)

# 将DataFrame中的数据类型转换为整型
df = df.astype(int)
print(df)
Output result:
0    1
1    2
2    3
dtype: object
0    1
1    2
2    3
dtype: int64
  A  B
0  1  4
1  2  5
2  3  6
  A  B
0  1  4
1  2  5
2  3  6
7. Data Analysis
In Pandas, data analysis of Series and DataFrame can use a variety of methods, including descriptive statistics, sorting, filtering, grouping, aggregation and other operations. Here is some sample code:
import pandas as pd

# 创建一个Series
s = pd.Series([1, 2, 3, 4, 5])

# 描述性统计
print(s.describe())

# 排序
print(s.sort_values(ascending=False))

# 筛选
print(s[s > 3])

# 创建一个DataFrame
df = pd.DataFrame({

    'A': [1, 2, 3, 4,{

    'A': [1, 2, 3, 4, 5], 'B': [6, 7, 8, 9, 10]})\n\n# 分组\ngrouped = df.groupby('A')\n\n# 聚合\nprint(grouped.aggregate(['sum', 'mean', 'max']))\n```\n\n输出结果:\n\n```\ncount    5.000000\nmean     3.000000\nstd      1.581139\nmin      1.000000\n25%      2.000000\n50%      3.000000\n75%      4.000000\nmax      5.000000\ndtype: float64\n4    5\n3    4\n2    3\n1    2\n0    1\ndtype: int64\n3    4\n4    5\ndtype: int64\n  B
  sum mean max
A
1  6.0  6.0   6
2  7.0  7.0   7
3  8.0  8.0   8
4  9.0  9.0   9
5  10.0 10.0  10
8. Summary
In the introduction to Python machine learning, we learned the creation, indexing, slicing, data cleaning, data analysis and other operations of Series and DataFrame in the Pandas library. The following is a summary of this study:
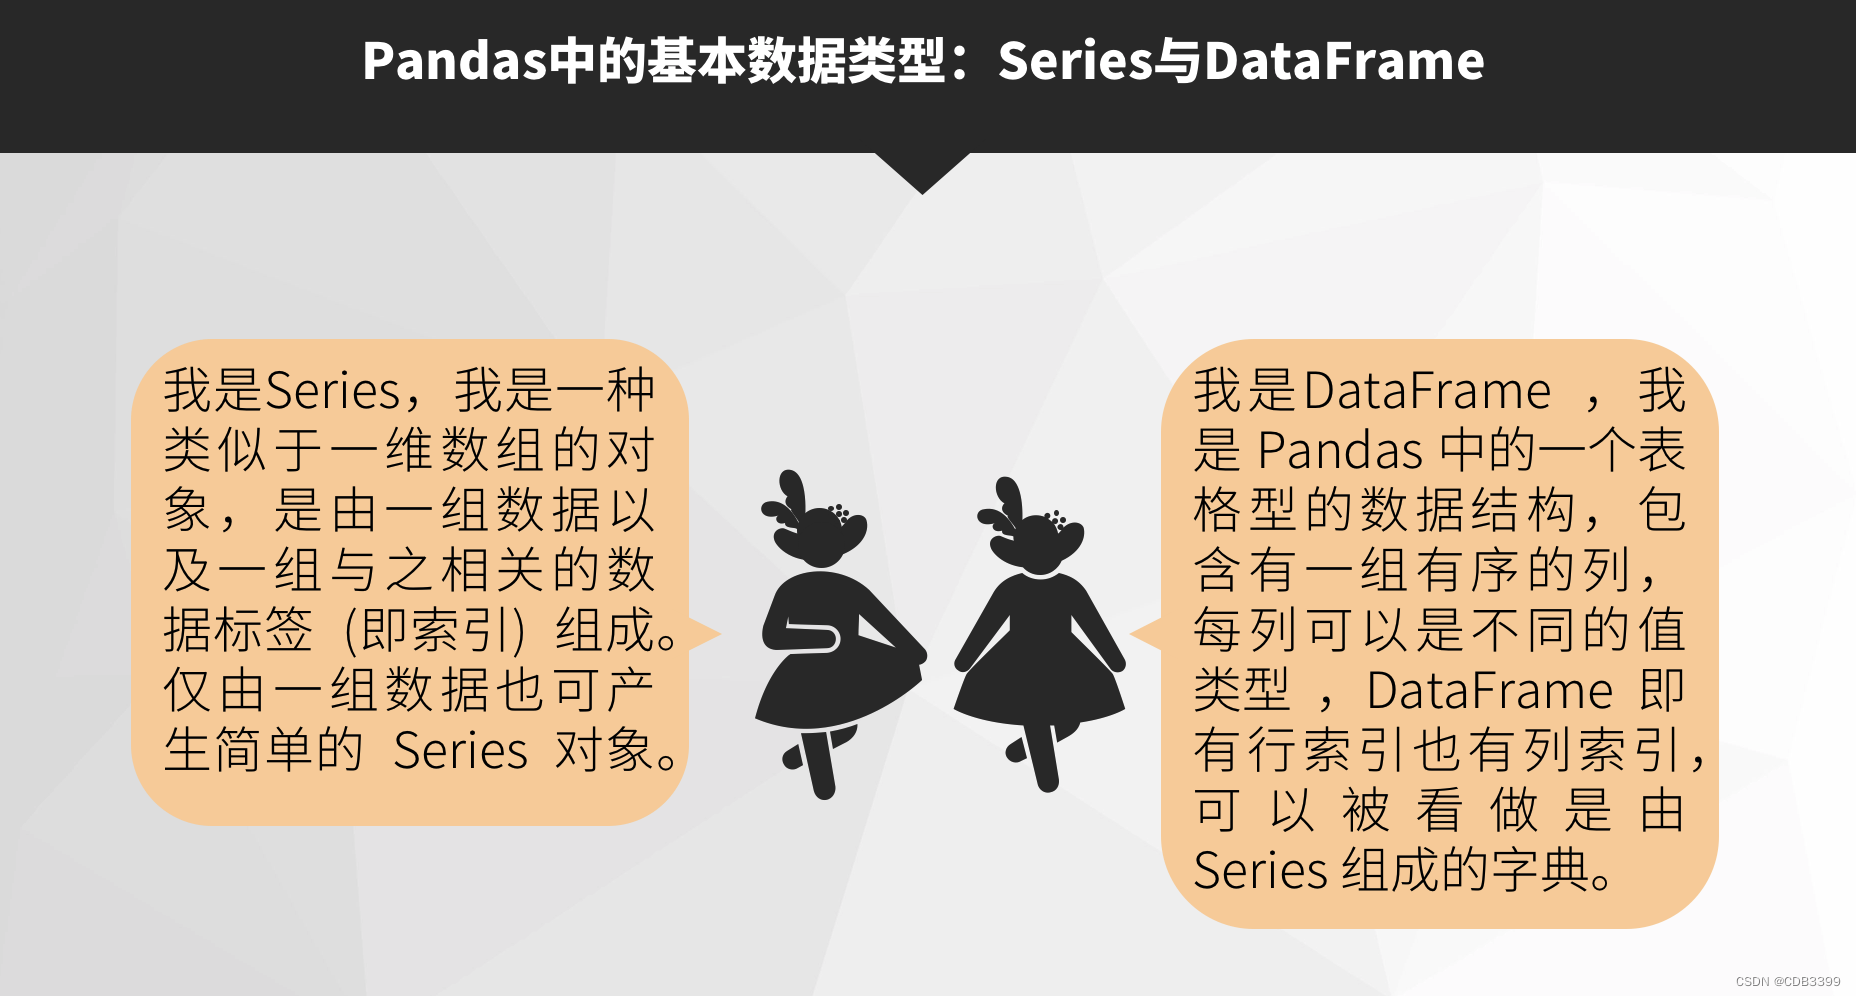
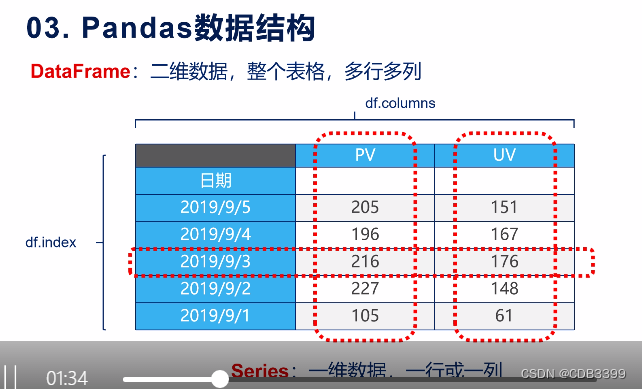
Series is a one-dimensional array that can be created through lists, dictionaries, arrays, etc. Series can be accessed and modified through indexes, and supports slicing operations.
DataFrame is a two-dimensional table that can be created by lists, dictionaries, arrays, etc. DataFrame can be accessed and modified by column name and row index, and supports slice operation.
Data cleaning is the pre-work of data analysis, including dealing with problems such as missing values, repeated values, and outliers. Pandas provides a variety of methods for data cleaning, such as dropna(), fillna(), drop_duplicates(), replace(), etc.
Data analysis is the core work of data mining, including descriptive statistics, sorting, filtering, grouping, aggregation and other operations. Pandas provides a variety of methods for data analysis, such as describe(), sort_values(), groupby(), aggregate(), etc.
Data visualization is an important means of data analysis. It can display data distribution, trends and other information through charts. Pandas provides visualization methods for various chart types, such as plot(), hist(), scatter(), etc.
In short, Pandas is one of the indispensable tools in Python machine learning. Mastering the use of Pandas is very important for data analysis and mining.