
Article Directory
foreword
Recently, I was learning some data mining content, and found that the processing of csv files must be inseparable from the Pandas command, and the power of Pandas is far beyond my cognition. Compared with writing some functional code by myself, using the Pandas command It is more convenient and faster to deal with, and the code is more concise. Here are some commonly used Pandas commands.
The code in the article is recommended to run in jupyter notebook
1. Basic commands
Take this as an example to handle:
data=pd.DataFrame({


    "name":['Bob','Mike','James','John','Neix','Amy','Sera','Lee','Jay','Claso','Bio','David'],
    "area":['A','A','B','C','C','C','B','A','C','C','A','B'],
    "age":[24, 23, 16, 22, 34, 11, 23, 28, 26, 41, 25, 42],
    "weight":[54, 55, 51, 59, 50, 56, 56, 55, 66, 76, 69, 54]

})

1. Basic commands
令data是读取csv文件后的DataFrame
data.head(n)————————显示前n行数据
data.tail(n)————————显示后n行数据

data1 = data.set_index("xxx")————————将xxx列设置为索引

data.infoo()————————获取 dataFrame 的大致信息(有无缺失值、占用内存等)
data.describe()————————获取基本的统计值信息(最大值/最小值、方差等)
2. Advanced commands
2.1 Groupby() : Groups data based on values in one or more columns, and then performs aggregation operations on each group
2.1.1 Cooperate with sum()/mean() operation
按照地区分类求年龄总和(平均值:.mean())

When it is finally displayed, it is found that the index columns are not on the same row, which can be .reset_index()solved by using .

2.1.2 Cooperate with agg() operation - more commonly used
usage:grouped_data = data.groupby('分组列').agg(操作函数)

按照地区分类求年龄和体重平均值

按照地区分类只求体重的最大值

If you want to take different treatments for different columns, you can use a dictionary to specify the corresponding operations
例如:按照地区分类,求年龄的均值和体重的最大值

2.1.3 Cooperate with apply() operation - more flexible
apply can pass in custom functions to achieve more complex operations (agg is also available)
按照地区分类,求年龄和体重的平均值,保留1位小数
def avg(row):
    return round(row.mean(), 1)
c = data.groupby('area').apply(avg)
c

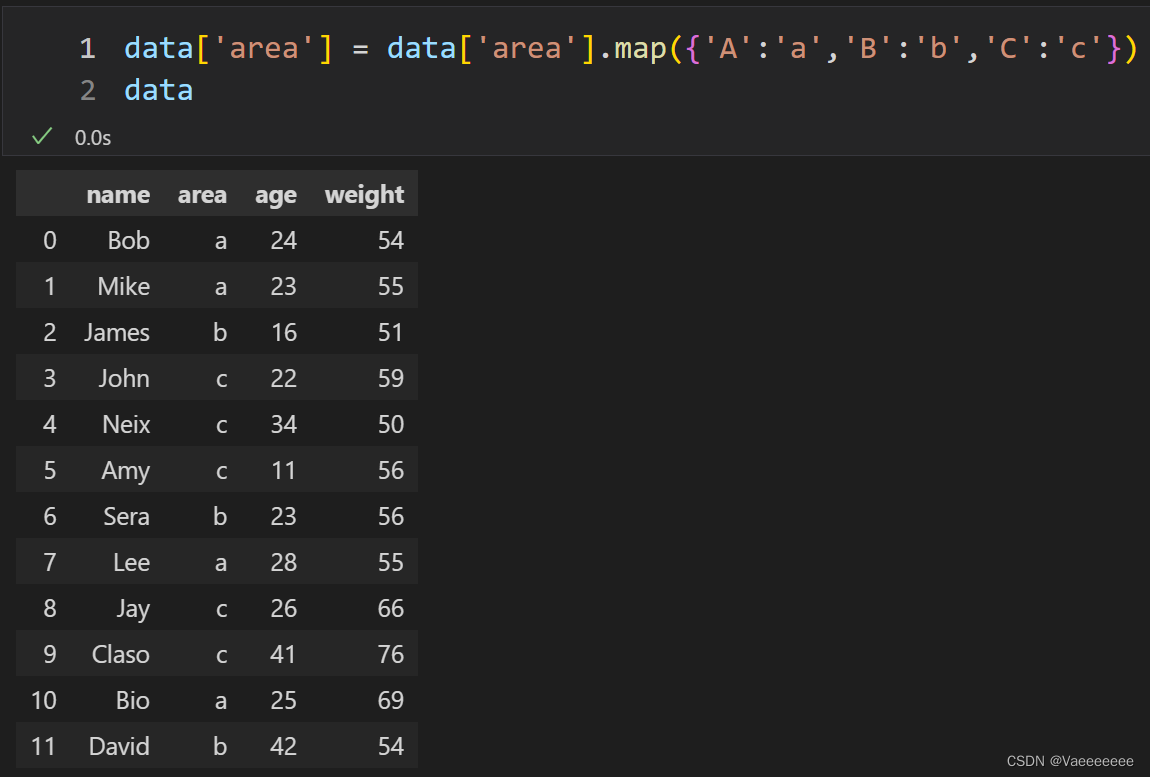
2.2 map(): mapping operation
2.2.1 Using dictionary mapping
将area的大写字母换成小写字母
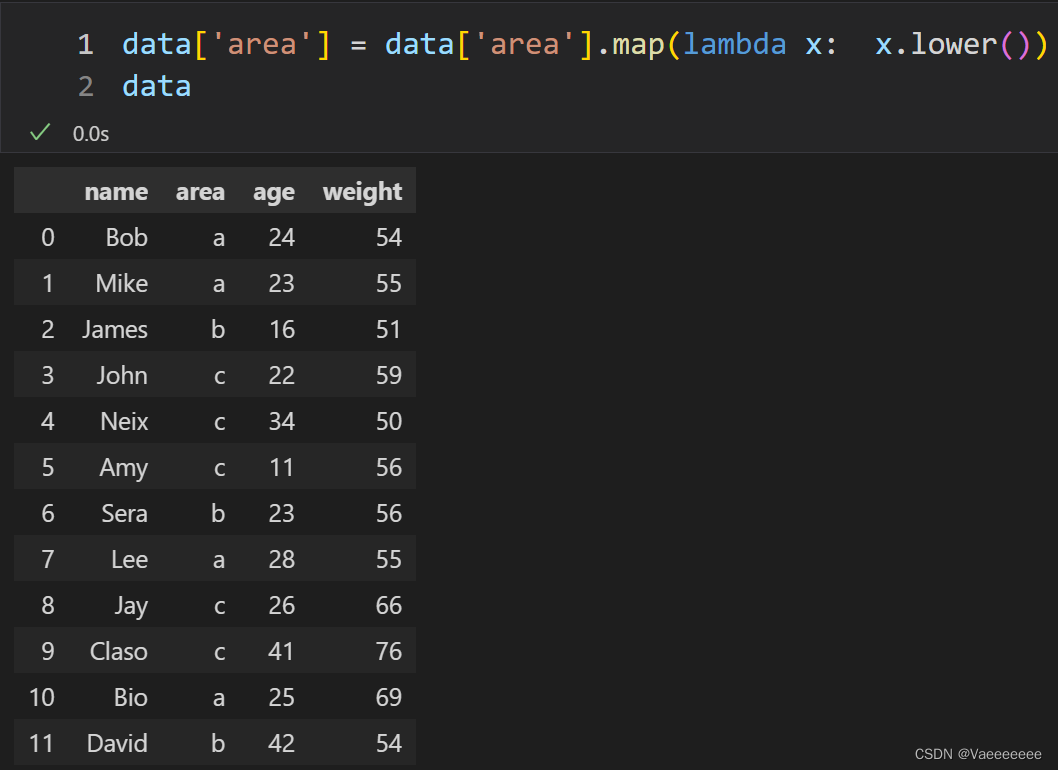
2.2.1 Using function mapping
2.3 Filter operation
2.3.1 General filter commands
筛选出年龄大于30且体重大于60的所有数据
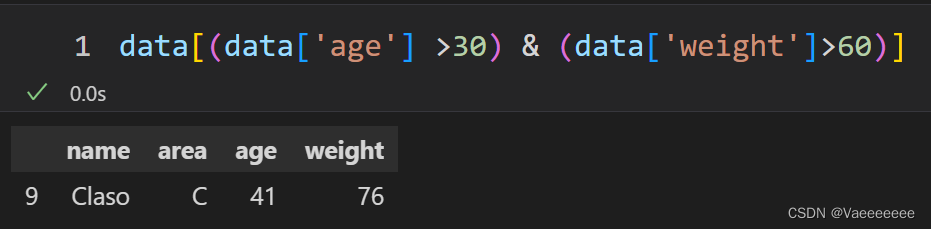
Note: In Pandas, use &the symbol instead and, use |the symbol instead or, otherwise an error will be reported.
2.3.2 loc and iloc commands—similar to list slicing
loc: filter using label index
iloc: filter using position index
# 通过单个标签选择一行数据
# 下面两个代码结果相同,但是要注意1的含义不同
data.loc[1]        # 行标签为1
data.iloc[1]   	   # 1代表第二行
'''
name      Mike
area         A
age         23
weight      55
Name: 1, dtype: object
'''

# 通过标签列表选择多行数据
data.loc[[1,3]]
data.iloc[[1,3]]
'''
    name	area	age   weight
1	Mike	  A	     23	   55
3	John	  C	     22	   59
'''

# 通过标签范围选择多行数据
data.loc[1:3]    #左闭右闭
data.iloc[1:4]   # 左闭右开
'''
    name	area	age	  weight
1	Mike	  A	     23	   55
2	James	  B	     16	   51
3	John	  C	     22	   59
'''

# 通过列标签进行筛选
data.loc[:,'name']
'''
0       Bob
1      Mike
2     James
3      John
4      Neix
5       Amy
6      Sera
7       Lee
8       Jay
9     Claso
10      Bio
11    David
Name: name, dtype: object
'''
2.3.3 str.contains Usage: Used to find substrings in Series
usage:
s.str.contains(pat, case=True, flags=0, na=nan) #s为 series
pat: The substring to find, which can be a regular expression.
case: Whether case sensitive, the default is True.
flags: Used to control the behavior of regular expressions.
na: When an element is a missing value (NaN), what value is returned, the default is NaN
将姓名首字母A到G的数据筛选出来

3. Date (time) processing
Add a column of random date data:
data['date'] = pd.Series(['2015/08/06','2015/04/19','2016/11/11','2015/01/30','2016/09/01',
                          '2015/02/02','2016/07/16','2016/03/19','2016/06/10','2015/12/15',
                          '2016/10/27','2016/05/22'])
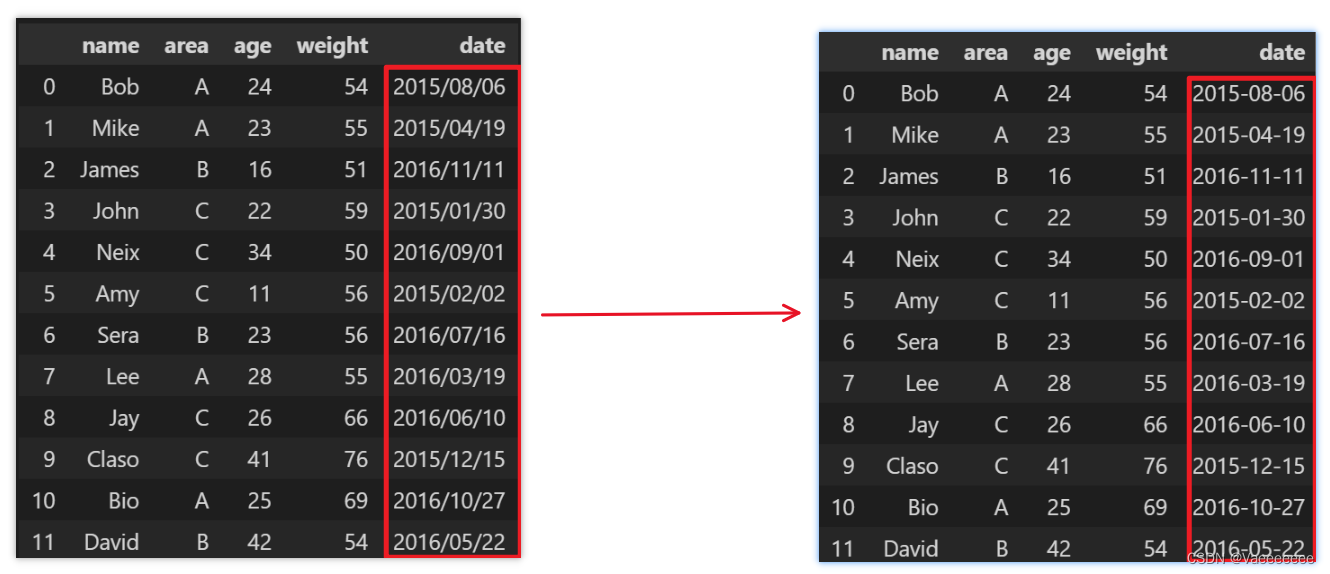
Convert data type to standard date type
data['date'] = pd.to_datetime(data['date'])
3.1 Basic commands
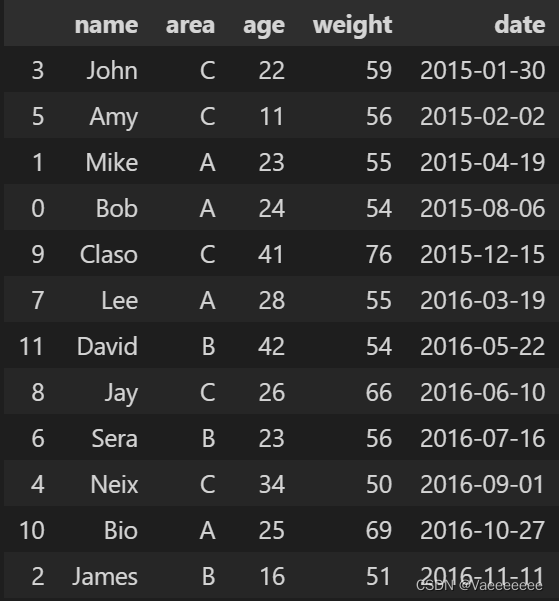
3.1.1 Arrange all data in chronological order
data.sort_values(by='date',ascending=True,inplace=False)
ascending:True is ascending order, False is descending order
3.1.2 Screen data for a certain time period - truncate method
truncate: Used to truncate time series data according to the given start and end timestamps. It can be used in DataFrame or Series objects indexed as DatetimeIndex, but you need to ensure that the index is sorted by time series before using it .
usage:
DataFrame.truncate(before=None, after=None, axis=None, copy=True)
or
Series.truncate(before=None, after=None, copy=True)
before: Extraction start time, the type is string or timestamp.
after: The extraction end time, the type is string or timestamp.
axis: optional parameter, if it is a DataFrame, you can specify 0 row axis or 1 column axis, the default is 0.
copy: If True, return the new DataFrame or Series or view; if False, return the original DataFrame or Series or view (if not copied), default True.
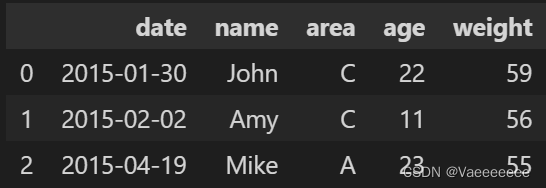
筛选得到2015年年初到年中的所有数据
# 将date列设置为索引
df = data.set_index("date")
# 对索引按照时间顺序排序
df.sort_values(by='date',ascending=True,inplace=True)

# 提取 2015-01-01 到 2015-06-30 之间的数据
start_date = "2015-01-01"
end_date = "2015-06-30"
df_1 = df.truncate(before=start_date, after=end_date)
df_1.reset_index()
3.2 Seasonal treatment
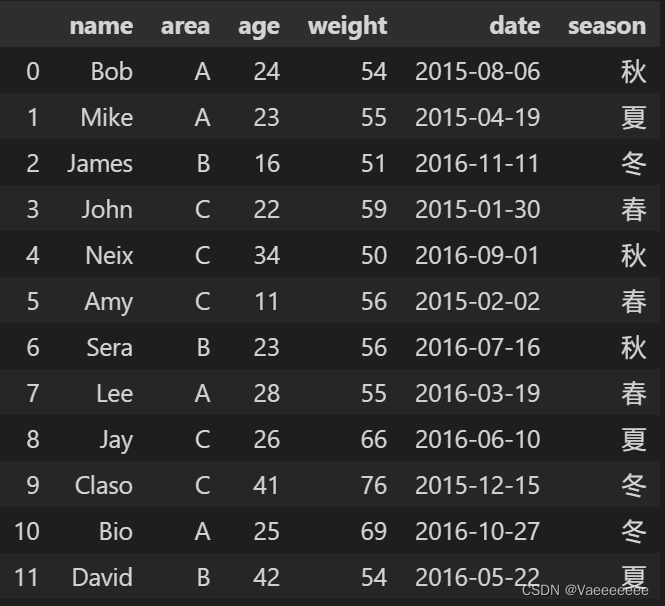
3.1.1 Divided by Lunar Calendar
| January to March | spring |
|---|---|
| April-June | summer |
| July-September | autumn |
| October-December | winter |
Code (effect: add a new column to get the season corresponding to each date):
# 使用dt.month属性获取每个日期的月份信息
months = data['date'].dt.month

# 根据月份信息生成季节信息
seasons = ((months + 2) // 3).map({

    1: '春', 2: '夏', 3: '秋', 4: '冬'})

# 将季节信息添加到DataFrame中
data['season'] = seasons
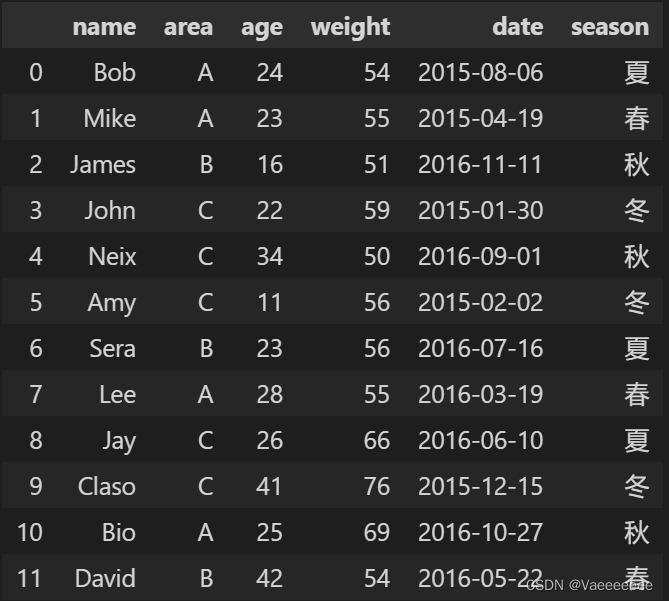
3.1.1 Divided by Gregorian calendar
| March-May | spring |
|---|---|
| June-August | summer |
| September-November | autumn |
| 12—February of the following year | winter |
Change the above seasonsto:
seasons = ((months % 12 + 3) // 3).map({

    1: '冬', 2: '春', 3: '夏', 4: '秋'})
Summarize
This article will be updated for a long time in the future, as a simple quick reference Pandas note, which is convenient for quickly dealing with some simple data analysis problems.