1. What kind of technology
•Baidu Encyclopedia:
Accurate Test is a computer-aided analysis system for testing.
The core components of precision testing include software test oscilloscope, bidirectional traceability of use cases and codes, intelligent regression test case selection, coverage analysis, defect location, test case cluster analysis, and test case automatic generation system. Test technology system.
• Other definitions
Accurate testing is a complete theoretical system with China's own intellectual property rights. It focuses on the methodology of function points and code-related logic at the same time. It is a gray-box testing mode.
When the precision test was first released at the International Software Testing Conference in 2014, it was called threading test. The English name was Threading Test, which expressed the essence of precision testing. The English word Threading itself has two meanings, one is threading and the other is Threads, establishing the relationship between use cases and codes, is equivalent to associating the black box with the white box. You can also see the white box data when doing black box testing. At the same time, you can link development and testing. Once the testing is completed, the development logic will immediately can be automatically generated. On another level, the essence of precision testing is thread testing, because precision testing is based on coverage white-box theory. The biggest difference between precision testing and white-box testing is that its coverage is at the thread level, that is to say, it must be traced back to the use case level.
2. Technology development
•History development

• Five-level classification of maturity model

3. Knowledge and skills
Here are two introductions, related to JAVA and C/C++,
First, the basic and core (programming) knowledge of development and the required version management tool (GIT), etc.
Second, domain-specific knowledge and technologies need to be possessed as follows:
JAVA: Javassist (official website - www.javassist.org/ ),
ASM3.0 (official website - asm.ow2.io/ ),
JaCoCo (official website - www.eclemma.org/jacoco/ ).
C/C++: assembly, disassembly, PE, reverse engineering (IDA).
To implement it in C/C++, there is nothing to say about versatility and efficiency, but the complexity and workload of instrumentation of various protocols, collection of code information, and workload are beyond the reach of ordinary people, so we must do a good job in mental construction.
When using JaCoCo directly, you need to pay attention to the coverage error. For some statement lines and branch levels, the error will be magnified exponentially. It is more suitable for assisting individual developers and small project teams in very basic evaluation of project coverage.
• Specific causes of errors:
1. A complex system usually consists of a large number of sub-modules, and JaCoCo cannot implement the instrumentation of internally called sub-modules, so there will be significant errors in the evaluation of sub-module coverage.
2. If a submodule is not called, then for JaCoCo, the method in the module is equivalent to not exist. JaCoCo needs to call this submodule in order to count the code in this submodule into the "denominator" of coverage calculation.
3. Except for several established logical accidents, JaCoCo cannot correctly handle exceptions (Exception). If an Exception is encountered in the control flow, JaCoCo will directly mark this situation as not covered. This judgment method directly affects the The control of the logical relationship of the program makes it impossible to accurately evaluate the coverage rate.
• Consequences of errors:
1. The creation of false bottlenecks and false overestimation of test quality. In the first case, after the testers have put in a lot of work, they cannot further improve the coverage rate, resulting in a waste of resources and practice; in the second case, users will mistakenly judge the substandard system as up to standard, which may lead to serious problems. production accident.
2. Defect location cannot be realized. A large number of algorithms and applications rely on the input of coverage, and defect location is the most important practice.
3. The accuracy of regression testing has been seriously affected.
• Non-destructive pile insertion technology (recommended)

The SABI and SASI introduced by the precise test are China's own technology
SABI, SourceCode Analyzer ByteCode Intrumentation, means that source code analysis, bytecode viewing, observation and analysis are in source code, and stub is in bytecode.
SASI, SourceCode Analyzer SouceCode Intrumentation, which is the most basic technology of traditional commercial white boxes, sometimes analyzes the source code and inserts it directly in the source code. After the source code is inserted, the code is compiled by a high-level language and a high-level compiler to directly generate the final release package. This is a completely lossless standard technology, and the execution reliability of the instrumented code is higher after being compiled by the compiler.
4. Summary and Introduction
outline

1. Test scope, code analysis

2. Differentiation

3. Call relationship

4. Measurement and Analysis

5. Quality assessment

6. Knowledge base and optimization

7. Pre-analysis of use cases

8. Automated testing and precise testing

5. Platform
>Design ideas
From product requirements, functional modules, developed codes to test cases, coverage from forward to reverse, traceability and visibility.

> Outline

>Call chaining and code coverage
It uses stub insertion, which is a bit similar to the Hook technology in C++, to obtain the required data information.

Protocols, HTTP, MySql, Dubbo, Redis, etc. need to be analyzed first to find the key insertion locations, and then use design patterns to collect (required) information.
Two design patterns are recommended, 1. reflection + adapter, 2. dynamic proxy.
Need to pay attention to the problem of code expansion.
>Range of influence
If there is an application system that develops a version A test, the HTTP interface is initiated through the front-end function, and the real-time snapshot of the platform receives the HTTP interface information, and the interface-related information (class, method, and number of lines of code executed) is saved as a system snapshot ; When version A is developed and becomes version A_01, use the platform to compare the two versions (Jar package or War package), and analyze the changed items and affected items through the information in the system snapshot, such as: classes, methods, and interfaces.

According to the menus and interfaces in the impact use case, go to the interface testing tool for execution.

>Implementation and Application
Visualize through data, display service/application startup, topology diagram, call chain, code coverage, version comparison and other information.

>>Item list
add, service/app

>>Project News

start, service/application

1. Search
A topology diagram that can display multiple services/applications

1) Details view


• Table structure, you can view the association between the interface and the database table

• Hotspots, you can view the number of associations between interfaces and database tables

2) Expand the snapshot

The nodes shown here are saved to the system snapshot.
• Table structure - database table, remote service - call rpc interface, source code - code relationship layer;


•Remote service, display remote call interface, such as dubbo interface;

• Source code relationship map, you can view the code relationship and coverage;

• Clear graph, clear table structure, remote service, source code relationship nodes;
• Details page, jump to the snapshot details page;
•Summary, showing pictures in snapshot details;
• Delete node, delete the displayed node;
3) search

• Search database tables, table names, field names, filter conditions;

• Search interface, HTTP interface;

2. Monitoring station
Obtaining protocol and code-related information in real time through the HTTP interface is different from obtaining code coverage through unit testing and then saving this information (my snapshot and system snapshot).

1) Real-time monitoring
Display the call chain of the interface and the information of each node on the chain in real time

2) My snapshot
It can be saved as my snapshot in real-time monitoring,
2.1) Visualization of call chain and link analysis
The call chain is the call chain topology layer of services and middleware; the link analysis is the code link analysis relationship map.
• In the "flow chart (topology map)", you can view the coverage backend and various middleware information;

• The "Stack List" displays the application name, type, service/method, time spent and other information of services and middleware;

• Click the "</>" pop-up window to display the code map (code link analysis relationship map), click a node, and then display the method name of a method, the number of code lines executed, the total number of codes, code coverage and circle complexity information,


According to a certain tail node, the start node can be found;

2.2) View code coverage report
Code coverage information list, displaying all coverage information in my snapshot list, class name, method name, number of executed code lines, number of method lines, coverage rate, cyclomatic complexity;

3. Application Center
1) Online application

2) Application
2.1) System snapshot

Snapshot directory, click the link to enter the system snapshot details page

System snapshot details page, basic information tab

System snapshot details page, flowchart tab

System snapshot details page, stack list tab, click </> to open the code relationship layer (code relationship chain)

2.2) Version comparison
The comparison file format is Jar or War package, and a record report will be generated after the comparison

After starting the comparison, the results show that you can view the report, display the difference items, (comparison) log output (new, modified, changed, deleted files and methods, the number of impacts of classes and methods)

2.2.1) Reporting
After the comparison is successful, check the report, display the changed items, affect the use case, and compare the logs; click the link that affects the use case, and it will jump to the (system) snapshot details page

Finally: The complete software testing video learning tutorial below has been sorted out and uploaded, and friends can get it for free if they need it【保证100%免费】
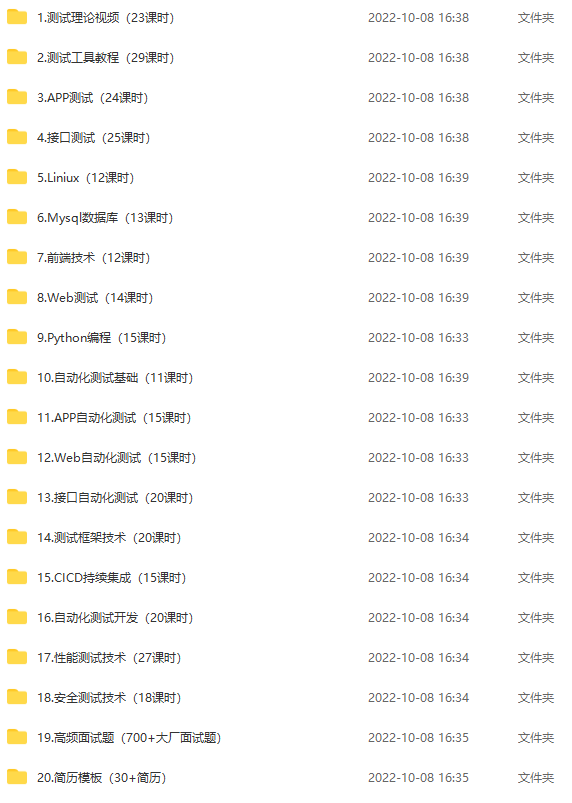
These materials should be the most comprehensive and complete preparation warehouse for [software testing] friends. This warehouse has also accompanied tens of thousands of test engineers through the most difficult journey. I hope it can help you too!